What Is a Concept Map
What is a Concept Map and what software is effective for its design?
Thinking about creating a concept map you should consider using the ConceptDraw DIAGRAM drawing software as it is one of the best tools for making such drawings.
To make the mentioned map it is necessary to known what a concept map means at all. Any concept map may be also being called as a conceptual diagram, which is simply a diagram depicting the suggested relationships between different concepts. Being a very popular and commonly used graphical tool, it very widely used among the instructional designers, technical writers, engineers and other users of ConceptDraw DIAGRAM application.
One of the reasons of using ConceptDraw DIAGRAM diagramming and drawing application for making the mentioned concept maps can be to enable yourself to organize as well as structure some particular knowledge in a form of such map, as any data can be always illustrated in a better way than text, so it becomes much simpler to understand all the needed relationships as well as the connections between its parts.

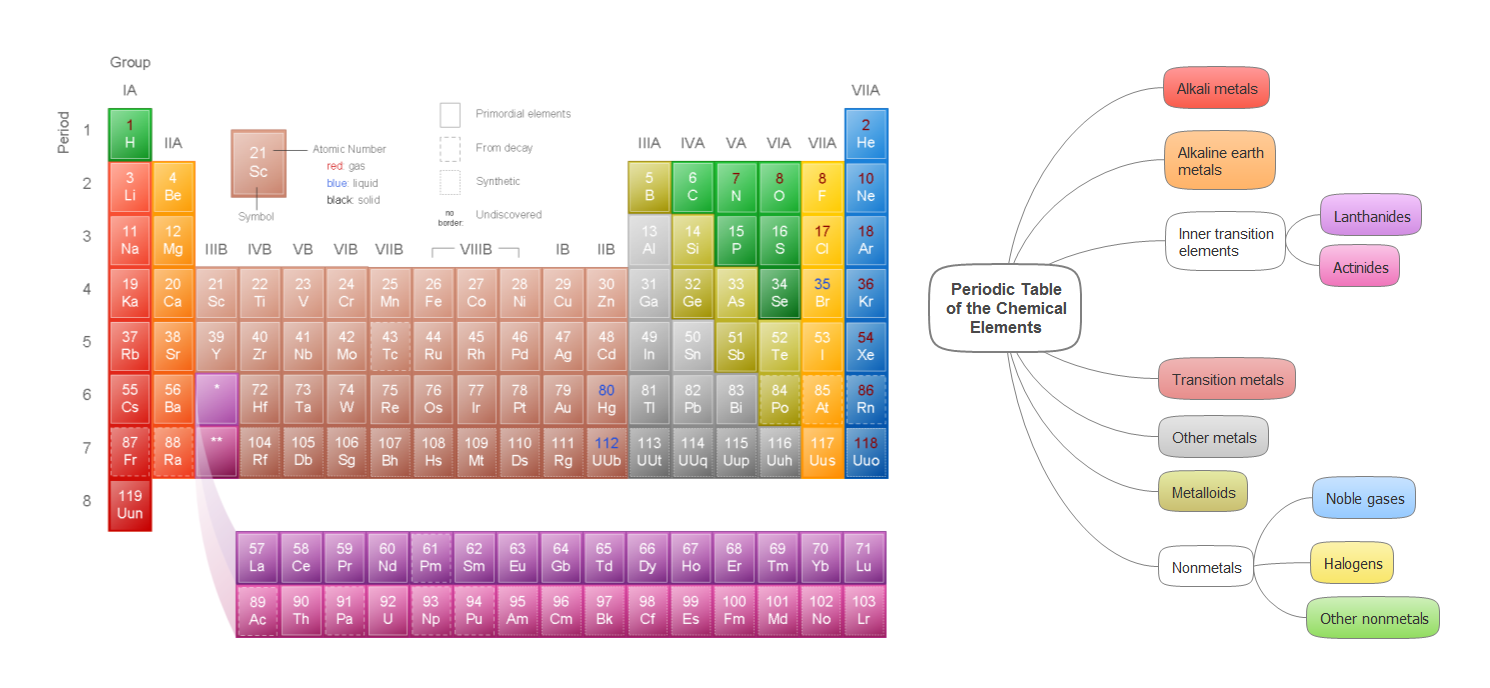
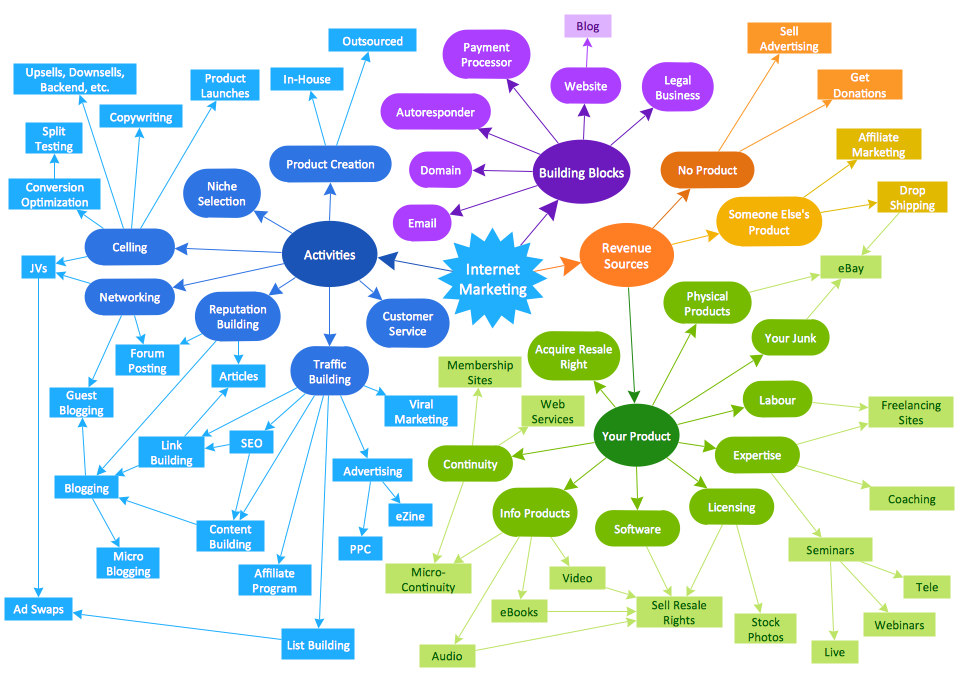
Example 1. What Is a Concept Map?
Any concept map is known to be usually representing the ideas as well as the information in a way of boxes or, sometimes, circles. Thus, every content map has such circles or boxes connected with the labelled arrows in a so called “downward-branching” structure, a hierarchical one. All the relationships between different concepts may be always articulated in any required linking phrases.
One of the techniques for visualizing such relationships among different concepts is known to be called a concept mapping which are widely used for defining the ontology of the computer systems, such as in the object-role modelling or the formalism of the UML.
Any concept map is simply a way of presenting different relationships between ideas, words and images in a similar way that such diagram as a sentence one can represent the grammar of some sentence. A road map, for example, is known to be representing the locations of highways as well as cities and towns. Another type of a diagram — a circuit one — represents if an electrical appliance works.
When we talk about a concept map, each of the words or phrases used within it all are connected to each other, linking back to the original word, phrase or the whole idea. The concept maps are very convenient in use for developing the logical thinking as well as the study skills in a way of revealing all the connections as well as helping the students to see all the individual ideas forming a larger whole one.
Developed for enhancing the meaningful learning in the sciences, the concept maps are mainly based on a well-made concept: it grows within a particular context frame known as a "focus question". At the same time a mind map is known to be having only a few branches radiating all the ways out from one central picture. Being constructed for reflecting the organization of the declarative memory system, concept maps are known to be facilitating the meaningful as well as sense-making learning on the part of individuals who use such concept maps and those who make them.
There are some features which differ the concept maps from other visualizations. For example, they are quite similar to the topic maps as it is allowed to use the topics or concepts via graphs in both of them, but still concept mapping, which was developed by Joseph Novak, is known to be unique in its basis, making concepts as well as propositions composed of concepts the central elements in one structure of the knowledge and construction of meaning if to compare them to the other various techniques and schema for visualizing processes, organizations and ideas.
Concept maps are also quite similar to the mind maps as well as the topic maps, being contrasted with mind mapping, known to be restricted to tree structures and radial hierarchies. There’s, though, a contrast between mind mapping and concept mapping, which is the spontaneity and the speed when a mind map is finished to be creating. Any mind map can reflect what exactly you think about as a single topic, helping to focus the group brainstorming.
Any system view, a map, of a real or an abstract system as well as the set of the concepts can become a concept map, which are known to be free form for a reason of the multiple clusters and hubs created, fixing on a single two centred approach. There were many different attempts which were made for conceptualizing the process of creating the described concept maps. The process of making knowledge explicit by using relationships and nodes allowing someone to become aware of what he or she knows and so to be able to modify what exactly he or she know was suggested as the best one.
Concept maps are also used for stimulating the generation of ideas, aiding a creativity. As it was already mentioned before, the process of a concept mapping is also sometimes used for brain-storming, nevertheless they are often personalized. Known to be idiosyncratic, the concept maps can also be used as one of the best tool for communicating the complex ideas.
The so called formalized concept maps are known to be widely used in software design, where a common usage is a UML diagramming amongst similar development methodologies and conventions. The concept mapping can be found to be a first step in so called “ontology-building”, being also used for representing the formal argument in business and education, reminding the argument maps.
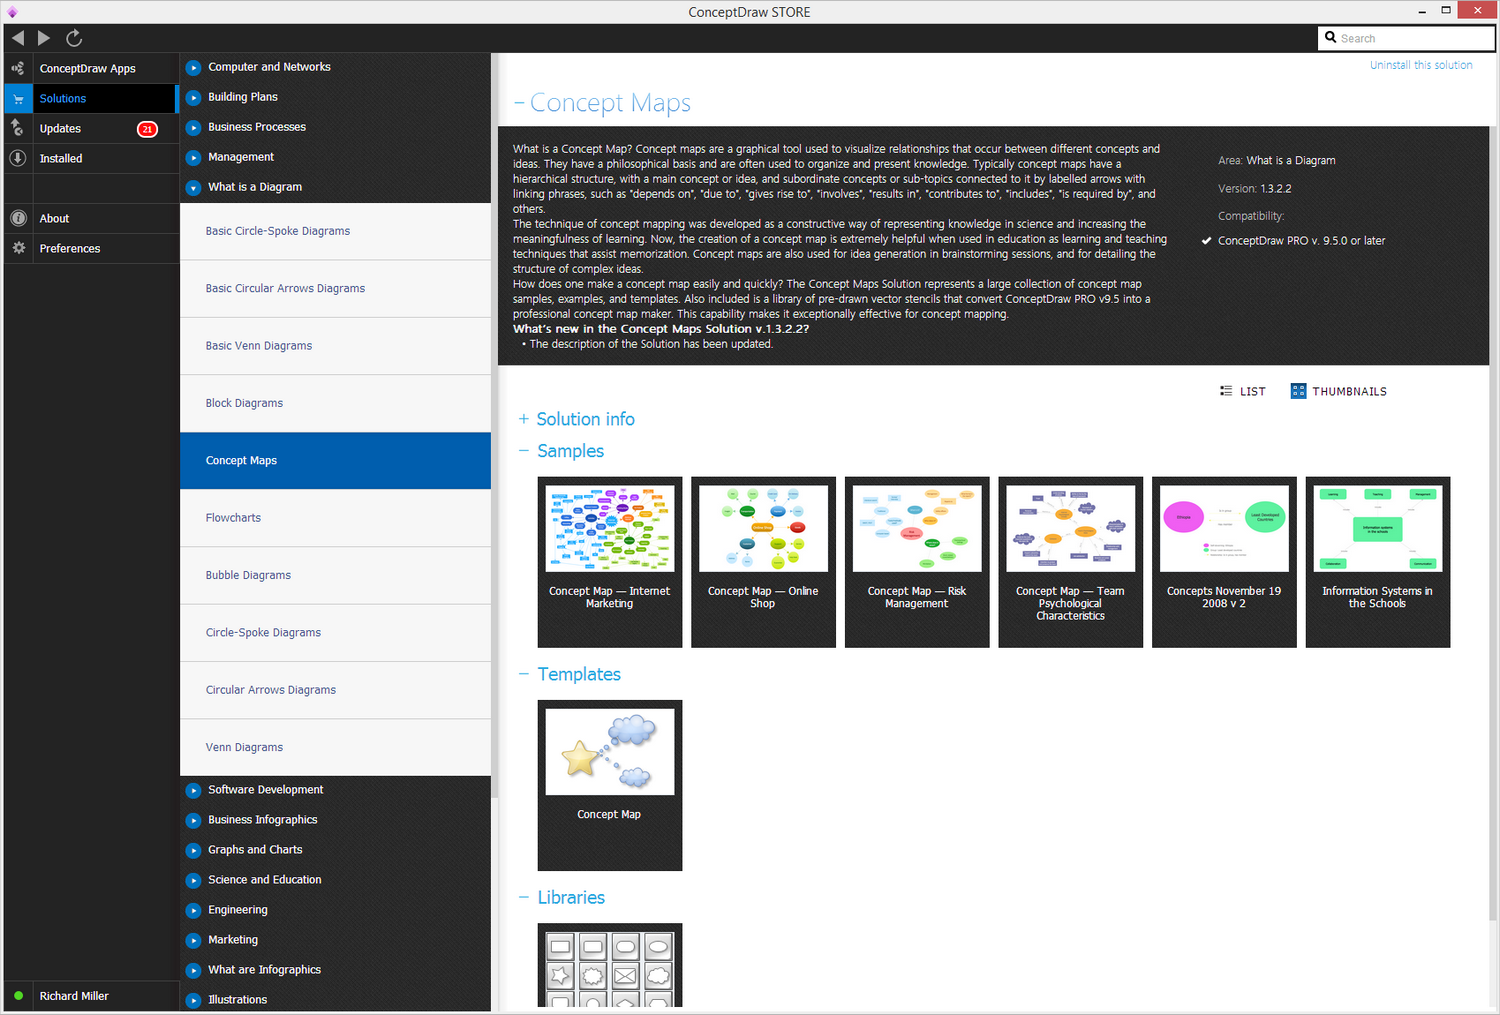
Example 2. Concept Maps Solution in ConceptDraw STORE
Thinking about making any needed concept map, you must be considering using a ConceptDraw DIAGRAM diagramming and drawing application as well as Concept Maps Solution from a ConceptDraw STORE, which is another very useful product of CS Odessa. Having the mentioned application means having lots of samples of the previously created concept maps, such as “Concept Map — Internet Marketing”, “Concept Map — Online Shop”, “Concept Map — Risk Management”, “Concept Map — Team Psychological Characteristics”, etc. Using the mentioned samples as the drafts for your own drawing will enable you to create your own concept maps within only a couple of minutes.
Example 3. Concept Map — Internet Marketing


