
Pic.1 Event Driven Process Chain (EPC) Diagram
The Event-driven Process Chain Diagrams solution extends ConceptDraw DIAGRAM software with EPC templates, samples, and vector shape library for the drawing of EPC diagrams.
How to Draw EPC Diagram
The Event-driven Chain Diagrams solution assists in the planning of resources and improves business processes using EPC flowcharts.
Follow these steps to be successful in creating EPC diagram.
- Launch ConceptDraw DIAGRAM
- Set page orientation: File menu – Page Setup – Horizontal Orientation – Ok.

- Open Event-Driven Process Chain Diagrams (EPC) library from the Libraries panel.

- From the library take necessary objects. Place them on the page.
- Using Control dots adjust size of the objects.

- Add text to objects. Just click the object – Type.
Note: Use yellow diamond to move text inside the object.

- Select all objects (Cmd+A) – Open Inspectors – Text tab.
- Set Font, Font size, Color.

- Holding down Shift button deselect Database and System objects.
- Open Inspectors – Line tab - Deselect Stroke.

- Select Database and System objects.
- Open Inspectors – Line tab –Change color.

- Open Inspectors – Fill tab – Change color of the objects.

- Select all objects excluding Database objects.
- Shape menu – Make same – Size.

- Use Align and Distribute options from the Toolbar to arrange the objects.

- Using Direct and Rounded Conncectors from the Toolbar connect objects in needed direction.
Note: Using Yellow diamonds you may arrange Rounded Connectors.

- Inspectors – Layers tab - Select another layer for Background. Lock previous layer.

- File menu –Document Properties – Page Size – Adjust to Drawing Contents –Ok.

- Open Drawing Shapes library from Libraries panel. Take Rectangle object. Place it on the page.
- Using Control dots make size same as a Page size.

- Send it to Back using the option from the Toolbar.

- Open Inspectors – Line tab – Deselect Stroke.

- Open Inspectors – Fill tab – Change color.

- Inspectors - Layers tab – Go back to Layer 1 - Lock Background layer.

- Now your Drawing is ready.

- You may save it or export to different formats via File Menu.

NINE RELATED HOW TO's:
ConceptDraw DIAGRAM is a Mac OS X and Windows software. Numerous vector stencils, samples and templates created by designers are included in the basic package. This is classic flowchart maker which exactly follows the industry standards using flowchart symbols geathered during a ten years into solution park.
Picture: Flowchart Software
Related Solution:
ConceptDraw DIAGRAM software extended with the Baseball solution delivers samples with diagrams of the most popular plays in baseball.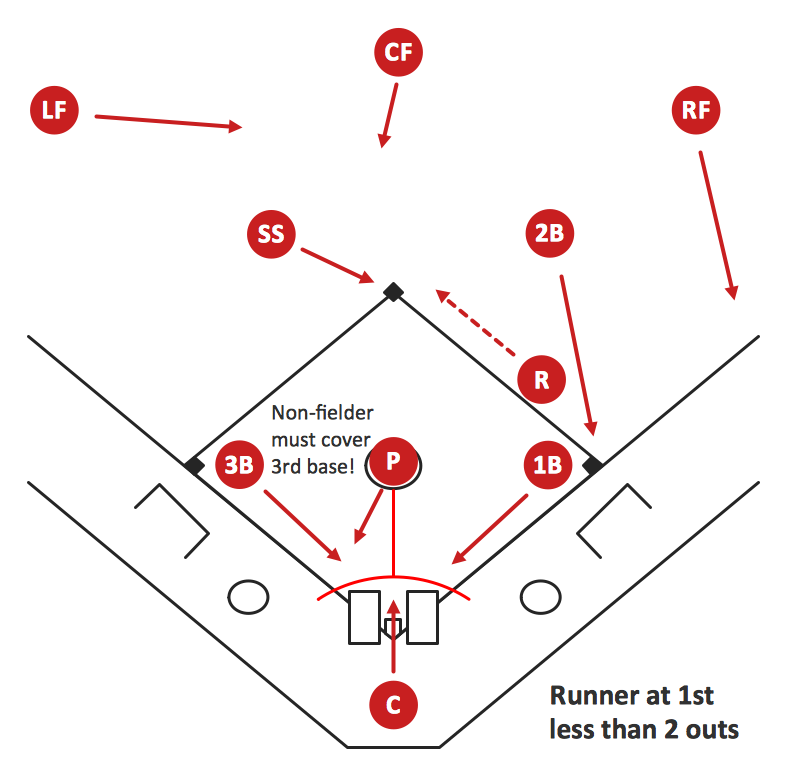
Picture: Baseball Diagram – Basic Bunt Coverage – Runner at 1st
Related Solution:
Computer networks nowadays are spread all across the world. The large number of parameters, such as geographic scale or communication protocols, can divide networks. One of the most common types of networks is called local area network (LAN). It convenient to represent network examples by means of diagrams.
This local area network (LAN) diagram provides an easy way to see the way the devices in a local network are interacted. The diagram uses a library containing specific symbols to represent network equipment , media and the end-user devices such as computers (PC, mac, laptop) , network printer, hubs, server and finally a modem. There are two types of network topologies: physical and logical. The current diagram represents precisely a physical type of LAN topology because it refers to the physical layout of a local network equipment.
Picture:
What is a Local Area Network?
Examples of LAN Diagrams
Related Solution:
Diagrams are a very important part of modern life. With the help of flow diagram software, a lot of companies can promote their ideas at the market. Its usefulness is totally doubtless.
This is a flow chart of the invoice payment flow. This flowchart details decrypts all stages of the process of obtaining and paying bills. It is a description of the universal process - such steps performs accounting departments of almost any organization. Since every business no matter what it does is a consumer of some goods or services. The given flow chart was made using ConceptDraw DIAGRAM software and the Diagrams solution for making flowcharts of any kind.
Picture: Flow Diagram Software
Related Solution:
A transistor is a semiconductor device used to amplify or switch electronic signals and electrical power. It is composed of semiconductor material usually with at least three terminals for connection to an external circuit. A voltage or current applied to one pair of the transistor's terminals changes the current through another pair of terminals. Because the controlled (output) power can be higher than the controlling (input) power, a transistor can amplify a signal. Today, some transistors are packaged individually, but many more are found embedded in integrated circuits.
26 libraries of the Electrical Engineering Solution of ConceptDraw DIAGRAM make your electrical diagramming simple, efficient, and effective. You can simply and quickly drop the ready-to-use objects from libraries into your document to create the electrical diagram.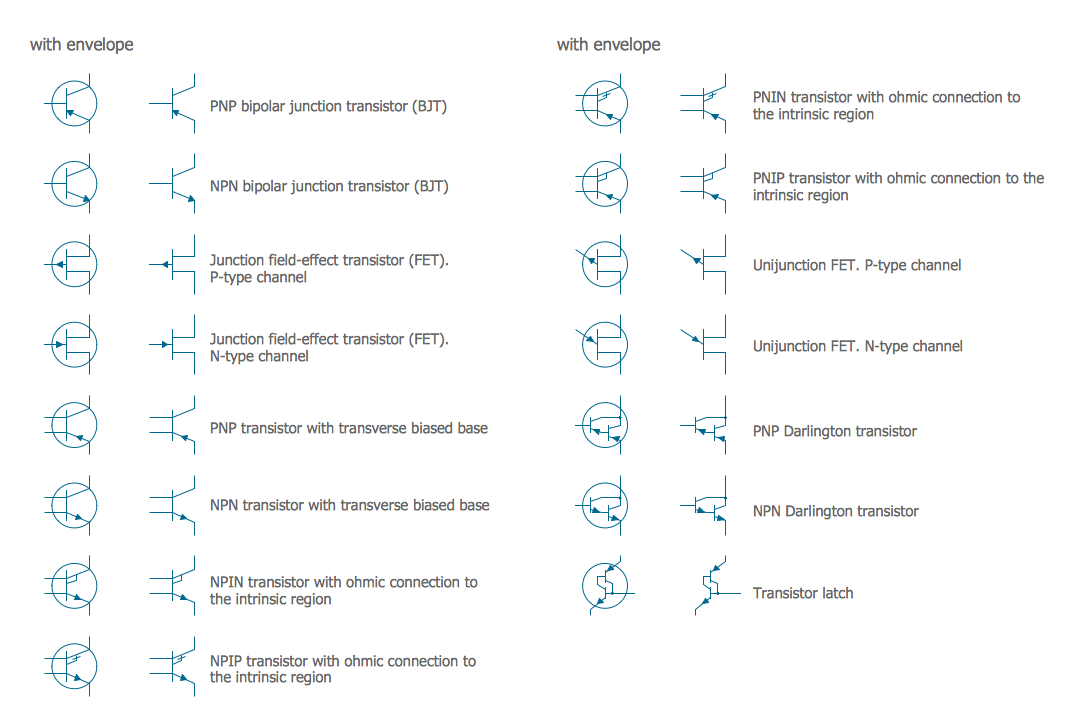
Picture: Electrical Symbols — Transistors
Related Solution:
There are numerous articles about the advantages of flowcharting, creating business graphics and developing different charts. Nevertheless, these articles are almost useless without the main component - the examples of flowcharts, org charts and without a fine example, it is difficult to get all the conveniences of creating diagrams. You can find tons of templates and vivid examples on Solution Park.
This illustration shows a variety of business diagrams that can be created using ConceptDraw DIAGRAM. It comprises a different fields of business activities: management, marketing, networking, software and database development along with design of infographics and business illustrations. ConceptDraw DIAGRAM provides a huge set of sample drawings including business process modeling diagrams,, network diagrams, UML diagrams, orgcharts, DFD, flowcharts, ERD, geographical maps and more.
Picture: Examples of Flowcharts, Org Charts and More
Related Solution:
The entity–relationship (ER) model is a data model that lets graphically represent the information system and depict the relationships between people, objects, concepts, places, and events within a given system. It is also convenient to use the ER Diagram for Cloud computing representation and description the Cloud computing architecture, design them with pleasure using the extensive tools of the Cloud Computing Diagrams solution from the Computers and Network area of ConceptDraw Solution Park.
Picture: ER Diagram for Cloud Computing
Related Solution:
Process mapping helps with sharing business results and reorganizing workflow. In almost every case, after creating a sales process flowchart the steps that are redundant become obvious for a manager. It's easy to find a flowchart examples that will help in developing one for your business.
This sales process flowchart consists of a sequence of steps that represent a simple sale process. Each step is shown graphically by a rectangle representing processing steps or an activity, or a diamond representing a decision. These rectangles are linked by arrows, that indicate the direction of the sales workflow. ConceptDraw Sales Flowcharts solution delivers a the full set of classical flowchart notation symbols, along with sales-related icons and pictograms.
Picture:
Sales Process Flowchart
Flowchart Examples
Related Solutions:
Event-Driven Process Chain Diagrams for improvement throughout an organisation.
ConceptDraw DIAGRAM - software that reduces the time needed to create a business process model.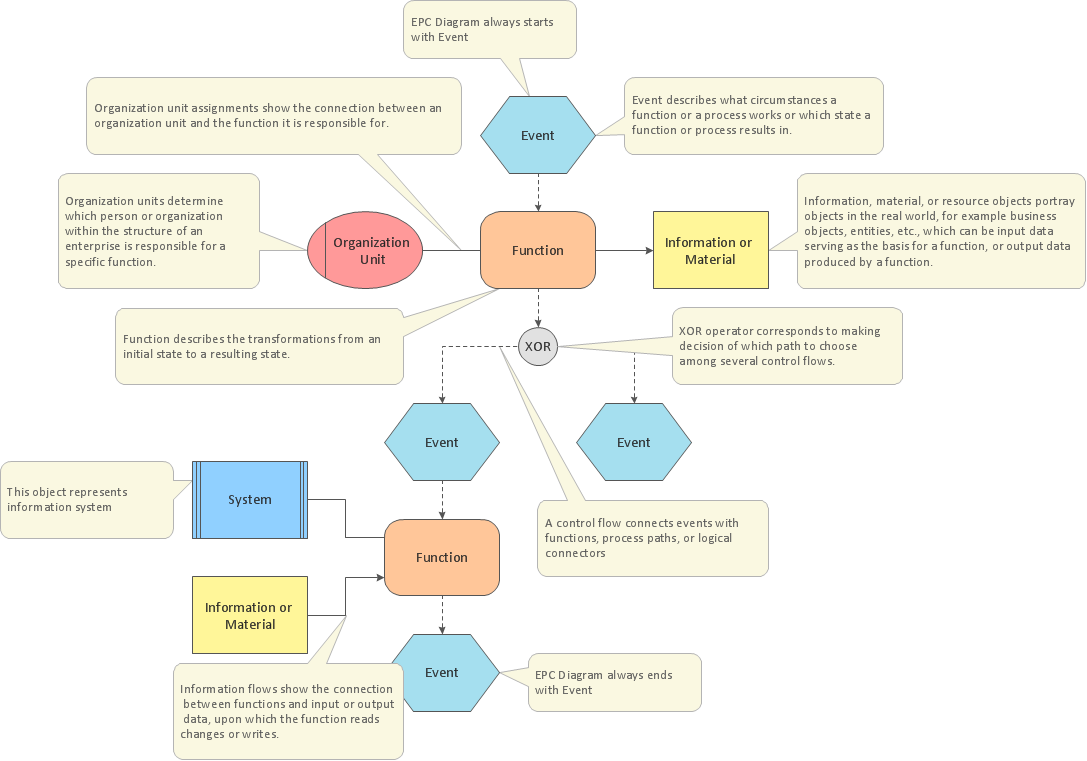
Picture: Business Process Modeling with EPC
Related Solution:


