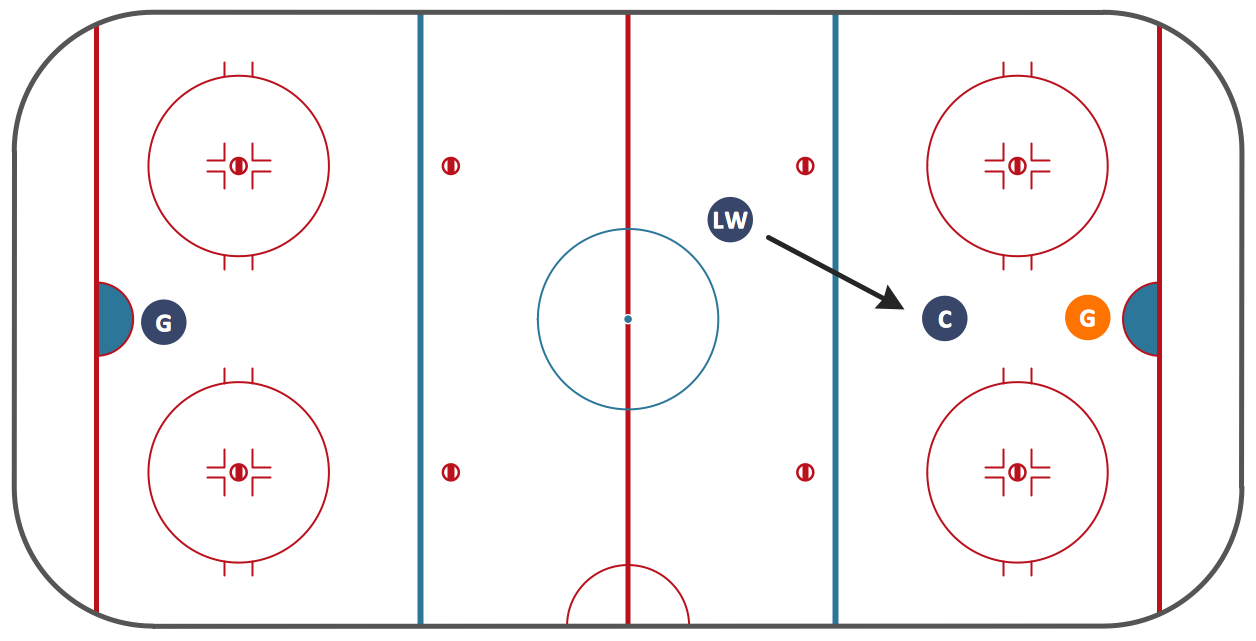
Defensive Strategy Diagram – 46 Defence
There are many defensive formations within the well-known game of football (American football), which all can be illustrated with help of the Football solution – a useful tool for making the football related drawings within a short period of time as everything you need can be found there. Having both ConceptDraw DIAGRAM diagramming and drawing software and Football solution downloaded from ConceptDraw STORE will ensure your success with creating the mentioned charts.

Sample 1. Football Solution in ConceptDraw STORE
It is well-known that there are no rules regarding the formation of the defensive players in football as well as their movement before they snap of the ball. That is why the tactics and deployment of defensive players are connected only by the imagination of the line of scrimmage and the play designer. The most popular defensive formations used in football are 4–3 defense, 6–1 defense, 2–5 defense, 5-3 defense and 6-2 defense.
4–3 defense consists of four defensive linemen as well as three linebackers and four defensive backs, two of each are safeties and corners. This formation is known to be very effective against the pass and the run. The defensive tackles line up opposite the offensive guards, having the defensive ends straight on the outside shoulders of the offensive tackles. On the passing downs, the middle linebacker is known to be often responsible to cover any appeared running backs, the strong-side linebacker covers the so-called Tight End and the weak-side linebacker blitzes or covers a back in an attempt of sacking the quarterback.
For the first time the previously mention defense was used as a base in 1956 by the New York Giants, but later lots of teams experimented with it during the 50s, so there are multiple claimed inventors of it. There are a few different variations of the 4–3 defense such as the 4-3 over defense, 4-3 under defense, 4-3 umbrella defense, 4-3 slide defense and 4-3 swim defense.
Another, 6-1 defense, originally was invented in 1950 by Steve Owen as a counter for the powerful passing attacks of Cleveland Browns, being called the "Umbrella" defense. The reason for such name was chosen because of the four defensive backs and the tactic of allowing the defensive ends to fall back into the pass coverage, which is converting the defense. Using this defense, the Giants defeated the Browns during the regular season in 1950 twice.
The so-called “2–5 defense” was originally a 5–2 arrangement, with two linebackers and five defensive linemen.
The 5-3 defense is based on two standard formations, which are the 5-3-3 and the 6-2-3. It consists of five defensive linemen, three defensive backs (two corners, one safety) and three linebackers and it appeared in the early thirties as a response to the need of improving the passing offenses of the time, such as the T formation. Growing in importance as the 40s progressed, it became more effective versus the T formation than the other standard defense of the time. Five man lines by 1950 were standard in the NFL, either the 5-2 Eagle or the 5-3. The Cleveland Browns were using a 5-3 as their base defense.
The 6-2 defense is known to be consisting of six defensive linemen, three defensive backs (two corners, one safety) and two linebasockers. As the primary defense in football at all levels, during the 1930s, combining enough passing defense to handle the passing attacks along with the ability to handle the power running games of the times, this formation was replaced in the NFL with the 5-2 and the 5-3 defenses after the T formation grew popular in the 40s.
In lots of different colleges, the mentioned defensive front has remained viable for a much longer period of time for a reason of colleges are known to be having run a lot more than the NFL. There are common six-man fronts which are seen in this era, which are the tight six (four linemen between linebackers, linebackers over offensive ends), the split 6 (all linemen outside linebackers, linebackers over guard-center gap) and the wide tackle 6 (two linemen between linebackers, linebackers over offensive tackles).
38 defense is also known as a “split middle”, being referred to the positions of the defensive players on the so-called “line of scrimmage”. The DT's are known to be the only down lineman. Two stand-up players (Rover and Monster) are in "5" techniques when two linebackers are 3 yards off the ball behind the mentioned DT's. A combination of the 6–2, 46 and 4–4 is designed to confuse the offenses and to stop the run.
Three players in the secondary all cover the “deep thirds” and the confusing element is either the "8" techniques or the "5" techniques can drop or rush into the flats. The LB's have the so-called “hook zones”. Each of the football players on the line has a two gap responsibility which they have to perform.
The “seven-man line defense” uses 7 down linemen on the line of scrimmage and the most common seven-man line defenses were the 7-1-2-1 defense and the 7-2-2 defense. The mentioned defenses were most of all commonly used before the forward pass became prevalent. Although, they were still popular before the inception of the so-called “platoon system”, being still sometimes used in such situations, as the goal-line ones.
The 5–2 defense is another technique consisting of five defensive linemen, four defensive backs (two safeties, two corners) and two linebackers. Originally, this was the first important defense with four defensive backs, being used for combating the passing attacks of the time. The Oklahoma 5-2 is a later evolution of the original 5-2, which is known to become the professional 3-4 once the defensive ends of the original “5-2” are substituted for the 3-4 outside linebackers.
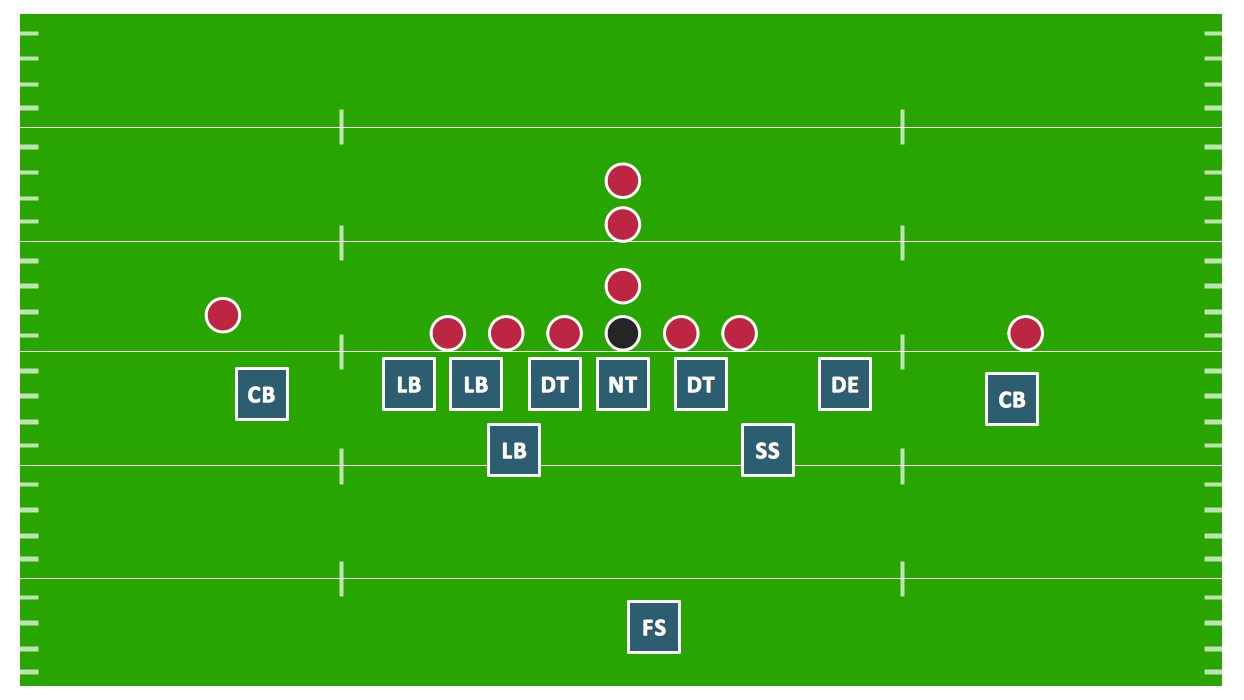
Sample 2. Football — Defensive Strategy — 46 Defence.
The differences between the 3-4 and the Oklahoma 5-2 are largely semantics and getting to know about all the existing defensive strategies is always better with the help of ConceptDraw STORE, especially the Football solution, where all the ConceptDraw DIAGRAM users can find the pre-made examples of the positions they can always use as the drafts for their own drawings.