Made with
ConceptDraw
DIAGRAM 17

Business diagrams & Org Charts with ConceptDraw DIAGRAM

ConceptDraw is a powerful cross-platform professional business graphics application that will help you visualize and structure information, add illustrations and drawings to your documents.

  • Business Charts and Diagrams
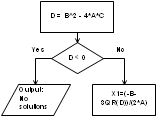
    • Flowcharts : Basic flowcharts, Audit Flowcharts, Cause-Effect (Fishbone) Diagrams, cross-functional vertical and horizontal diagrams, data flow diagrams, opportunity flowcharts, workflow diagrams.
    • Organization Charts.
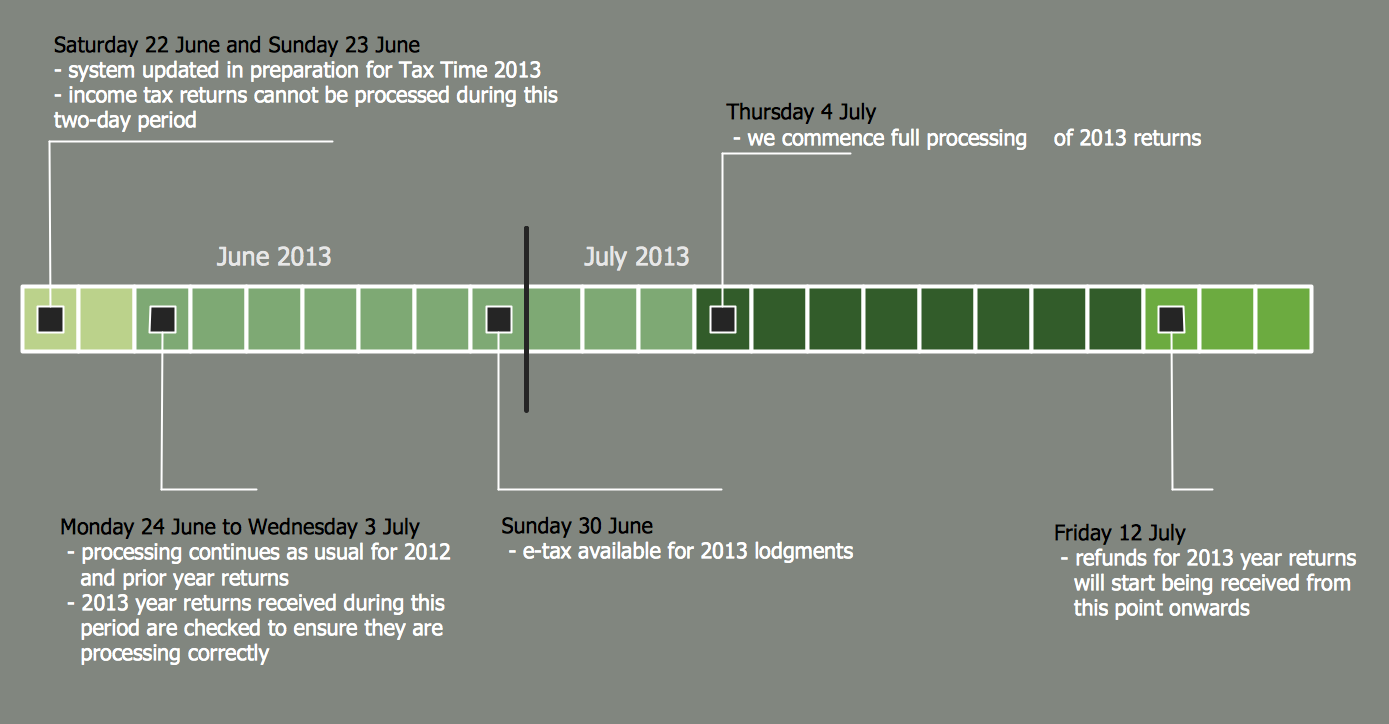
    • Project management: Gantt charts, Project Schedules, Pert charts, Calendars, Timelines, planners.
    • Comparison charts.
    • Criminal Analysis Charts.
    • Block Diagrams and Bar Charts.
    • Pyramids, Target diagrams, Venn diagrams, other marketing diagrams.
  • Business Processes
    • (IDEFO) Diagram
    • TQM Diagram
  • Building plans
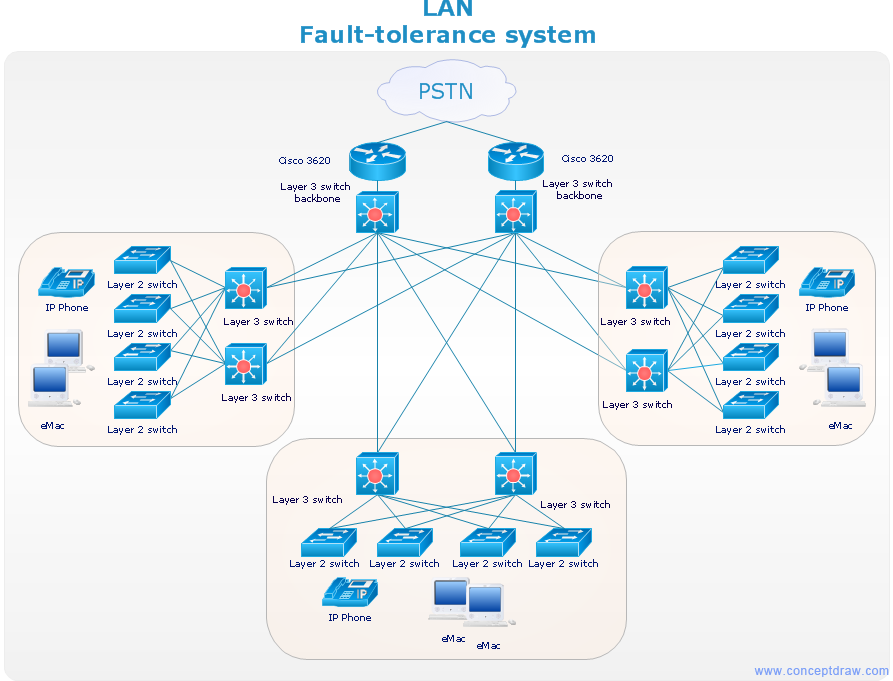
    • Office layouts, Electric and telecom plans, Expo and shopping mall plans, HVAC plans
    • Plumbing and piping plans, Reflected ceiling plans, Seating plans, Security and access plans
  • Forms and maps:
    • Fax cover sheet, Invoice, Sales order
    • Geo-maps, Directional 2D and 3Ds


    Even if you are not a real artist, this business visualization tool is for you. ConceptDraw DIAGRAM contains hundreds of built-in collections of task-specific Symbols, Templates and Wizards that allow managers to quickly create professional-looking charts and diagrams.


    Flowcharts
    Use a variety of drawing tools, smart connectors and shape libraries to create flowcharts of complex processes, procedures and information exchange. Define and document basic work and data flows, financial, production and quality management processes to increase efficiency of you business.
    ConceptDraw contains libraries and templates for audit flowcharts, data flow diagrams, cause & effect diagrams, cross-functional flowcharts and more.
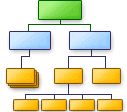


    Organization charts
    Represent the company's structure and detailed staff information as a single or multi-page org chart.
    Support for multi-page documents allows to create very complex and detailed charts, connected with hyperlinks, which can be then exported to HTML for use on the corporate Web site.
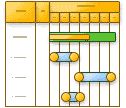


    Project Management
    Outline project schedules in clear Gantt charts and timelines, assign milestones and deadlines, use a number of smart calendar shapes. Your schedules can be printed, published on the web or exported to PowerPoint for a presentation.


    Timelines and calendars
    Draw and print out simple project timelines with ConceptDraw. Templates and pre-drawn shapes help you do most of tasks requiring no high-cost specialized software.
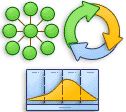


    Sales and marketing visuals
    Illustrate market survey results, create comparison charts of competitive products, use Venn charts to analyze existing opportunities. Compose a full set of charts and diagrams to overview different marketing aspects.
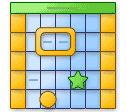


    Basic office layouts
    Use pre-drawn shapes of office equipment and furniture to create office and home plans quickly and easily.


    Building, site and floor plans
    Create office and home plans, security plans, plant layouts, HVAC schemes, floor and building plans with ConceptDraw DIAGRAM and many others. Use layers, customizable grid and guidelines, hundreds of pre-drawn shapes.
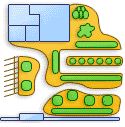
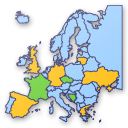


    Directional and geo maps
    Use ConceptDraw for sketching parking plans, driving directions, create schemes of road accidents. A large collection of geographic libraries contains shapes that accurately represent all countries and continents.


Business diagrams & Org Charts with ConceptDraw DIAGRAM  *

TEN RELATED HOW TO's:
Value Stream Mapping for the lean office is a tool that uses a flow diagram to document in great detail every step of a manufacturing process.Value Stream Mapping for the Lean Office *
Picture: Value Stream Mapping for the Lean Office
Related Solution:
Value Stream & Process Flow Diagramming Software is a very popular Lean Manufacturing tool that allows to see and visualize in details the company's processes and current state, the flow of material and information, and thus gives the possibility to analyze the efficiency of company's processes and then develop improved processes. Value stream maps are also a good way to define the steps that do not add value to the end product, in other words waste in a company's processes.Value Stream & Process Flow Diagramming Software *
Picture: Value Stream & Process Flow Diagramming Software
Related Solution:
When thinking about data visualization, one of the first tools that comes to mind is a flowchart design. You can find flowchart symbols, shapes, stencils and icons easily on the Internet, but it might take time to systematize this information. Nevertheless, once you start flowcharting, you’ll love its simplicity and efficiency. This diagram consists from standard flowchart symbols, approved by ANSI (American National Standard Institute) for drawing flowcharts. A flowchart is a diagram that represents a step-by-step algorithm of any process, displaying the process stages as boxes that are connected with arrows. Flowchart design makes it clear and readable. Flowchart designed using ConceptDraw DIAGRAM flowchart software allows to make attractive and clear process presentation, it makes interpretation of the business process flow fresh and versatile. Great flowchart design view is a big advantage over the diagram created manually on a paper.Flowchart design
Picture: Flowchart design. Flowchart symbols, shapes, stencils and icons
Related Solution:
Structured-systems analysis and design method uses data flow diagrams to represent the process of data flowing through a system. Talking about this might be useless without a proper example of DFD for online store (Data Flow Diagram). This DFD example shows all the distinctness that a diagram can bring into a scattered data structure. Data flow diagrams are used to show how data is processed within some business processes. Making DFD is a common practice for business process modeling and analysis. This diagram represents the online store business flow. It describes inputs and outputs within online selling process and depicts the interactions between its participants. This DF diagram can be used by system analysts to create an overview of a business, to study and discover its inherent strengths and weak points.Example of DFD for Online Store
Picture: Example of DFD for Online Store (Data Flow Diagram)
Related Solution:
Sometimes, when it is difficult to create a functional space plan or to rearrange existing one, the art of interior design comes in. It doesn't matter, if you need a cozy bedroom or an office layout plan, you should use appropriate tools to make your design great. While making a floor plan of a new office it could be useful to apply some design elements such as furniture and office equipment. This diagram presents an office furniture objects that can be used for office interior design planning, or making office furniture and equipment layouts. This vector stencils library is supplied with ConceptDraw Office Layout Plans solution. It contains more then 30 vector objects of office interior for making office floor plans including an office space layout plans and furniture arrangement.Office Layout Plan Design Element
Picture: Interior Design. Office Layout Plan Design Element
Related Solution:
When we think of an hierarchy, we intuitively imagine a pyramid. Thus, a lot of management tools use pyramid charts as examples or illustrations of various documents or models. You can create any type of triangle diagram using ConceptDraw DIAGRAM. A triangle (pyramid) diagram is often used in marketing to show the data hierarchy. This pyramid diagram represents the Top Brand Model. It illustrate the model of rebranding strategy. It can be used by marketing agency dealing with rebranding strategies development. It’s critical for marketing diagrams to be both clear and eye catching. ConceptDraw Pyramid diagrams solution meet all these requirements and can be successfully applied for creating and presenting various marketing pyramidal diagrams.Pyramid Chart Examples *
Picture: Pyramid Chart Examples
Related Solutions:
Try ConceptDraw program, the perfect drawing tool for creating all kinds of great-looking drawings, charts, graphs, and illustrations.Basic Diagramming *
Picture: Basic Diagramming
Related Solution:
ConceptDraw DIAGRAM diagramming and vector drawing software offers the Fault Tree Analysis Diagrams Solution from the Industrial Engineering Area of ConceptDraw Solution Park for quick and easy creating the Fault Tree Diagram of any degree of detailing.Fault Tree Diagram *
Picture: Fault Tree Diagram
Related Solution:
You can design the Prioritization Matrix by hand on the paper, but we offer you the most easier way — to use the ConceptDraw DIAGRAM diagramming and vector drawing software extended with Seven Management and Planning Tools Solution from the Management Area.Prioritization Matrix *
Picture: Prioritization Matrix
Related Solution:
ConceptDraw
DIAGRAM 17