eLearning - Easy English on Skype
Skype eLearning
ConceptDraw MINDMAP provides effective learning process with eLearning for Skype solution available to deliver English lessons to a remote group via a Skype conference call.
The mind map as an eLearning tool maximizes the efficacy of the customized documents witch can include embedded files, hyperlinks and mind map objects.
eLearning for Skype solution as a communication and training tool allows teachers to meet students online and run Speaking English training sessions.
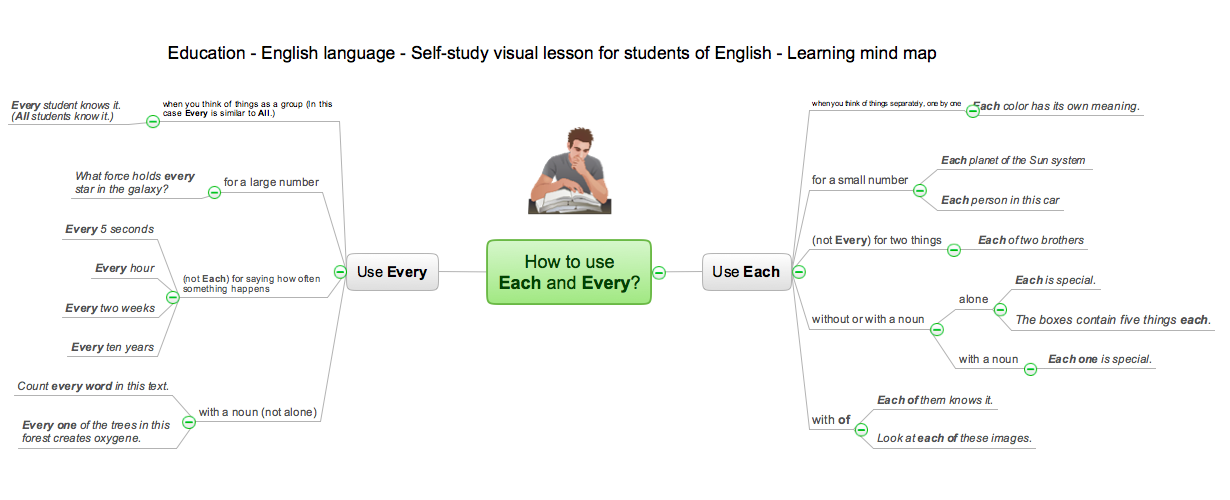
Sample 1. How to use Each and Every mind map sample
for ConceptDraw eLearning for Skype solution
This is example of mindmap for English language e-Learning via Skype.
Use ConceptDraw MINDMAP enhanced with the solution eLearning for Skype to educate and study online.
See also Samples:
-
Mind Maps
-
Mind Map Exchange
-
Marketing — Mind Maps
-
Mind Maps — Idea Communication
-
Mind Maps — Presentation Exchange
TEN RELATED HOW TO's:
UML Collaboration Diagram depicts the interactions between objects or parts in terms of sequenced messages and describes both the static structure and dynamic behavior of a system.
Rapid UML solution provides templates, examples and libraries of stencils for quick and easy drawing all the types of system and software engineering diagrams according to UML 2.4 and 1.2 notations.
Picture: UML Collaboration Diagram (UML2.0)
Related Solution:
The role of ConceptDraw MINDMAP is to organize and plan idea development and communicate between process participants. Mind maps are convenient to prepare presentations for team and management and send task lists and related information.
Picture: Product Overview
A waterfall model describes software development process as a sequence of phases that flow downwards. SSADM is one of the implementations of waterfall method. It’s easier to learn about structured systems analysis and design method (SSADM) with ConceptDraw DIAGRAM because this software has appropriate tools for creating data flow diagrams. You can use all the three main techniques of SSADM method with special tools and predesigned templates.
This data flow diagram illustrates the Structured Systems Analysis and Design Method. This method method considers analysis, projecting and documenting of information systems. Data flow models are the most important elements of SSADM and data flow diagrams are usually used for their description. It includes the analysis and description of a system as well as visualization of possible issues.
Picture: Structured Systems Analysis and Design Method. SSADM with ConceptDraw DIAGRAM
Related Solution:
Structured-systems analysis and design method uses data flow diagrams to represent the process of data flowing through a system. Talking about this might be useless without a proper example of DFD for online store (Data Flow Diagram). This DFD example shows all the distinctness that a diagram can bring into a scattered data structure.
Data flow diagrams are used to show how data is processed within some business processes. Making DFD is a common practice for business process modeling and analysis. This diagram represents the online store business flow. It describes inputs and outputs within online selling process and depicts the interactions between its participants. This DF diagram can be used by system analysts to create an overview of a business, to study and discover its inherent strengths and weak points.
Picture: Example of DFD for Online Store (Data Flow Diagram)
Related Solution:
Digital Learning Tools & Technologies. Online training with Skype for effective classrooms. Changing perceptions of leadership and learning.
Picture: eLearning for Leadership
Related Solution:
Working with personnel might be difficult if you are not prepared enough. To explain your workers all the details of communication with customers, you can draw an order process flowchart which will describe every step of the process and answer all the questions that might appear. You can view a lot of business process mapping diagram examples here, in ConceptDraw Solution Park.
This business process flow chart is created to illustrate the sample work order process. Before an organization can make some work for a person, the customer work order request must be completed. It is needed for tracking and accountability objectives. We used this business process flowchart to show a certain tasks and actions assumed by an organization. This flowchart depicts the outside inputs that are needed to launch a process, and ways the organization delivers its outputs. This business process flowchart was created with a help of ConceptDraw Business Process Mapping solution.
Picture: Work Order Process Flowchart. Business Process Mapping Examples
Related Solution:
Functional modeling allows to make complex business processes simple. One of the basic methods is IDEF0 and one of the most effective also. To create a business model, use flowchart symbols.
The IDEF0 library, supplied with ConceptDraw IDEF0 Diagrams solution contains 18 IDEF0 basic notation symbols. All symbols are the vector graphic images what means, that one can customize their size preserving the stable quality. Another library of IDEF0 symbols can be find out in the the Business Process Diagrams solution, included to the Business Processes section of ConceptDraw Solution Park. These libraries composed from just vector objects and are totally compatible. You can apply the IDEF0 symbols from both libraries at your flowcharts, if needed.
Picture: IDEF0 Flowchart Symbols
Related Solution:
Online Tools for eLearning: How to Make Online Trainings. Remote Presentations via Skype. Mind map that allows professors and teachers at all levels of the education collaborate in real time.
Picture: How it works : eLearning
Related Solution:
Sentence a grammatical unit of several words, and provides a narrative, question, comment, etc. It begins with a capital letter and ends with proper punctuation. Sentence diagramming allows you to visually present the sentence part function, which helps you build right sentences. Language Learning solution offers the Sentence Diagrams Library with set of vector stencils for drawing various Sentence Diagrams, for visualizing grammatical structures that will assist you in language learning and construction of grammatically correct sentences. ConceptDraw DIAGRAM diagramming software extended with Language Learning solution from the Science and Education area provides the powerful sentence diagraming tools.
Picture: Sentence Diagrammer
Related Solution:
E-Learning in Schools: Online Language Teaching tools. E-Learning software for remote presentations with Skype. Best practices for eLearning.
Picture: Language School E-Learning
Related Solution:
ConceptDraw
MINDMAP 16