
Sample 1. How to use Each and Every mind map sample
for ConceptDraw eLearning for Skype solution
This mind map was created in ConceptDraw MINDMAP An experienced user can build a map similar to the sample provided in 30 minutes or less.
Mind maps are a fantastic tool for training and teaching, and with the new Skype solution for ConceptDraw MINDMAP, you can now use mind maps as instructional materials for eLearning.
This opens a whole new world of possibilities for instructors. Here is a mind map describing simple rules that could be used to help a student learn a new language!
See also Samples:
NINE RELATED HOW TO's:
ORM diagrams are a straightforward and incredibly effective way to explore domain concepts with your stakeholders.
Picture: ORM Diagram
When you decide to represent data without spending lots of time you can effectively generate, change, and update your presentation to best meet your needs with ConceptDraw MINDMAP.
Picture: 3 Ways to Quickly Create Excellent Presentations
Related Solution:
How to use Skype in the Classroom: Tips for effective teaching online for organizations of all sizes. Software for online training and virtual classroom that provides an interactive learning environment.
Picture: eLerning for Skype
Related Solution:
eLearning Solutions for Teachers: Connecting Students Worldwide. Free Platform for Remote Learning. Skype as a remote education tool. Remote collaboration and presentation.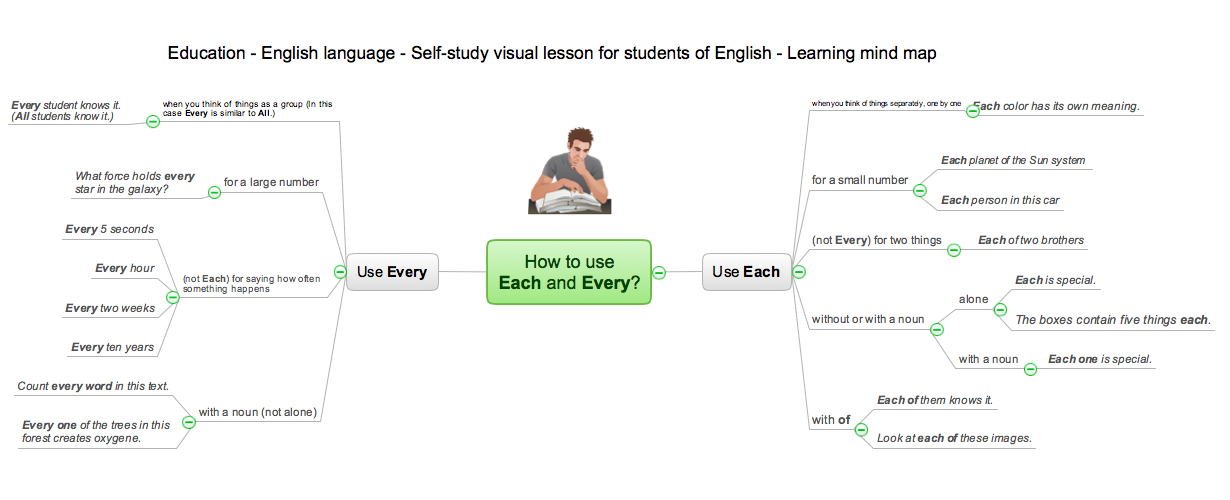
Picture: eLearning - International Teaching Community
Related Solution:
Zooko's triangle is known to be a trilemma which is a concept in international economics which states that it is impossible to have a fixed foreign exchange rate, a free capital movement and an independent monetary policy at the same time.
Picture: Pyramid Diagram
Related Solution:
You need design Cylinder Venn Diagram? Nothing could be easier with ConceptDraw DIAGRAM software.
Picture: Cylinder Venn Diagram
Related Solution:
Database design is an important part of any project, as databases become more and more complex nowadays. To make the model more representative, entity relationship diagrams are widely used in software engineering area. These diagrams show sets of entities as rectangles connected via lines labeled with their cardinalities.
This an example of the ER-diagram developed to store information regarding some online role-playing game. It includes three main elements of ER diagram: entities, relationships and attributes. The entities, attributes and relationships on this ER-diagram is depicted according to the Chen's notation. Chen's notation for Entity Relationship diagrams admits using of rectangles to depict entities, ovals for attributes and ,at least, diamonds to show relationships. ConceptDraw Entity-Relationship Diagrams solution was applied as ERD software to create this diagram.
Picture: ConceptDraw DIAGRAM ER Diagram Tool
Related Solution:
Complexity of databases increases day by day, due to this the Entity relationship models and E-R diagrams become more and more popular, and now are an important part of database design. E-R diagrams created at ConceptDraw DIAGRAM allow visually and graphically represent structure and design of databases.
Picture: E-R Diagrams
Related Solution:
A requisition form is one of the documents used for accounting in different manufacturing processes. There are two main types of requisition: a purchasing requisition and material requisition and difference between them is significant. Creating a flowchart might help you in understanding all the details of accounting process.
Flowcharts are a best visual method for dividing a large and complicated procedure into a several little clear pieces. The main value-ability of an effective flowchart is its simpleness. Material requisition flowcharts are used to document the process of relationships between the different departments and the purchasing department within an organization. The flow chart gives the step-by-step guide on how is carried out the procurement process of the materials necessary for the functioning of the organization. This type of flowchart along with many other business flowcharts, one can easy create using ConceptDraw Flowcharts solution.
Picture: Material Requisition Flowchart. Flowchart Examples
Related Solution: