How to Create a Bar Chart
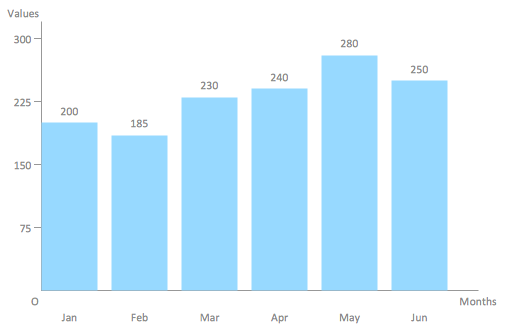
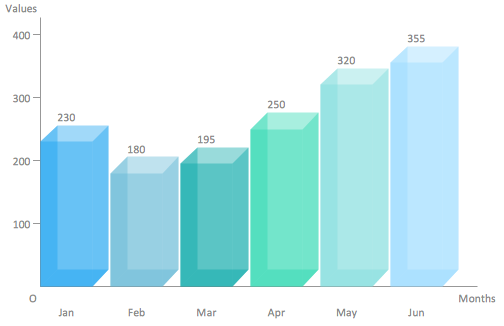
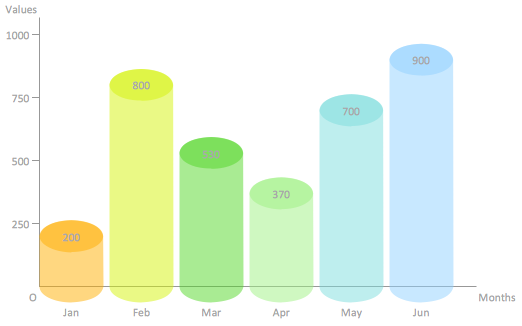
Vertical bar chart, 3D bar chart and Cylindrical bar chart shapes.
- Drag and drop bar chart shape from the library to your document.
- Select the bar chart by mouse click. The Action menu icon appears.
- Click on the icon to open Action menu.
- To change bar number use Action menu commands Add bar, Remove bar, Set bar number.
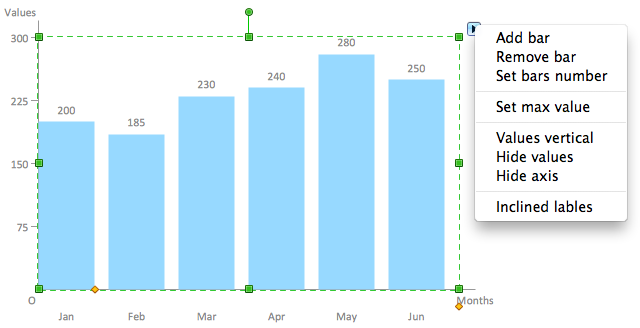
- To set maximum value for vertical axis use Action menu command Set max value.
- To change orientation of bar labels use Action menu command Values vertical/horizontal.
- To hide or show values over the bars use Action menu command Hide/Show values.
- To hide or show axises use Action menu command Hide/Show axis.
- To change value in a bar select chart, then select bar and type new value.
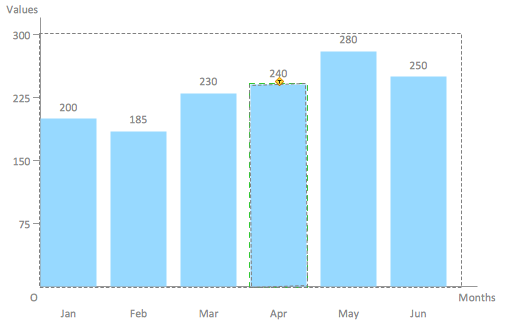
- To add or change chart caption select bar chart and simply start typing.
- To change orientation of category labels under horizontal axis use Action menu command Inclined/Horizontal labels.
- To move category labels up and down select the bar chart and use control dot in the bottom right corner of the shape.
- To change bar width and space between bars select the bar chart and use control dot on the horizontal axis.
Horizontal bar chart shape.
- Drag and drop bar chart shape from the library to your document.
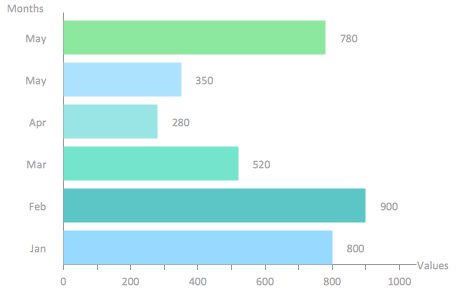
- Select the bar chart by mouse click. The Action menu icon appears.
- Click on the icon to open Action menu.
- To change bar number use Action menu commands Add bar, Remove bar, Set bar number.
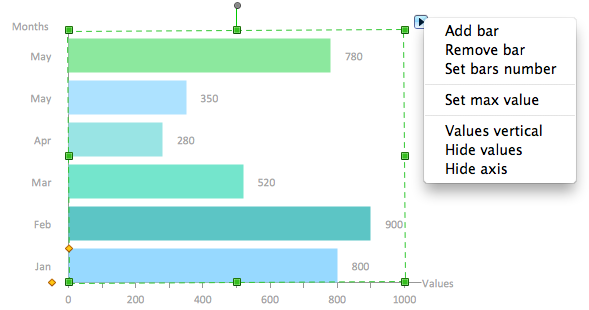
- To set maximum value for horizontal axis use Action menu command Set max value.
- To change orientation of bar labels use Action menu command Values vertical/horizontal.
- To hide or show values to the right of the bars use Action menu command Hide/Show values.
- To hide or show axises use Action menu command Hide/Show axis.
- To change value in a bar select chart, then select bar and type new value.
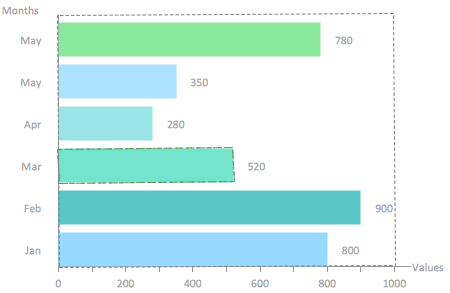
- To add or change chart caption select bar chart and simply start typing.
- To move category labels horizontally select the bar chart and use control dot in the bottom left corner of the shape.
- To change bar width and space between bars select the bar chart and use control dot on the vertical axis.
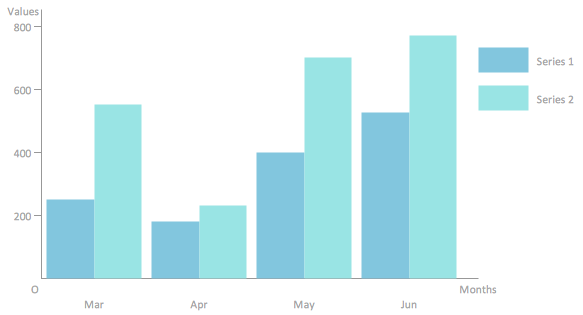
Double bar chart shape.
- Drag and drop bar chart shape from the library to your document.
- Select the bar chart by mouse click. The Action menu icon appears.
- Click on the triangle icon to open Action menu.
- To change bar number use Action menu commands Add bar, Remove bar, Set bar number.
- To set maximum value for vertical axis use Action menu command Set max value.
- To change orientation of bar labels use Action menu command Values vertical/horizontal.
- To hide or show values over the bars use Action menu command Hide/Show values.
- To hide or show axises use Action menu command Hide/Show axis.
- To change value in a bar select chart, then select bar and type new value.

- To add or change chart caption select bar chart and simply start typing.
- To change orientation of category labels under horizontal axis use Action menu command Inclined/Horizontal labels.
- To move category labels up and down select the bar chart and use control dot in the bottom right corner of the shape.
- To change bar width and space between bars select the bar chart and use control dot on the horizontal axis.
- To set category names select the bar chart, then select legend, and then select a category and start typing.

Example 1. Double bar chart example - Changes in price indices.
See Also:
- How to Create a Line Chart
- How to Create a Pie Chart
- How to Create a Pyramid Chart
- How to Create a Scatter Chart
- How to Create a Column Chart
TEN RELATED HOW TO's:
The vector stencils library Chen ERD from the solution Entity-Relationship Diagrams (ERD) contains specific symbols of the Chen ERD notation including entity symbols and relationship symbols for ConceptDraw DIAGRAM software.
Picture: Chen ERD Diagram
Related Solution:
The answer how to create a bar chart can be found in ConceptDraw software. The simple tips guide you through the software to quickly learn how to create a bar chart.
Picture: How to Create a Bar Chart
Related Solution:
When describing any computer network, we imagine a set of devices and nodes, arranged in some way. Talking about network structures, we should distinguish physical and logical network topologies, as physical topology is about devices location and logical topology illustrates data flow. In the same time, they do not have to match, and some devices, such as repeaters, may have a physical star layout, but a bus logical topology.
There are two main types of computer network topologies: Physical topology that show the physical organization of a network - equipment and types of connections. Star network topology involves a set of devices that is connected to a single hub (router). Ring network topology means that, devices connected according this topology have two connections, connecting with nearby devices to make a loop. Bus network topology is the topology presented at the current diagram. It is similar to a ring topology. The difference is that data moves up and down a linear connection, copying itself where network equipment works as bus-stations along the way. This network topology can be used for small network, or when adding an extra device into a network.
Picture: Network Topologies
Related Solution:
No need for any special drawing skills to create professional looking diagrams outside of your knowledge base. ConceptDraw DIAGRAM takes care of the technical details, allowing you to focus on your job, not the drawing..png)
Picture: Create Professional Looking Diagrams
This sample shows the Flowchart that displays the layout and work flow of the cloud marketing platform. This diagram has a style of the marketing brochure. This style displays the central product that is related to the other issues.
Using the ready-to-use predesigned objects, samples and templates from the Flowcharts Solution for ConceptDraw DIAGRAM you can create your own professional looking Flowchart Diagrams quick and easy.
Picture: Flowchart Marketing Process. Flowchart Examples
Related Solution:
A computer network diagram for a large network can be complicated and difficult both to understand and to draw. To learn how to deal with complex network diagrams, start with a basic network diagram, showing only the primary network devices and the connections between them. There are software tools to help you with that, such as ConceptDraw DIAGRAM , that include templates and examples for simple and common network diagrams.
The ConceptDraw solution for making computer network diagrams delivers over a thousand of vector objects, composed into the forty vector libraries that were developed to support drawing of professional-looking computer network diagrams. This diagram of computer network can be used by system administrator as a basic template for making the custom network diagram. Since the responsibilities of network or system administrator include documenting of computer network, drawing network diagrams is an important part of their work.
Picture: Basic Network Diagram
Explaining soccer positions becomes much more easier and time saving with visual drawings. ConceptDraw DIAGRAM software extended with the Soccer solution from the Sport area of ConceptDraw Solution Park is very useful tool that will help you design the soccer-related drawings of any complexity in minutes.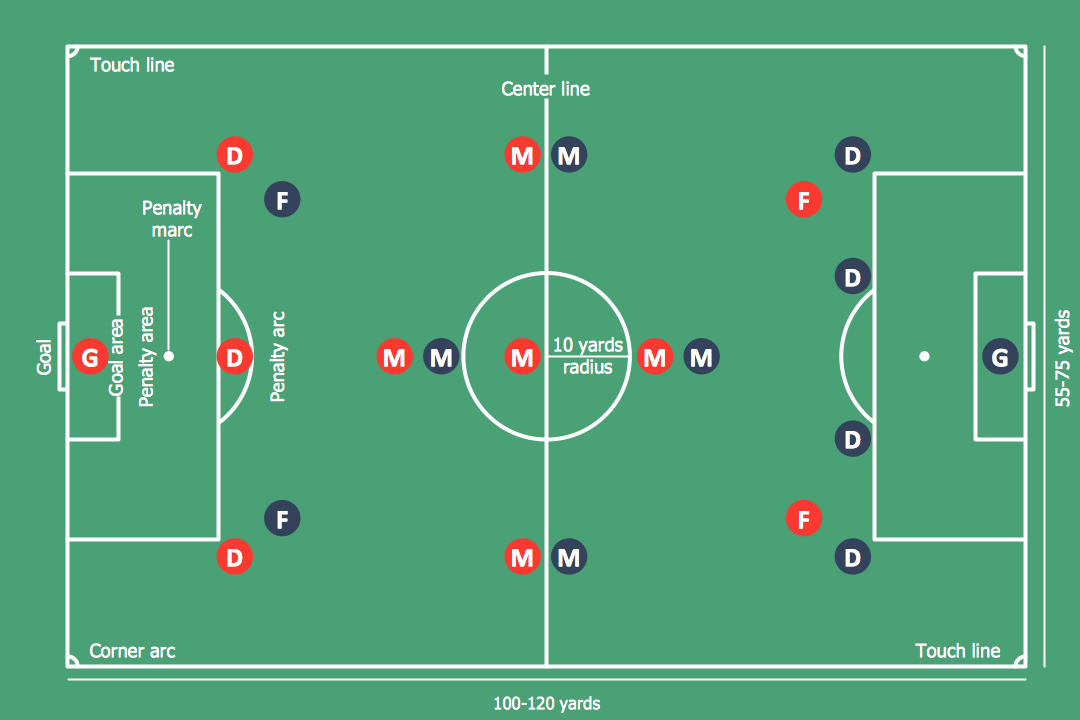
Picture: Soccer (Football) Positions
Related Solution:
Describing a workflow or approval process can take hours and be too complicated, especially since there are options to do it quickly and vividly. Diagrams called flowcharts replace long paragraphs of boring text and represent information in a graphic way. You can draw one on paper or you can use flowchart software to do it quickly and scalable. This kind of software is easy to use and you don’t need any special skills to start using it. In addition, there are a lot examples and predesigned templates on the Internet.
Flowcharts are a best tool for staking out a huge and complex process into some small readable parts. Surely, flowcharts can be drawn manually but the use of standard symbols that make it clear for a wide audience makes a software tool preferred for this task. The core for a successful flowchart is its simplicity. That is why often before beginning making flowchart through software, people draw the sketch on a piece of paper. Designing an effective flowchart means the combination of the data needed to be shown and the simplicity with which you depict it.
Picture: Flowchart Software: A Comprehensive Guide
Related Solution:
ConceptDraw MINDMAP - an excellent tool for exporting mind maps to PowerPoint to visualize and presenting your project. You can simply generate, change, update your mindmap and then make a presentation in PowerPoint.
Picture: How To Do A Mind Map In PowerPoint
Related Solution:
ConceptDraw DIAGRAM offers a wide choice of powerful and easy-to-use tools for quickly creating all kinds of charts and diagrams. Even if you've never used a drawing tool before, it's very easy to create high-quality professional graphic documents with ConceptDraw DIAGRAM.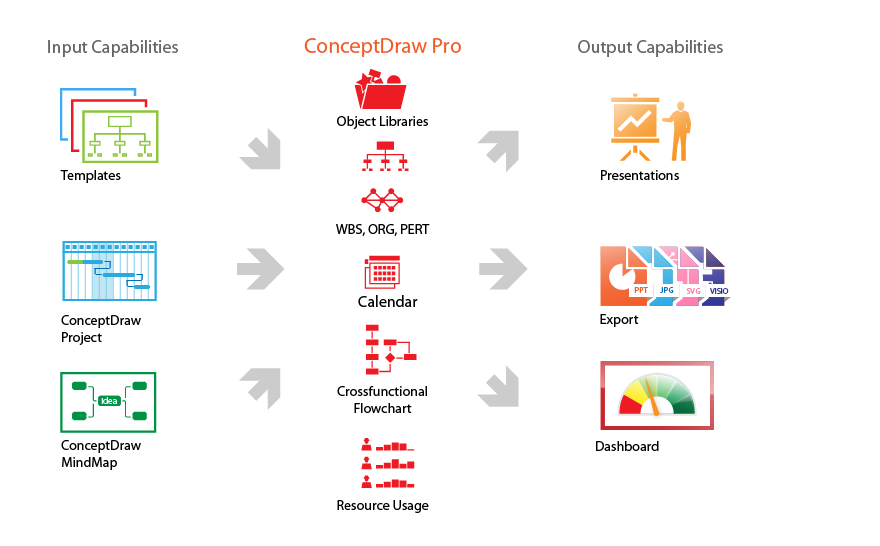
Picture: Product Overview
ConceptDraw
DIAGRAM 18