Today almost everyone has been subjected to the sales process, however professional selling involves a series of distinct steps. One shortcut to success in any industry is to follow footsteps of those who earned success before you.
In this lesson, you'll learn about important steps in sales process and will be provided with examples.
ConceptDraw DIAGRAM diagramming and vector drawing software supplied with unique Sales Flowcharts solution from the Marketing area of ConceptDraw Solution Park allows fast and easy visualize all sales steps of the sales process on a sales process Map or sales process flowchart, and then realize them easily.
Example 1. Sales Steps
Outlining the sales process - what can be easy? Thanks to the 6 libraries of the Sales Flowcharts Solution it is a very simple process:
Sales Arrows
Sales Department
Sales Flowchart
Sales Steps
Sales Symbols
Sales Workflows
These libraries contain all vector shapes and symbols needed for representing the sales steps and displaying the sales results.
Steps to Creating a Sales Process Flow Chart
Helps to create professionally looking and detailed sales flowcharts with all sales steps visually represented on them.
Create new document
Add needed objects to the page
Place objects in needed position
Open Sales arrows library, drag and drop Circular motion arrows object
Add needed quantity of segments using object menu
Select a segment from the group, select a group-figure for that (Circular motion arrows), one more click and inside figure will be selected
In this case, it will be one of the arrows
Open Object Filling Inspector from Ribbon
Change arrows color
Note: You may use standard pallet or use a custom one
Open line inspector, switch off the Stroke
Add International division and Nurturing objects
Align these objects
Group all objects for convenient usage
Add more objects
Arrange and change sizes
Turn on size boxes
Note: Size will be shown for selected object in units of document
Add a Textbox, just double click on the page space
Note: Font and color will be same as the last added object from the library
Open Inspectors - Text
Set the needed font, size and color. All the next textboxes will have these atributes
Fill the needed text
Use Ellipse tool located on ribbon
Draw a circle on top of all objects
Note: to draw a proper circle, hold a Shift button
Change color of circle
Add names to top objects
Add more objects
Flip horizontally one of the figures
Open Instectors - Layer
Set another level as "work"
Add a rectange equal the page size using Restangle tool on the ribbon
Bring to the back this rectangle using the tool on ribbon
Change its color
Set the first level as "work"
Lock the second level from edition
Change filling for some objects
Open Inspectors - Text - Change text color
Add some pointing arrows from Sales arrows library
Select one by one and change their color
Note: to select several objects, hold the Shift button
Add few more flowchat steps
Add new objects and arrows
Open Page Inspector
Change the name of page by double click on it
Save the document
Export it to PDF
Open file in PDF reader program!
All source documents are vector graphic documents. They are available for reviewing, modifying, or converting to a variety of formats (PDF file, MS PowerPoint, MS Visio, and many other graphic formats) from the ConceptDraw STORE. The Sales Flowcharts Solution is available for all ConceptDraw DIAGRAM
Use the Sales Flowcharts Solution for ConceptDraw DIAGRAM software to create your own Sales Flowcharts of any complexity quickly, easily and effectively to use them successfully in your work activity.
Video. Steps to Creating a Sales Process Flow Chart (2min 05sec)
Chemistry solution provides the Chemical Drawings Library with large quantity of vector chemistry equation symbols to help you create professional looking chemistry diagrams quick and easy.
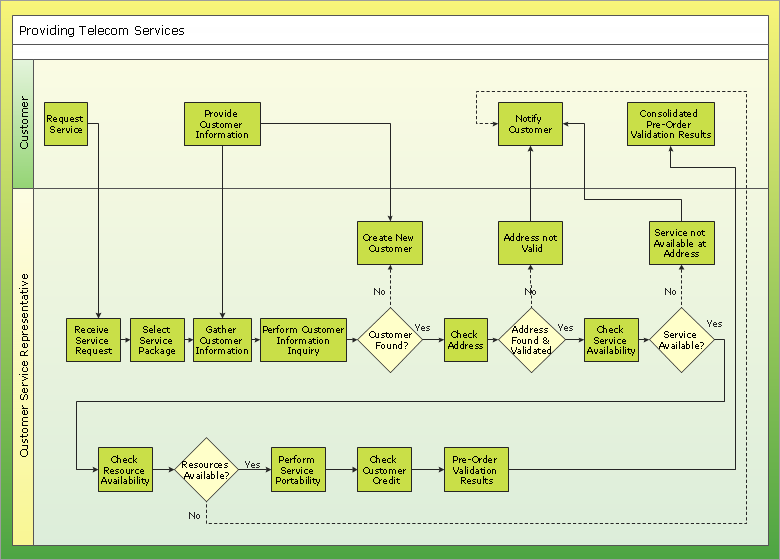
Sometimes it's difficult to find a path in work processes or to understand the requirements, especially when you are a newcomer. To get your thoughts straight, create a workflow diagram, and put everything on it. This will not only help you to get into the workflow, but also show it’s weaknesses.
This illustration captures the workflow process of payment an invoice for the electricity consumed by certain enterprise. It was drawn in ConceptDraw DIAGRAM using its solution for Workflow Diagrams. Making a workflow charts means that you need to depict consistently all processes engaged to the workflow process. Then, you should connect them with symbols meaning study and analysis. Next, add symbols of decisions. A work flow diagram made precisely and correctly can help to clarify your work flow to any person.
ConceptDraw DIAGRAM diagramming and vector drawing software extended with tools of Flowcharts Solution from the Diagrams Area of ConceptDraw Solution Park ideally suits for fast and easy Online Flow Chart designing. We propose to verify this right now.
Accounting is a cornerstone of any business, it’s basement. If you want to have a visual representation of your finance management, use audit flowchart symbols to document the money flow. Although some would say that accounting is boring, it is very a responsible duty.
The audit flowchart symbols is supplied with ConceptDraw Audit Flowcharts solution as a vector objects library. Together with Conceptdraw Drawing capabilities it forms the helpful tool for audit process planning and setting the steps of audit by designing audit flow charts. Audit Flow charts are used to organize fiscal information tracking process as well as in accounting, finance and investment management.
The Value stream is a totality of all actions on the projection, order composition and production: starting from creation a product project to launching this product, from order to delivery, from extraction of raw materials to ready product manufacturing. Value stream mapping is a process of visualization of these actions and creation of a detailed and graphical map.
No security system cannot be constructed without detailed security plan, or even a set of plans in some cases. ConceptDraw DIAGRAM software offers the Security and Access Plans Solution from the Building Plans Area to help you design the Security Plans for any premises and of any complexity.
ConceptDraw DIAGRAM extended with Workflow Diagrams solution from the Business Processes area is a powerful workflow software which can help design the workflow diagrams of any complexity, from simple work flow one to sufficiently complex workflow charts.
Helps to create professionally looking and detailed Sales Flowcharts with all sales steps visually represented on them.
Use the Sales Flowcharts Solution for ConceptDraw DIAGRAM software to create your own Sales Flowcharts of any complexity quickly, easily and effectively to use them successfully in your work activity.
ConceptDraw DIAGRAM diagramming and vector drawing software supplied with unique Sales Flowcharts solution from the Marketing area of ConceptDraw Solution Park allows fast and easy visualize all sales steps of the sales process on a sales process Map or sales process flowchart, and then realize them easily.
ConceptDraw DIAGRAM is a powerful tool that helps you create a Cross Functional Flow Chart quickly and easily. Fine-tuning the objects in ConceptDraw DIAGRAM allows you to create a really professional finished article. ConceptDraw Arrows10 Technology gives drawing connectors a smart behavior that provides quick and precise placement, allows for easy changes and automatic rearrangement.
The Project Management Triangle Diagram depicts three main constraints of any project: scope, time and cost. Projects have to comply with the specified scope, projects should be finished in time and projects need to consume the budget. Each of the constraints represents one side of the triangle, and any change in budget or timing or scope affects the entire diagram.