Made with
ConceptDraw
MINDMAP 16

Sales Plan

ConceptDraw Office

ConceptDraw Office is an integrated set of visualization products and document exchange technologies. ConceptDraw OFFICE consists of a diagramming platform, a mind mapping, and a project management tool. These tools are essential to generate business diagrams, mind maps, project plans, dashboards, presentations, schematics, and any other business visualizations. These tools have access to an online service, ConceptDraw Solution Park that will deliver additional product extensions in the future. This is a time saving assistant for generating your business documents and presentations.

ConceptDraw Office consists of a diagramming platform, a mind mapping, and a project management tool. These tools are essential to generate business diagrams, mind maps, project plans, dashboards, presentations, schematics, and any other business visualizations.

ConceptDraw MINDMAP Samples

Sample mind maps created in ConceptDraw MINDMAP that demonstrate the different capabilities and applications of the program for business, personal, or education use.

Mind map that organizes targets and goals of a sales plan.

Sales Plan *

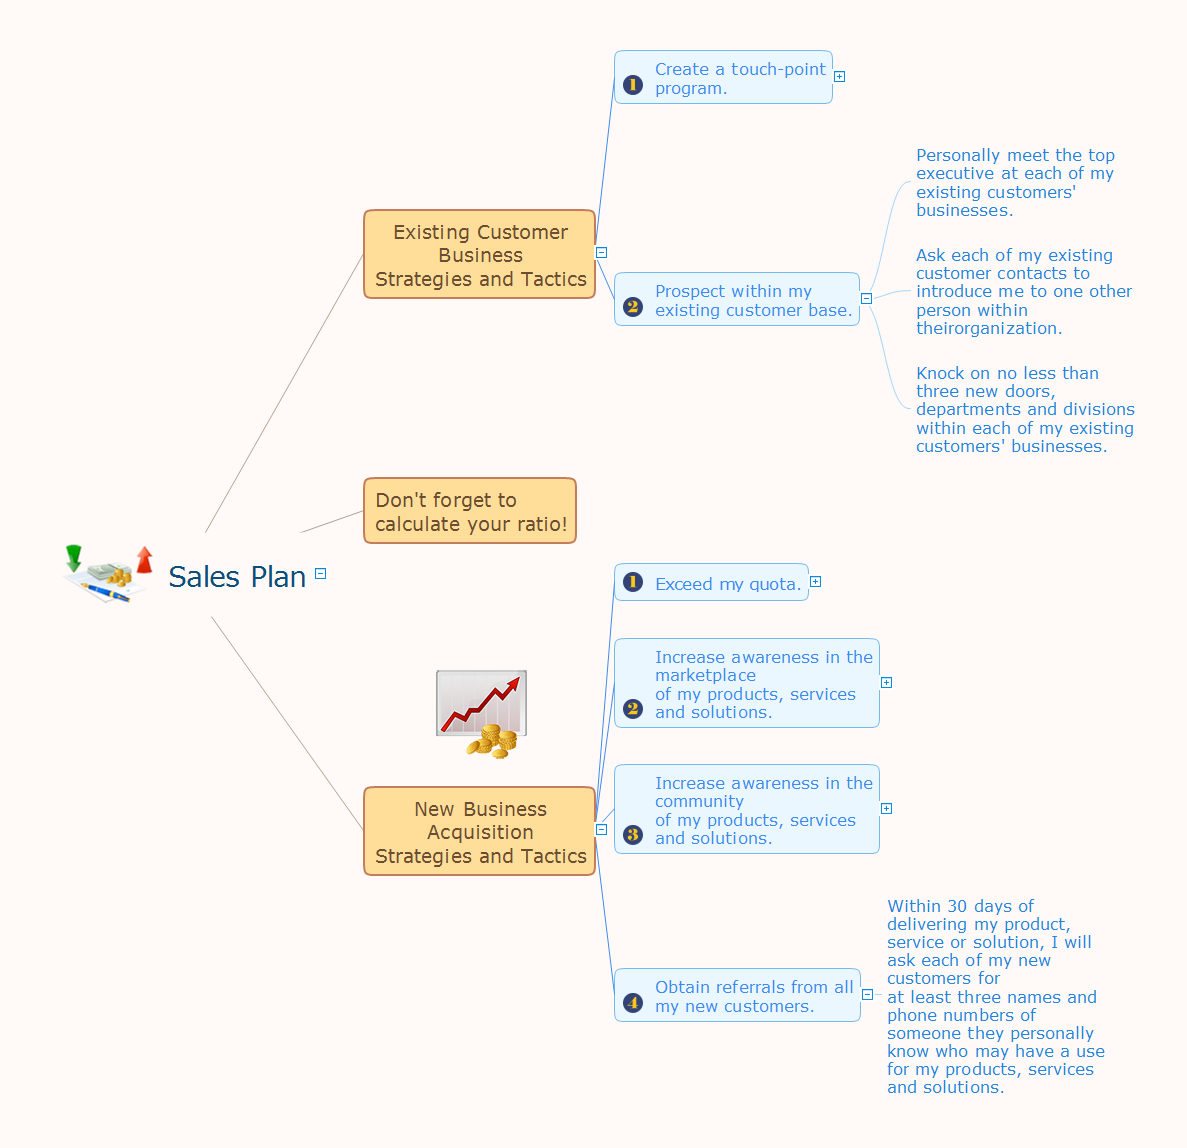
Example 1. Sales Plan


Export to Outline


Sales Plan
    • Existing Customer Business Strategies and Tactics
      • Create a touch-point program.
        • Take at least three existing customers to lunch each month and invite a new prospect to join us.
        • Create some sort of Web-based seminar series for my existing customers.
        • Create a user-group within my existing customer base.
        • Create a noteworthy monthly newsletter.
        • Contact each of my existing customers no less than once per month with a new idea they cannot get from anyone else.
      • Prospect within my existing customer base.
        • Personally meet the top executive at each of my existing customers' businesses.
        • Ask each of my existing customer contacts to introduce me to one other person within theirorganization.
        • Knock on no less than three new doors, departments and divisions within each of my existing customers' businesses.
    • Don't forget to calculate your ratio!
    • New Business Acquisition Strategies and Tactics
      • Exceed my quota.
        • Make no less than five presentations each week.
        • Create no less than 10 proposals each week.
        • Make no less than 20 face-to-face contacts with new prospects each week.
        • Make no less than 50 cold calls of introduction to new prospects each week.
        • Send no less than 50 letters of introduction to new prospects each week.
      • Increase awareness in the marketplace of my products, services and solutions.
        • On a regular basis, contribute articles and white papers that address the interests and concerns of this population.
        • Purchase the mailing list of these associations and organisations and send either a postcard or a letter of introduction.
        • Attend any and all trade shows and conventions that my best prospects and customers attend.
        • Join and participate in no less than three professional associations and organisations that my best prospects and customers belong to.
      • Increase awareness in the community of my products, services and solutions.
        • Join and participate in no less than three networking groups, such as Le Tip or Business Networking International.
        • Volunteer my time at three non-profit organisations.
        • Volunteer to speak at no less than 12 various organisations in my territory that have an interest in my product, service and solutions.
        • Attend all Chamber of Commerce networking events.
      • Obtain referrals from all my new customers.
        • Within 30 days of delivering my product, service or solution, I will ask each of my new customers for at least three names and phone numbers of someone they personally know who may have a use for my products, services and solutions.

The Benefits for ConceptDraw MINDMAP Brainstorming Software

  • ConceptDraw MINDMAP is effective for brainstorming, designing mind maps, idea generating, creative and lateral thinking, creativity and problem solving.
  • ConceptDraw MINDMAP is ideal for team and personal work in Business, Marketing and Project Management.
  • The libraries with large quantity of vector objects help to illustrate your mind maps and to make them bright, visual and comprehensible.
  • Use of View Navigator tool lets create presentations from a mind map: you can simply select the map parts you want to present, sequence your slides, and preview the presentation.
  • ConceptDraw MINDMAP provides wide capabilities of importing and exporting in various formats: Microsoft PowerPoint, Microsoft Word, MS Excel, Mindjet MindManager, image, HTML, PDF file.


TEN RELATED HOW TO's:
ConceptDraw Office is the most effective tool for planning, tracking, and reporting all types of projects with strong management capabilities, user friendly functionality, and superior ease of use. In this tutorial video we will assist you in planning and managing a project using ConceptDraw Office.How To Plan and Implement Projects Faster *
Picture: How To Plan and Implement Projects Faster
Understanding the connections between an organization department might take some time. If you are a newcomer to a company, an orgchart would help you if don’t know who to call when questions appear. This scheme usually is printed on one of the walls in the office. This template of orgchart is supplied with the ConceptDraw add-on containing solutions for making organizational charts. You can use it to depict an organizational structure of your company. The only you need is - open this template and alter it to cover an organizational features of your business. It is easy to rearrange the orgchart structure by dragging the elements by mouse. Finally fill the template with particular positions of your company's staffing table.Orgchart *
Picture: Orgchart
Related Solution:
Structured-systems analysis and design method uses data flow diagrams to represent the process of data flowing through a system. Talking about this might be useless without a proper example of DFD for online store (Data Flow Diagram). This DFD example shows all the distinctness that a diagram can bring into a scattered data structure. Data flow diagrams are used to show how data is processed within some business processes. Making DFD is a common practice for business process modeling and analysis. This diagram represents the online store business flow. It describes inputs and outputs within online selling process and depicts the interactions between its participants. This DF diagram can be used by system analysts to create an overview of a business, to study and discover its inherent strengths and weak points.Example of DFD for Online Store
Picture: Example of DFD for Online Store (Data Flow Diagram)
Related Solution:
Create value stream maps - for value stream analysis and value stream management, material and information flow mapping, using our quick start templates included with ConceptDraw.Best Value Stream Mapping mac Software *
Picture: Best Value Stream Mapping mac Software
Related Solution:
Japan is an island nation in East Asia. Located in the Pacific Ocean, it lies to the east of the Sea of Japan, China, North Korea, South Korea and Russia, stretching from the Sea of Okhotsk in the north to the East China Sea and Taiwan in the south. The vector stencils library Japan contains contours for ConceptDraw DIAGRAM diagramming and vector drawing software. This library is contained in the Continent Maps solution from Maps area of ConceptDraw Solution Park.Geo Map - Asia - Japan *
Picture: Geo Map - Asia - Japan
Related Solution:
Use ConceptDraw DIAGRAM diagramming and business graphics software for drawing your own PM life cycle flow charts.Program to Make Flow Chart *
Picture: Program to Make Flow Chart
Related Solution:
Asynchronous Transfer Mode (ATM) is a high-speed networking standard intended for supporting the voice and data communications. ConceptDraw DIAGRAM is a powerful network diagramming and vector drawing software that provides the Computer and Networks solution with wide set of ready-to-use predesigned vector stencils and examples to help you design the ATM Networks quick and easy.ATM Network. Computer and Network Examples *
Picture: ATM Network. Computer and Network Examples
Related Solution:
Create bar charts for event management problem solving and visual data comparison using the ConceptDraw DIAGRAM diagramming and vector drawing software extended with the Bar Graphs Solution from the Graphs and Charts area of ConceptDraw Solition Park.Bar Diagrams for Problem Solving.<br>Create event management bar charts with Bar Graphs Solution *
Picture: Bar Diagrams for Problem Solving.Create event management bar charts with Bar Graphs Solution
Related Solution:
UML Activity Diagram illustrates the business and operational step-by-step workflows of components in a system and shows the overall flow of control. You can use the appropriate stencils of UML notation from UML Activity library with 37 objects. ConceptDraw is ideal for software designers and software developers who need to draw UML Activity Diagrams. Use ConceptDraw DIAGRAM diagramming and vector drawing software enhanced with Rapid UML solution from ConceptDraw Solution Park to create your own UML activity diagrams that show the business and operational workflows of components and overall flow of control in your systems. Such software provides coloring UML diagrams for various purposes and simplifying work of the engineers.UML Activity Diagram *
Picture: UML Activity Diagram
Related Solution:
In the course of recent decades data visualization went through significant development and has become an indispensable tool of journalism, business intelligence and science. The way visual information may be conveyed is not limited simply to static or dynamic representation, it can also be interactive. Infographics can be conditionally divided into several general levels. Primarily, this is level of visualization of information, its interpretation and association on any ground. Second level can be defined as a visualization of knowledge, depiction of thoughts and ideas in the form of images or diagrams. Finally, the level of data visualization, which processes data arrays in charts, enabling the information to be more clearly perceived. You can also identify the main approaches to the creation of infographics: exploratory and narrative. Exploratory method insists on minimalist design in favor of data precision without unnecessary details and is common for scientific researches and anaDesign Pictorial Infographics. <br> Design Infographics *
Picture: Design Pictorial Infographics. Design Infographics
Related Solution:
ConceptDraw
MINDMAP 16