Database Flowchart Symbols
Database Flowchart
Database flowchart (DFD) is used to visualize data flows in information systems. DFD consists of four major components:
- entities,
- processes,
- data stores,
- data flows.
How to Create a Database Flowchart
Using the “Data Flow Diagrams” solution in ConceptDraw STORE.

Pic 1. Database Flowchart Solution
ConceptDraw DIAGRAM allows you to draw a simple and clear Database Flowchart using special libraries, provided by Data Flow Diagrams solution:
- The design elements library "Data flow diagram (DFD)" contains 15 symbols for drawing both context-level data flow diagram and Level 1 DFD.
- The design elements library "DFD, Gane-Sarson notation" contains 12 symbols of Gane-Sarson DFD notation.
- The design elements library "DFD, Yourdon and Coad notation" contains 22 symbols of Yourdon/DeMarco DFD notation.

Pic 3. Database Flowchart Symbols
Use these database flowchart symbol libraries to design the process-oriented models, data-oriented models, data flowcharts, data process diagrams, structured analysis diagrams, and information flow diagrams.
|
Pic 4. Database Flowchart Library
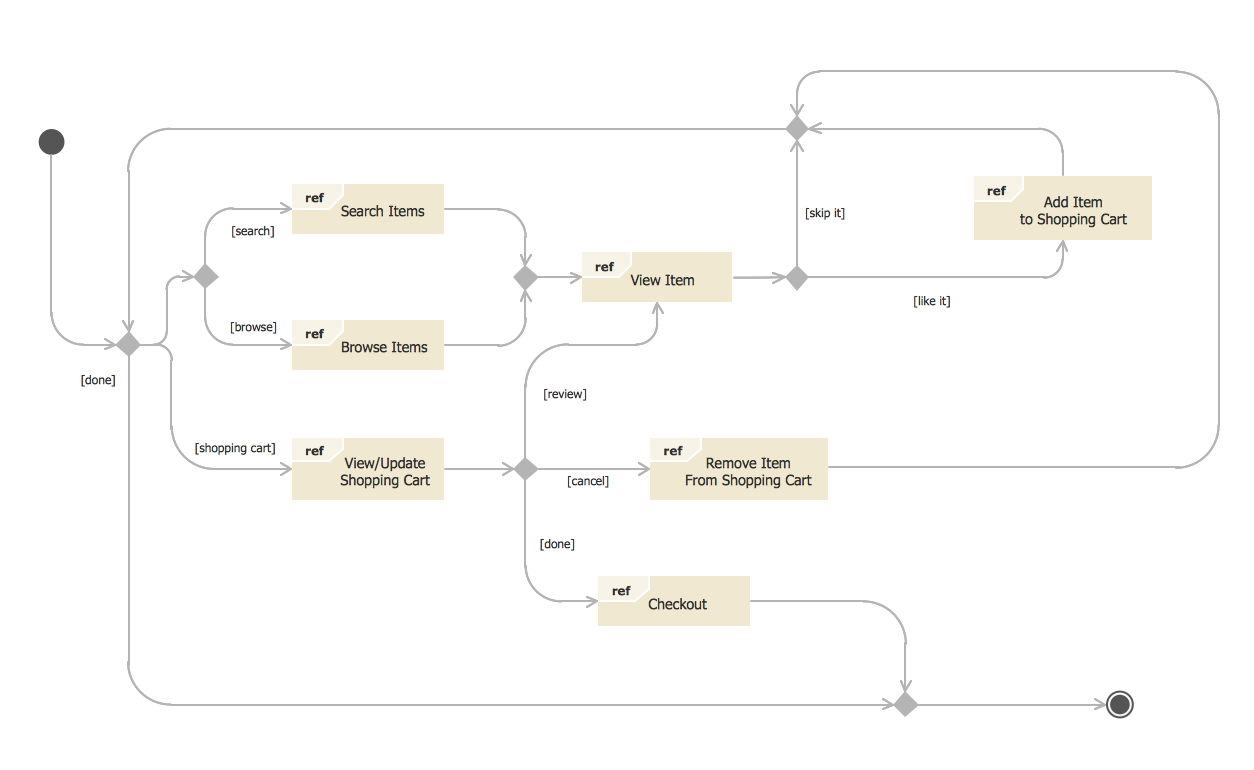
Result
This sample shows a CERES data flow diagram. The design is large and complex, but its creation in ConceptDraw DIAGRAM using pre-designed objects, took just minutes. Use the legend to make additional comments.

Pic 5. Database Flowchart
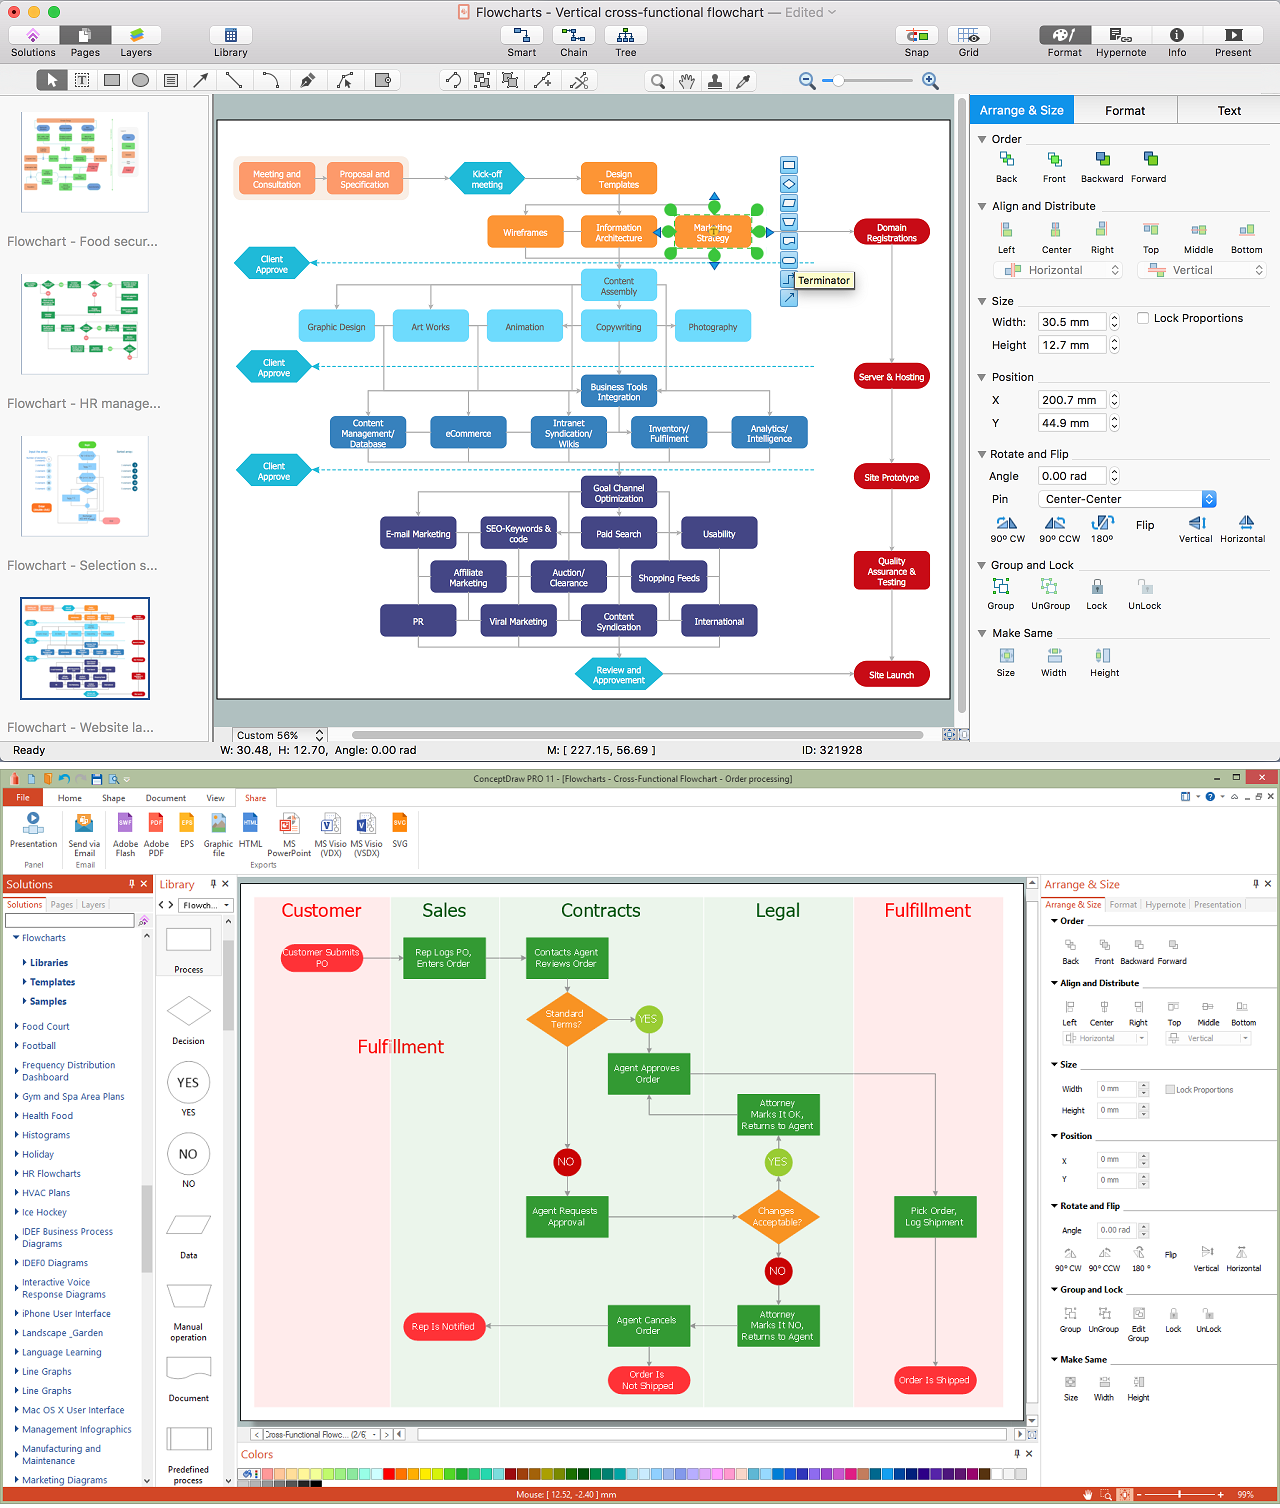
TEN RELATED HOW TO's:
A flowchart is a widely used type of diagram that visually represents an algorithm, workflow or process, using the boxes of various kinds to depict the steps and connecting them with arrows to show the order of execution these steps. Еhe ConceptDraw DIAGRAM supplied with Accounting Flowcharts Solution from the Finance and Accounting Area of ConceptDraw Solution Park is a powerful diagramming and vector drawing software which ideally suits for designing Ordering Process Flowchart of any complexity.
Picture: Ordering Process Flowchart. Flowchart Examples
Related Solution:
Using a Cross-Functional flowchart is a clear way of showing each team member’s responsibilities and how processes get shared or transferred between different teams and departments.
The ability to create Cross-functional diagrams is provided by the ConceptDraw Cross-Functional Flowcharts solution.
Picture: Create a Cross-Functional Flowchart
ConceptDraw DIAGRAM is a flowchart creating software. This software includes over 20 vector stencils in libraries. These objects allow you to create well-designed flowcharts.
Put an initial object from library to a page and use RapidDraw technology clicking on direction arrows to add new objects to the flowchart. This way you can make flowchart quickly.
Picture: How To Create a Flow Chart in ConceptDraw
Related Solution:
Design efficiently the technical flow charts in ConceptDraw DIAGRAM software for various fields and provide ✔️ clarity, ✔️ accuracy, ✔️ usability, ✔️ simple communication, analysis, and improvement
Picture: Technical Flow Chart Example
Related Solution:
Everyone wants to be efficient. To succeed, try Mind Maps for Business - SWOT Analysis and enjoy the result. But be careful: it can be addictive!
ConceptDraw products and supported by SWOT and TOWS Matrix Diagrams solution forms a great tool for providing SWOT analysis. The solution contains mind map templates. By filling mind map templates, one can easily determine Strengths, Weaknesses, Opportunities, and Threats of the current business. Just a one click is needed to turn the SWOT mind map into a SWOT matrix. The SWOT diagram will be created in ConceptDraw DIAGRAM on the base of SWOT mind map.
Picture: Mind Maps for Business - SWOT Analysis
Event-Driven Process Chain flowcharts for improvement throughout an organisation.
ConceptDraw DIAGRAM is a software for making EPC flowcharts to provide business process modelling. Its excellent business process improvement tools.
Picture: An Event-driven Process Chain (EPC) - flowchart used for business process modelling
Related Solution:
A competent delegation of responsibilities between workers guarantees business success in most cases. At first sight, it might seem that workflow diagram symbols are quite similar to a regular flowchart. But workflow diagram is a more accurate way to present working processes.
Workflow diagrams are helpful for a working process analyzation, to depict a pathway of process issues, personalize responsibilities and identify resources that will help to optimize a workflow. Generally, Workflow diagram deploys flowchart symbols for displaying work process steps and relationships. But, often it require some additions and improvements to become more professional and illustrative. The Workflow solution for ConceptDraw DIAGRAM provides the user with a big library of symbols that are designed especially for workflow diagrams.
Picture: Workflow Diagram Symbols
Related Solution:
UML Sequence Diagram shows object interactions arranged in time sequence, how processes operate with one another and in what order and illustrate the sequence of messages exchanged between the objects and classes involved in the scenario.
Picture: UML Sequence Diagram. Design Elements
ConceptDraw DIAGRAM extended with Mathematics solution from the Science and Education area is a powerful diagramming and vector drawing software that offers all needed tools for mathematical diagrams designing.
Mathematics solution provides 3 libraries with predesigned vector mathematics symbols and figures:
Solid Geometry Library, Plane Geometry Library and Trigonometric Functions Library.
Picture: Mathematics Symbols
Related Solution:
Users can start draw their own flowchart diagrams from existing examples.
Picture: Examples of Flowchart Diagram
Related Solution: