
Pic 1. Relative Value Chart Software
ConceptDraw DIAGRAM software is the best for drawing professional looking Relative Value Charts. ConceptDraw DIAGRAM provides Divided Bar Diagrams solution from the Graphs and Charts Area of ConceptDraw Solution Park.
Relative Value Chart library objects:
Divided Bar Diagrams solution contains the library with 10 predesigned vector objects.
Divided Bar Diagram is a rectangle that is divided into smaller rectangles in proportion to the data. They are used for visual representation of the collected information.

Pic 2. Relative Value Chart library objects
You can simply drop these objects into your document, change values to quickly create your own Relative Value Charts.
Relative Value Chart Example:
Divided Bar Diagrams solution also provides many examples and templates that you can change for your needs.

Pic 3. Relative Value Chart Example. London Election Results
This example was created in ConceptDraw DIAGRAM using the Divided Bar Diagrams library from the Divided Bar Diagrams Solution. It shows divided bar diagrams that are used for comparing statistics. There are also added the axes that help easier read these comparison diagram.
The Relative value charts produced with ConceptDraw DIAGRAM are vector graphic documents and are available for reviewing, modifying, converting to a variety of formats (image, HTML, PDF file, MS PowerPoint Presentation, Adobe Flash or MS Visio), printing and send via e-mail in one moment.
More Related Diagrams:
TEN RELATED HOW TO's:
Computer-aided design (CAD) is the use of the computer software to create drawings. Today the large quantity of the technical drawings and architectural designs is created using the CAD software. CAD software makes the design process convenient, efficient and productive.
ConceptDraw DIAGRAM diagramming and vector drawing software allows you the possibility to draw your architectural designs quick, simple and effective.
Use the libraries with a set of vector objects, templates and samples from the Floor Plans Solution from the Building Plans area of ConceptDraw Solution Park for designing your professional architectural designs.
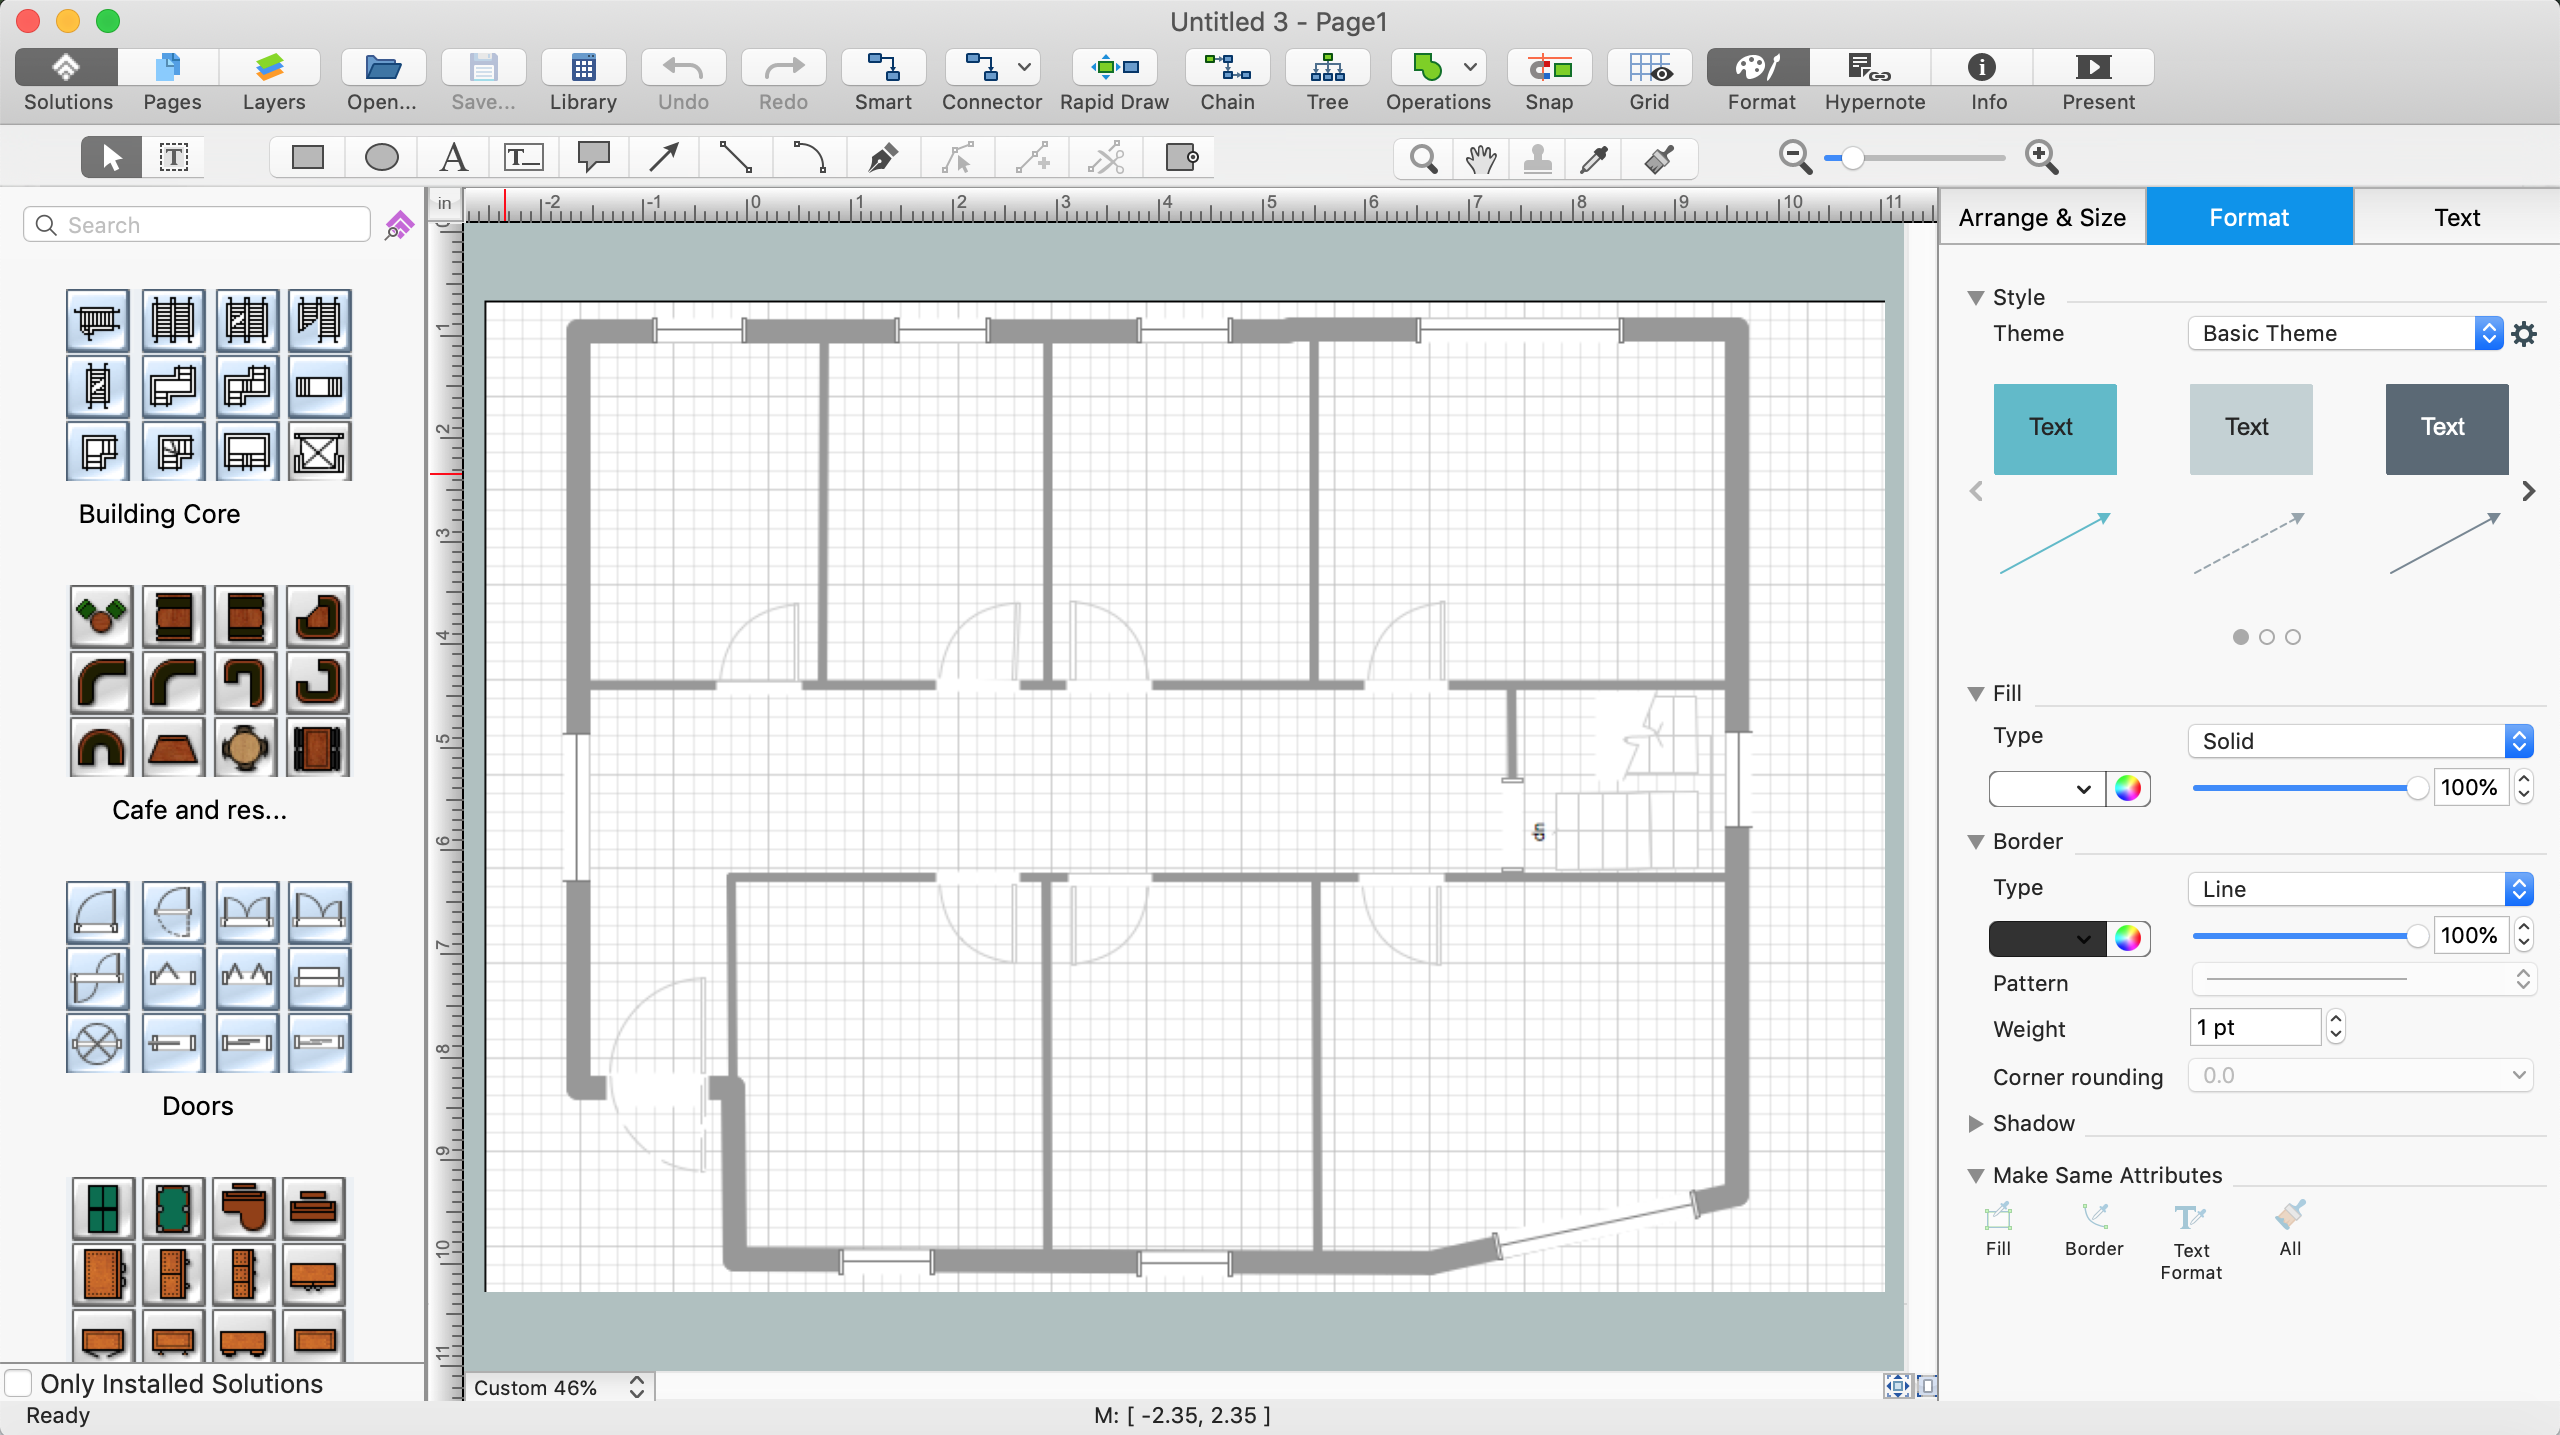
Picture: CAD Software for Architectural Designs
Related Solution:
Create bar charts for event management problem solving and visual data comparison using the ConceptDraw DIAGRAM diagramming and vector drawing software extended with the Bar Graphs Solution from the Graphs and Charts area of ConceptDraw Solition Park.
Picture: Bar Diagrams for Problem Solving.Create event management bar charts with Bar Graphs Solution
Related Solution:
This sample shows the Scatter Plot without missing categories. It’s very important to no miss the data, because this can have the grave negative consequences. The data on the Scatter Chart are represented as points with two values of variables in the Cartesian coordinates. This sample can be used in the engineering, business, statistics, analytics, at the creating the financial and other types of reports.
Picture: Blank Scatter Plot
Related Solution:
ConceptDraw DIAGRAM diagramming and vector drawing software extended with Biology solution from the Science and Education area offers a set of useful tools for fast and easy drawing of various biology illustrations and drawings.
Biology solution provides 3 libraries with large quantity of vector biology symbols: Biochemistry of Metabolism Library, Carbohydrate Metabolism Library, Citric Acid Cycle (TCA Cycle) Library.
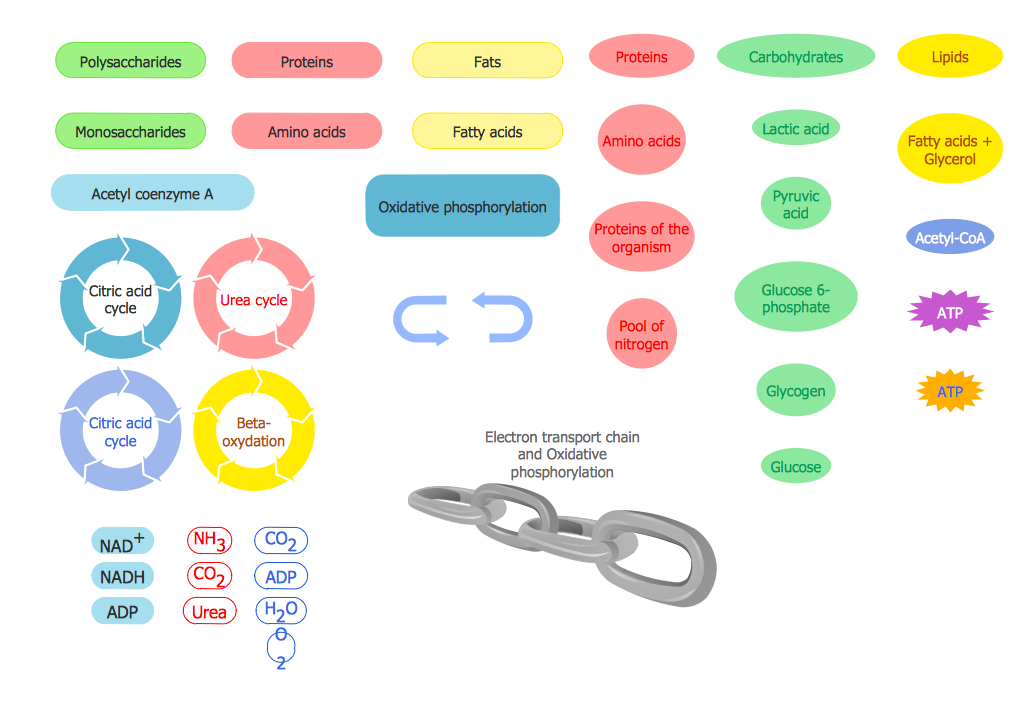
Picture: Biology Symbols
Related Solution:
When you need to draw a professional management drawing, these management design elements, samples, templates and libraries with vector clip art for drawing the Marketing Illustrations. Conceptdraw symbols and signs you can use in your design for Strategic Management, Graphic Design, Planning implementation and more.
You can create and view impact analysis drawings from specific design elements to examine the tasks.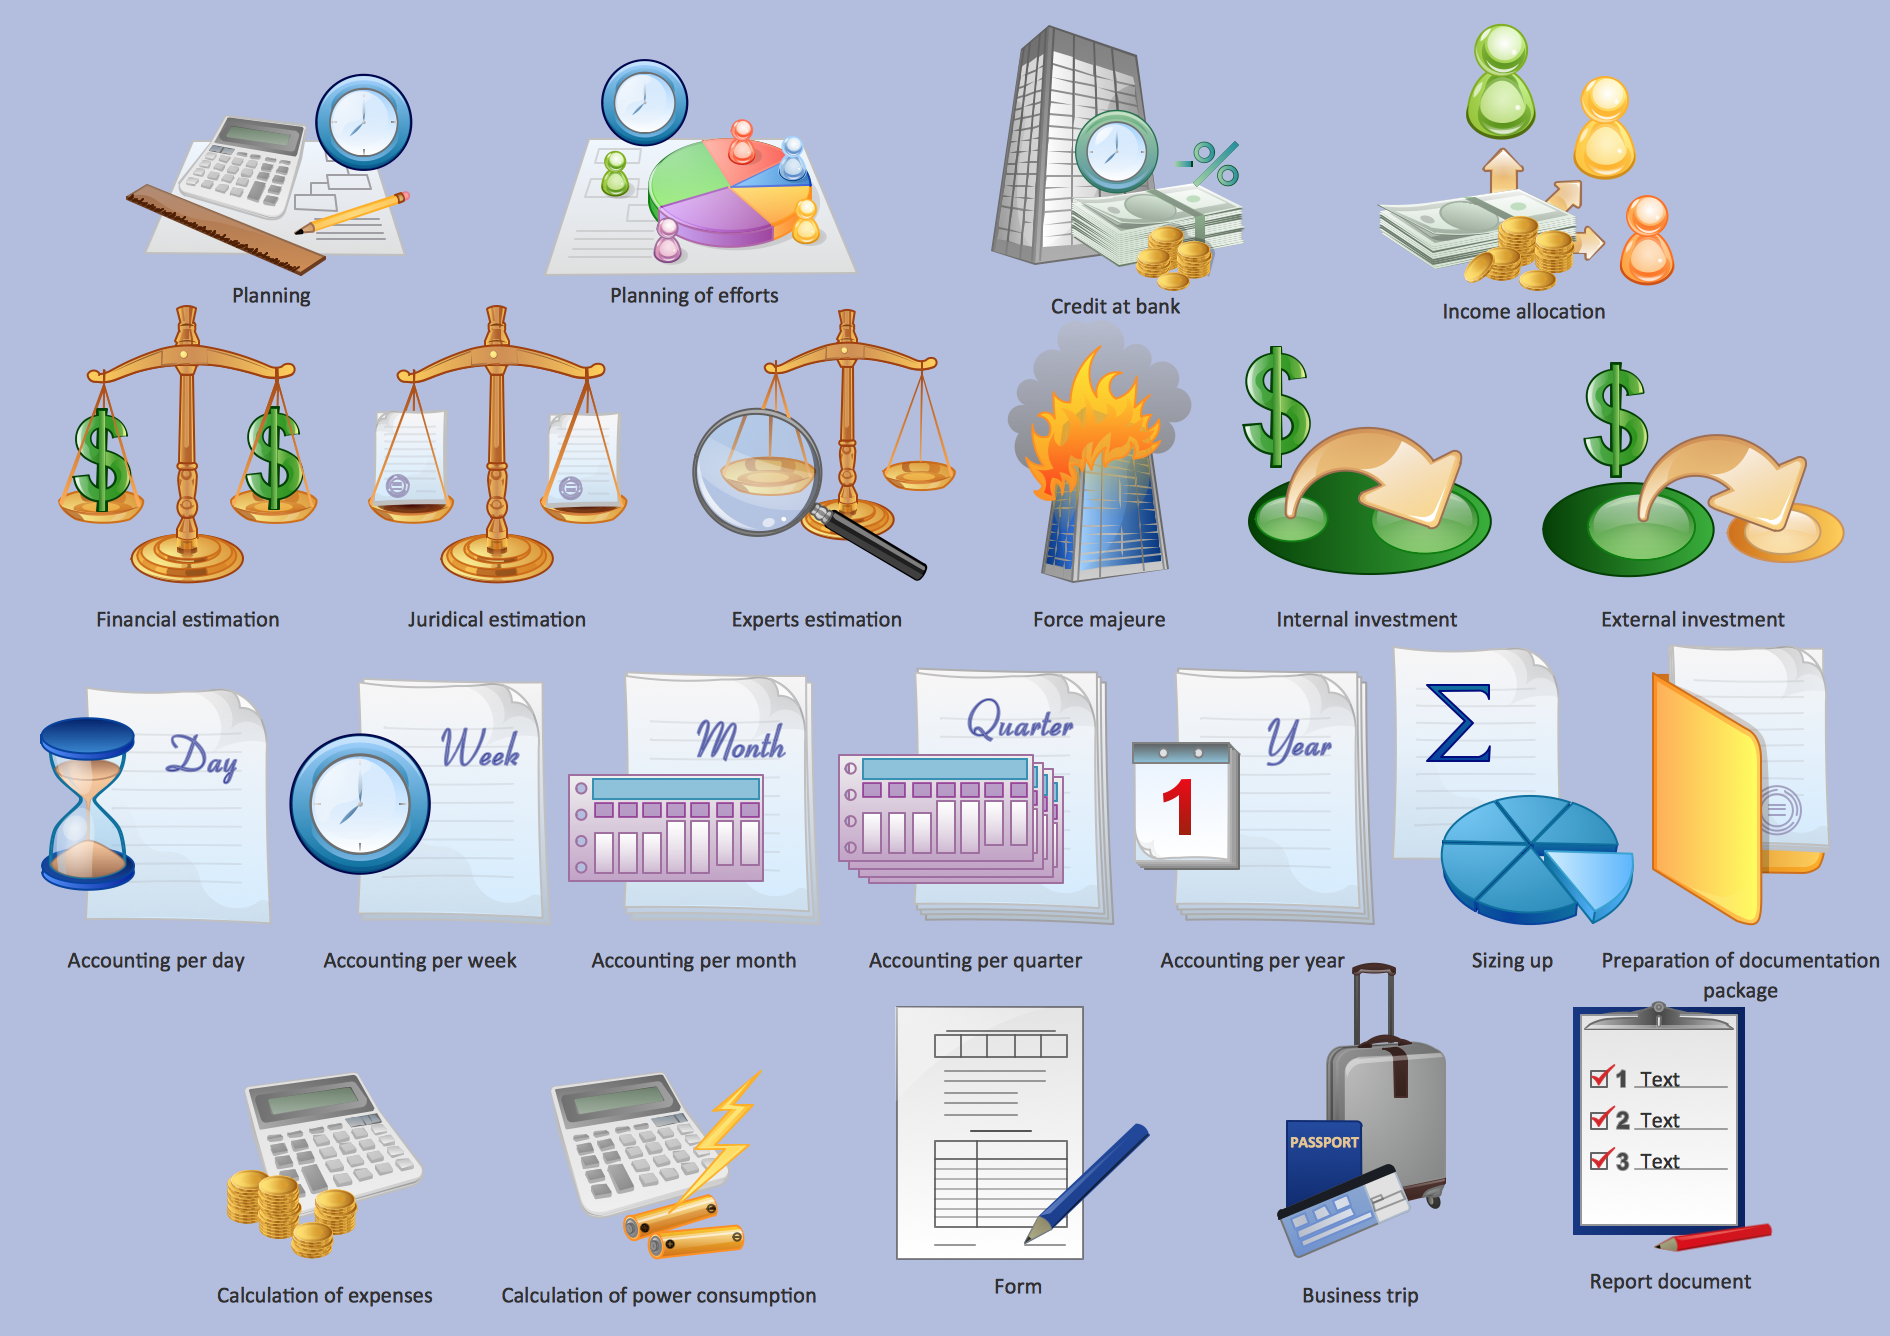
Picture: Management - Design Elements
Related Solution:
This sample shows the Pie Donut Chart. It was created in ConceptDraw DIAGRAM diagramming and vector drawing software using the ready-to-use object from the Pie Charts Solution from Graphs and Charts area of ConceptDraw Solution Park.
The Pie Donut Chart visualizes the percentage of parts of the whole and looks like as a ring divided into sectors. Pie Donut Charts are widely used in the business, statistics, analytics, mass media.
Picture: Pie Donut Chart. Pie Chart Examples
Related Solution:
Create bar charts for business management problem solving and data comparison using the ConceptDraw DIAGRAM diagramming and vector drawing software extended with the Bar Graphs Solution from the Graphs and Charts area of ConceptDraw Solition Park.
Picture: Bar Diagrams for Problem Solving.Create business management bar charts with Bar Graphs Solution
Related Solution:
A detailed mind map about the various elements and stages of project management.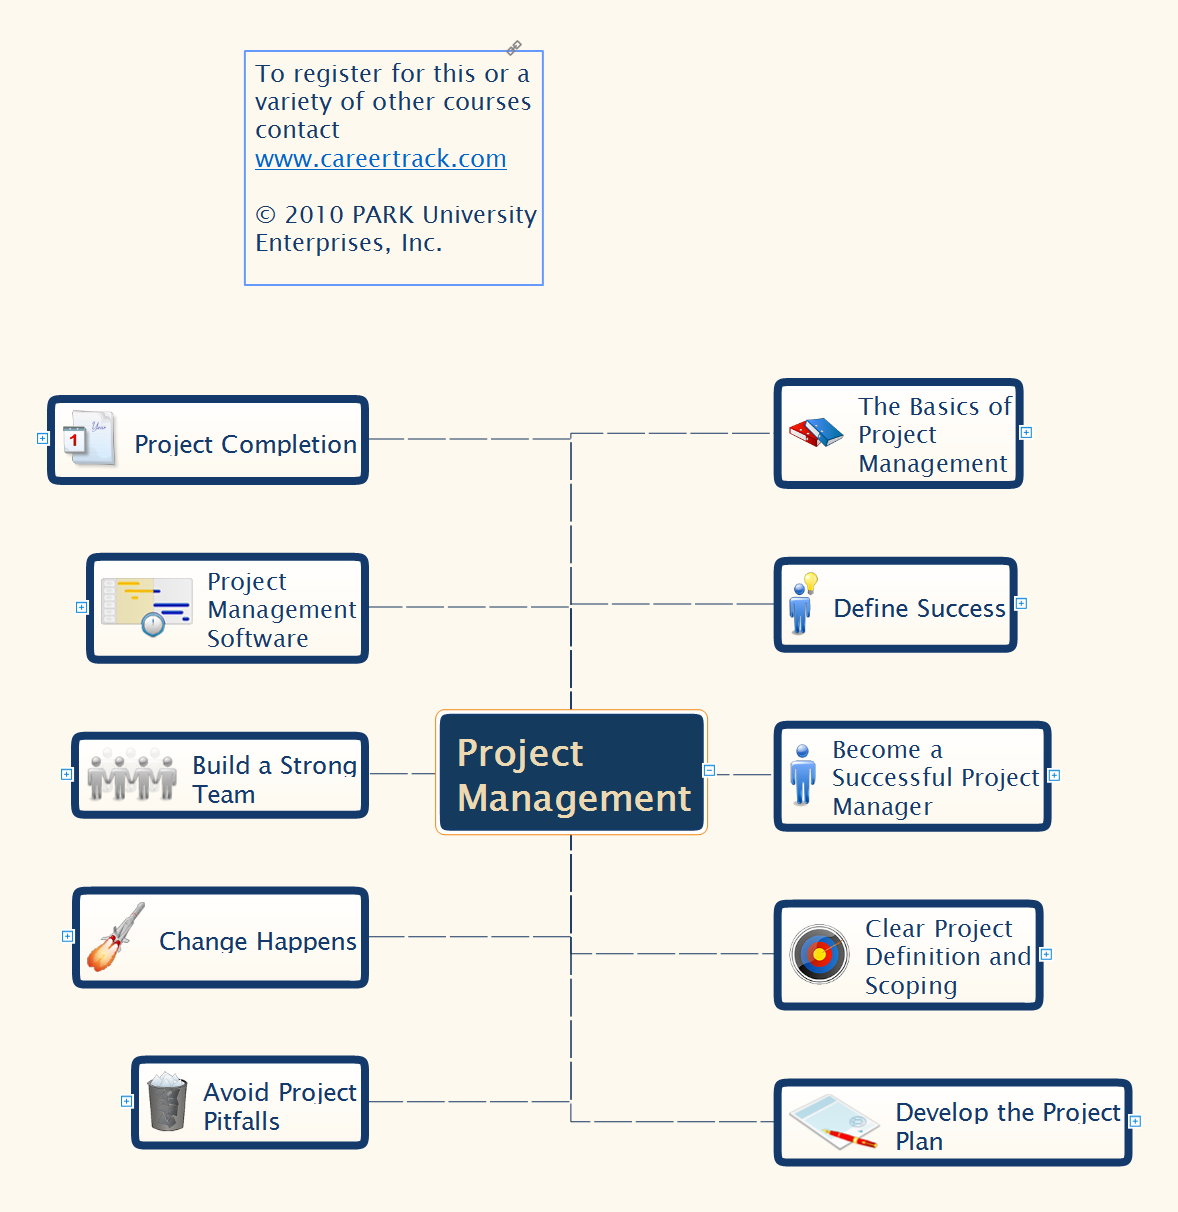
Picture: Project Management
Related Solution:
If you have doubts about some situation, there are tools that might help you. First used in the Stanford Research Institute in the 60s, SWOT analysis is a great solution and if you need to build a strategy, this tool is very effective. As a result, you will get the clear idea of all the opportunities and threats you might face.
This matrix was build for a TOWS analysis performance. A TOWS analysis includes the same process of listing strengths, weaknesses, opportunities and threats as a SWOT analysis. But, unlike SWOT, TOWS analysis primarily takes into account threats and opportunities and then at least - weaknesses and strengths. This is also a is a strategic planning tool. Beyond making a matrix, the strategy manager should investigate ways the organization can take edge of opportunities and reduce threats by turning to advantage strengths and weaknesses. Making SWOT and TOWS analysis uses the same approach and outputs close results. ConceptDraw SWOT and TOWS Matrix Diagrams solution supplies templates of matrices, that help to list clearly the constituents of SWOT and TOWS analysis.
Picture: SWOT Analysis Solution - Strategy Tools
The Internet is a giant computer network which connects computers all over the world. It is integral part of human society and business. But the serious question for network engineers, designers, lawmakers and enforcers is the need for protect the Internet networks from the Internet crimes, hacking and attacks. There are quite a number of hardware, software and physical methods of protection against them.
The samples you see on this page were created in ConceptDraw DIAGRAM using the tools of Network Security Diagrams Solution for ConceptDraw DIAGRAM software. They show protection networks with Firewalls and other network security devices.
Picture: Network Security
Related Solution:

