Pic. 1. MindMapping Software via SKYPE
Thanks to Mind Map Exchange solution which provide lots of features for seamless importing and exporting documents of between ConceptDraw® MINDMAP and most mindmapping software tools including MindJet Mindmanager, Freemind, XMind and other.

Develop your own presentation style...
Do great presentations...
Be successful!
See also:
One formula of professional mind mapping.
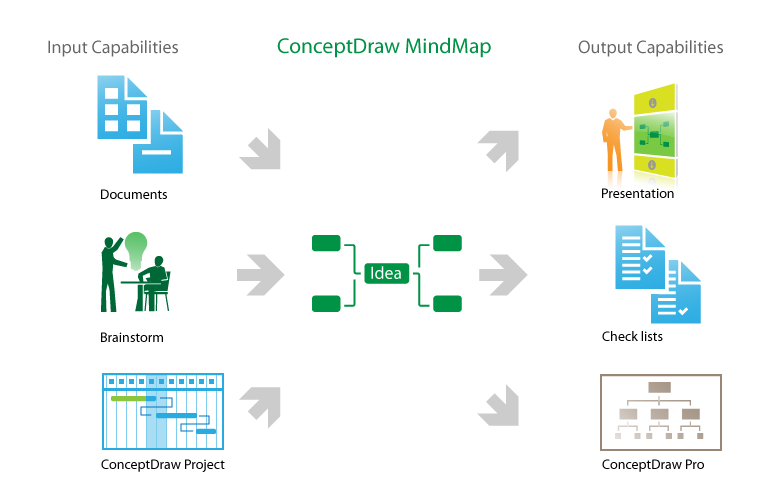
How to use input and output features to prepare data for presentation:
- Video lessons for professional mindmapping
- Sample-1. Project Status report as mindmap presentation via Skype
- Sample-2. Solar System presentation via Skype, mindmap and data
See also Samples of mind maps:
TEN RELATED HOW TO's:
While creating flowcharts and process flow diagrams, you should use special objects to define different statements, so anyone aware of flowcharts can get your scheme right. There is a short and an extended list of basic flowchart symbols and their meaning. Basic flowchart symbols include terminator objects, rectangles for describing steps of a process, diamonds representing appearing conditions and questions and parallelograms to show incoming data.
This diagram gives a general review of the standard symbols that are used when creating flowcharts and process flow diagrams. The practice of using a set of standard flowchart symbols was admitted in order to make flowcharts and other process flow diagrams created by any person properly understandable by other people. The flowchart symbols depict different kinds of actions and phases in a process. The sequence of the actions, and the relationships between them are shown by special lines and arrows. There are a large number of flowchart symbols. Which of them can be used in the particular diagram depends on its type. For instance, some symbols used in data flow diagrams usually are not used in the process flowcharts. Business process system use exactly these flowchart symbols.
Picture: Flowchart Symbols: Meaning and Examples
Related Solution:
ConceptDraw DIAGRAM software extended with Fishbone Diagrams solution from the Management area of ConceptDraw Solution Park is perfect for Cause and Effect Diagram creating. It gives the ability to draw fishbone diagram that identifies many possible causes for an effect or a problem. Causes and Effects are usually grouped into major categories to identify these sources of variation. Causes and Effects in the diagram show relationships among various factor. Fishbone diagram shows factors of Equipment, Process, People, Materials, Environment and Management, all affecting the overall problem.
Picture: Cause and Effect Diagram
Related Solution:
The critical importance of house electrical plans. 🔸 Learn how to create efficient electrical layouts using the ConceptDraw DIAGRAM app. Enhance ✔️ safety, ✔️ functionality, and ✔️ compliance with electrical codes in your home projects with our comprehensive guide
Picture:
Importance of House Electrical Plans.
How to Create Electrical Layouts
with ConceptDraw DIAGRAM App
Related Solution:
Gant Chart is a graphical representation of tasks as segments on a time scale. It helps plan and monitor project development or resource allocation. The horizontal axis is a time scale, expressed either in absolute or relative time.
Picture: Gant Chart in Project Management
Related Solution:
The Rapid UML Solution from the Software Development area of ConceptDraw Solution Park helps you to create the UML Class Diagrams quick and easy using ConceptDraw DIAGRAM diagramming and vector drawing software.
Picture: UML Class Diagram Tutorial
Related Solution:
UML Communication Diagram depicts the interactions between objects or parts in terms of sequenced messages and describes both the static structure and dynamic behavior of a system.
Picture: Diagramming Software for Design UML Communication Diagrams
The SWOT Analysis solution contains easy-to-use mind map templates that help identify Strengths, Weaknesses, Opportunities, and Threats, as well as outputs to ConceptDraw DIAGRAM for presenting analysis results.
Picture: SWOT Analysis
Related Solution:
Variable delay elements are often used to manipulate the rising or falling edges of the clock or any other signal in integrated circuits. Delay elements are also used in delay locked loops and in defining a time reference for the movement of data within those systems.
26 libraries of the Electrical Engineering Solution of ConceptDraw DIAGRAM make your electrical diagramming simple, efficient, and effective. You can simply and quickly drop the ready-to-use objects from libraries into your document to create the electrical diagram.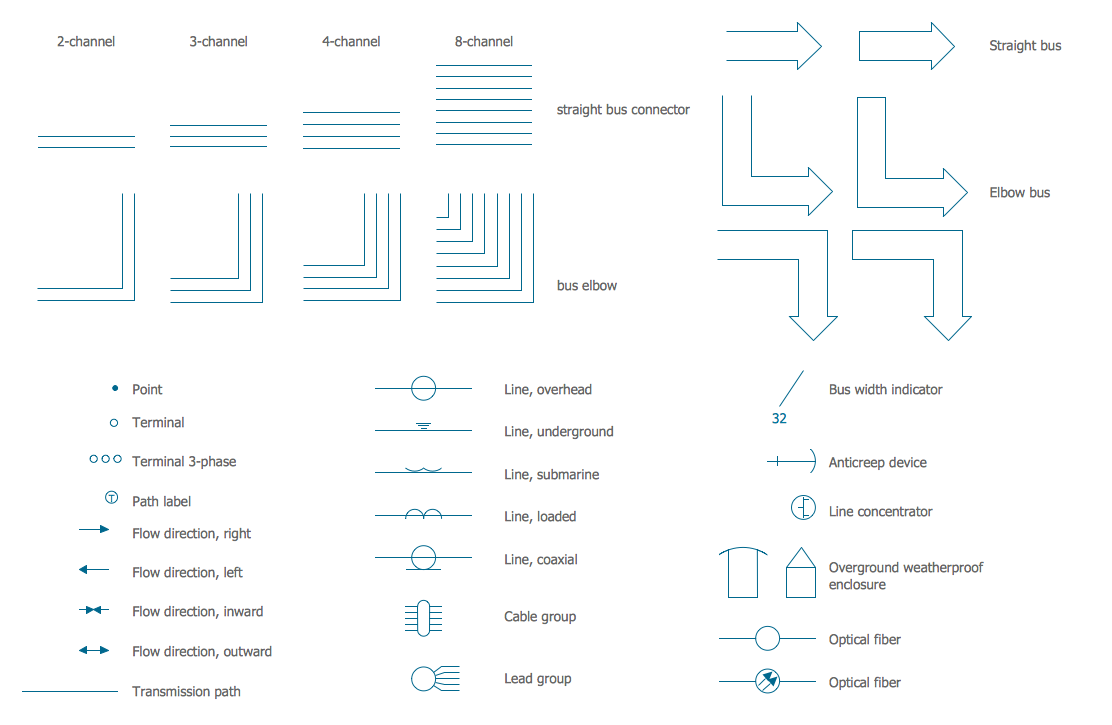
Picture: Electrical Symbols — Transmission Paths
Related Solution:
Good presentation ideas come the same way as we discover the real world, from personal experiences.
Picture: How To Create Good Presentation Ideas
Related Solution:
To support you in your tasks you can use the power of ConceptDraw DIAGRAM providing
intelligent vector graphics that are useful for management diagramming and
ConceptDraw MINDMAP for key management mind maps.
Picture: Business Productivity - Management
Related Solution: