Line Graph Charting Software
To design line and scatter charts use ConceptDraw DIAGRAM diagramming and vector drawing software extended with Line Graphs solution from Graphs and Charts area of ConceptDraw DIAGRAM Solution Park.
The Line Graphs solution provides templates, samples and a library of vector stencils for quick and easy drawing line and scatter charts.
The shapes library Line Graphs contains ready-to-use predesigned line and scatter chart objects you can simply drop into your document, quickly set up data and obtain professional looking line and scatter charts.
ConceptDraw DIAGRAM software with Line Graphs solution helps to create line and scatter charts for effective displaying data series in statistics, business and mass media for visual data comparison of quantitative metrics for different categories. Line Graphs solution also helps in visualizing time series to show how data change over time.
Free Download Line Graph Software and View All Examples

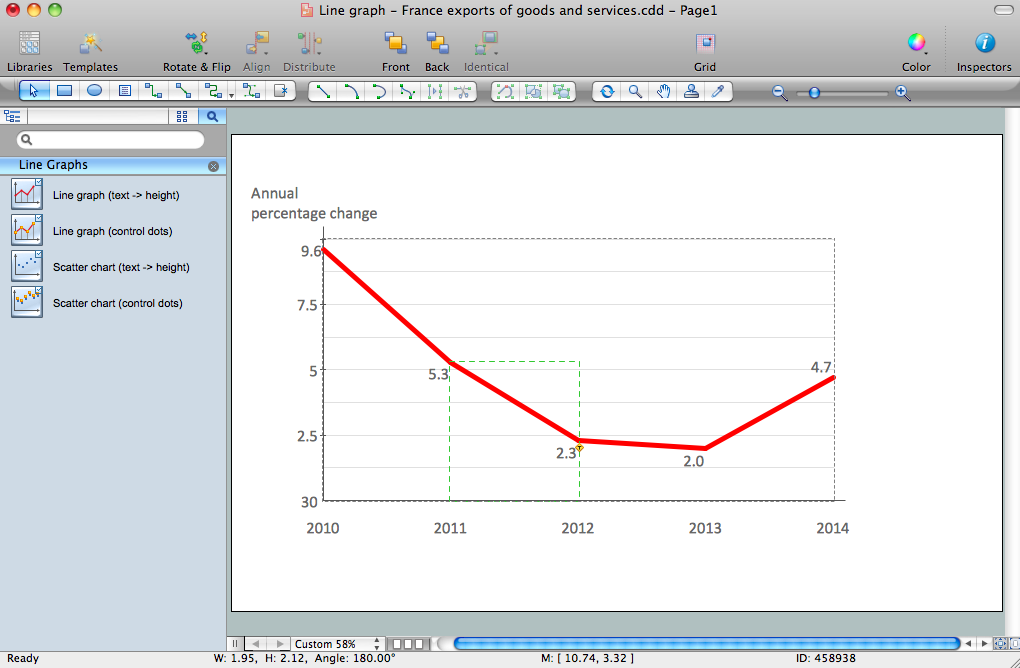
Example 1. Line chart example - Circuit efficiency.
More Related Diagrams:
TEN RELATED HOW TO's:
An architectural design is a technical drawing of a building. Creating of the architectural design is the important part in the architecture and building. It is a way for the architects to represent their ideas and concepts, to develop the design idea to the concrete proposal. It' very convenient for architects to create the architectural design using the computer software.
СonceptDraw DIAGRAM is a powerful CAD drawing software. Using the Floor Plans Solution from the Building Plans area of ConceptDraw Solution Park you can create professional looking architectural designs quick, easy and effective.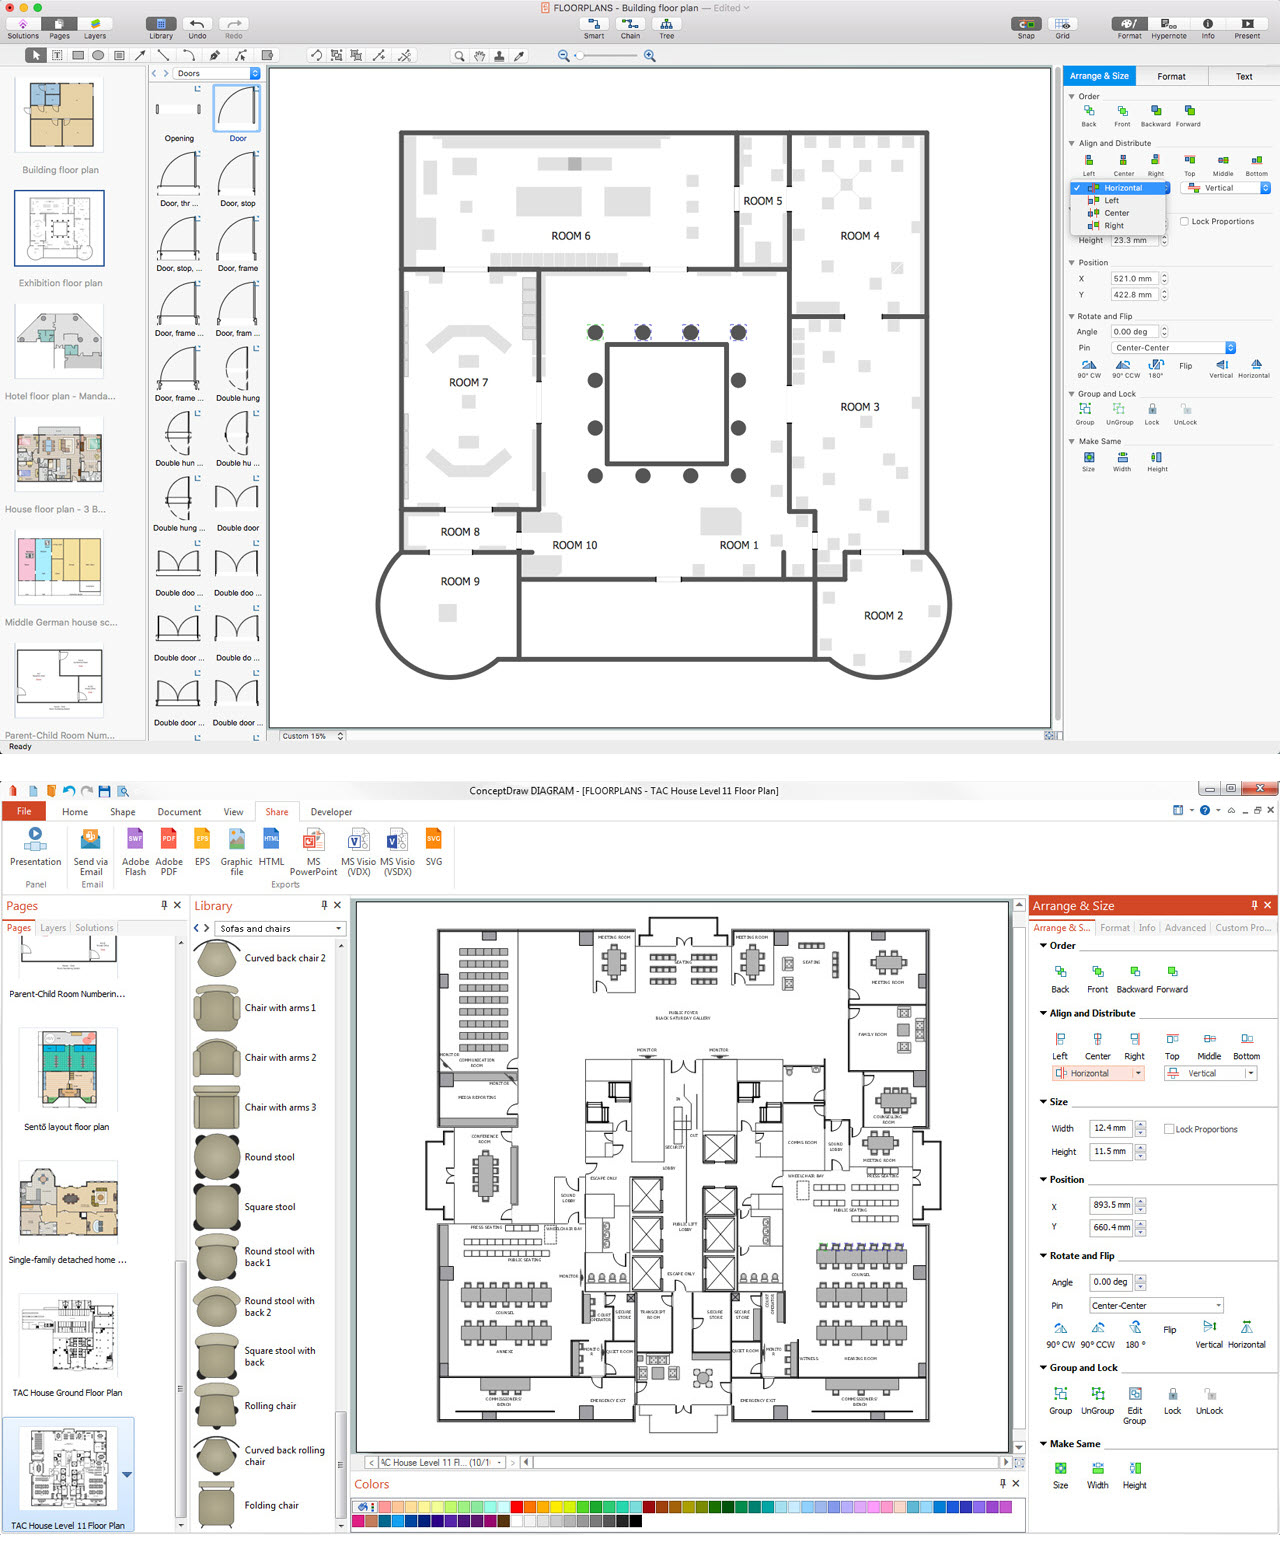
Picture: CAD Drawing Software for Architectural Designs
Related Solution:
ConceptDraw DIAGRAM diagramming and vector drawing software extended with Site Plans Solution from the Building Plans Area of ConceptDraw Solution Park is a powerful Site Plan Software.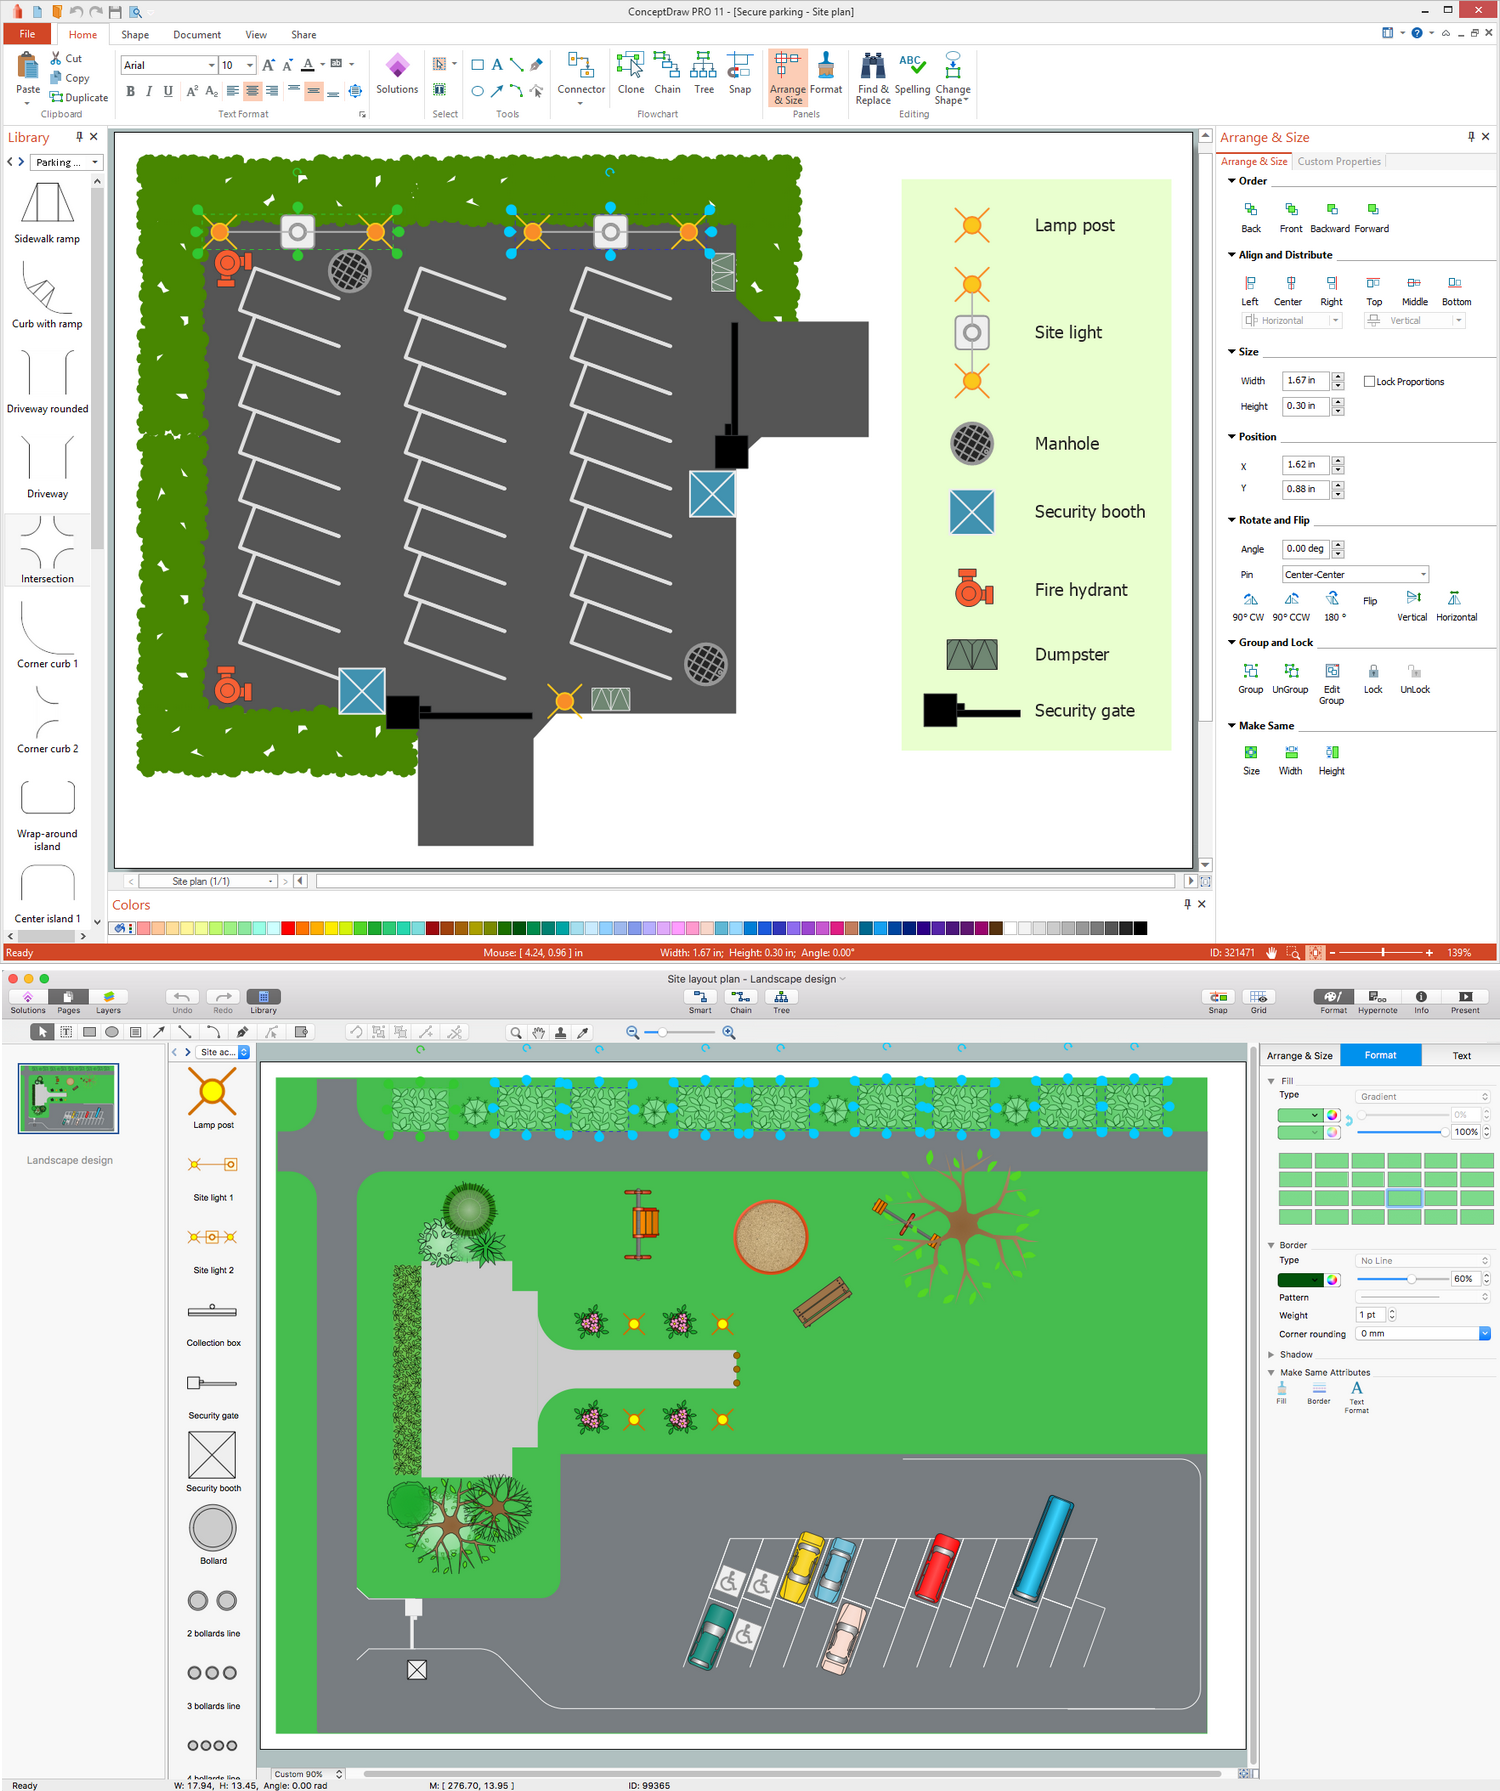
Picture: Site Plan Software
Related Solution:
The critical importance of house electrical plans. 🔸 Learn how to create efficient electrical layouts using the ConceptDraw DIAGRAM app. Enhance ✔️ safety, ✔️ functionality, and ✔️ compliance with electrical codes in your home projects with our comprehensive guide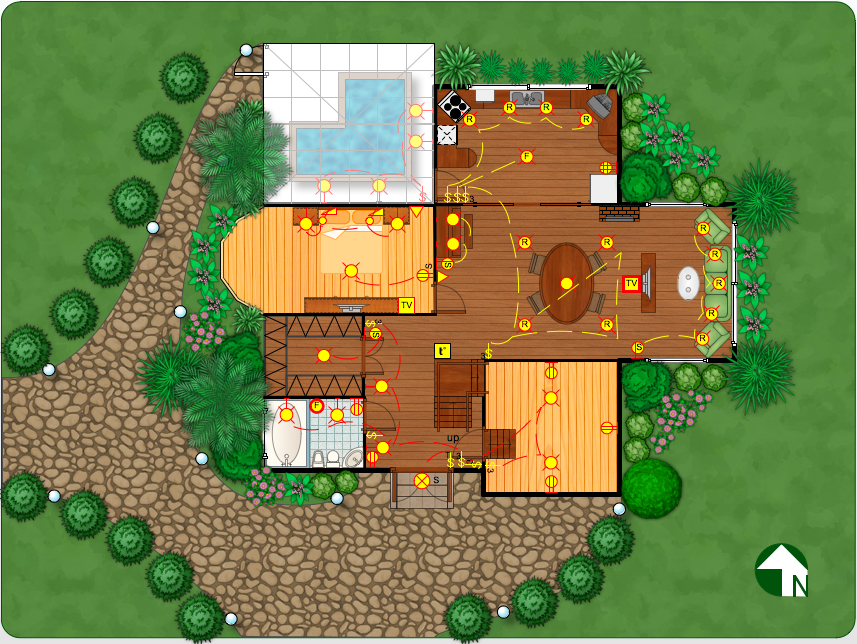
Picture:
Importance of House Electrical Plans
How to Create Electrical Layouts
with ConceptDraw DIAGRAM App
Related Solution:
Illustrate the Asia continent and explore its parts, geographical features, resources, and economic development through designing various kinds of colorful Asia maps and using them in presentations, reports, educational materials, websites, business documents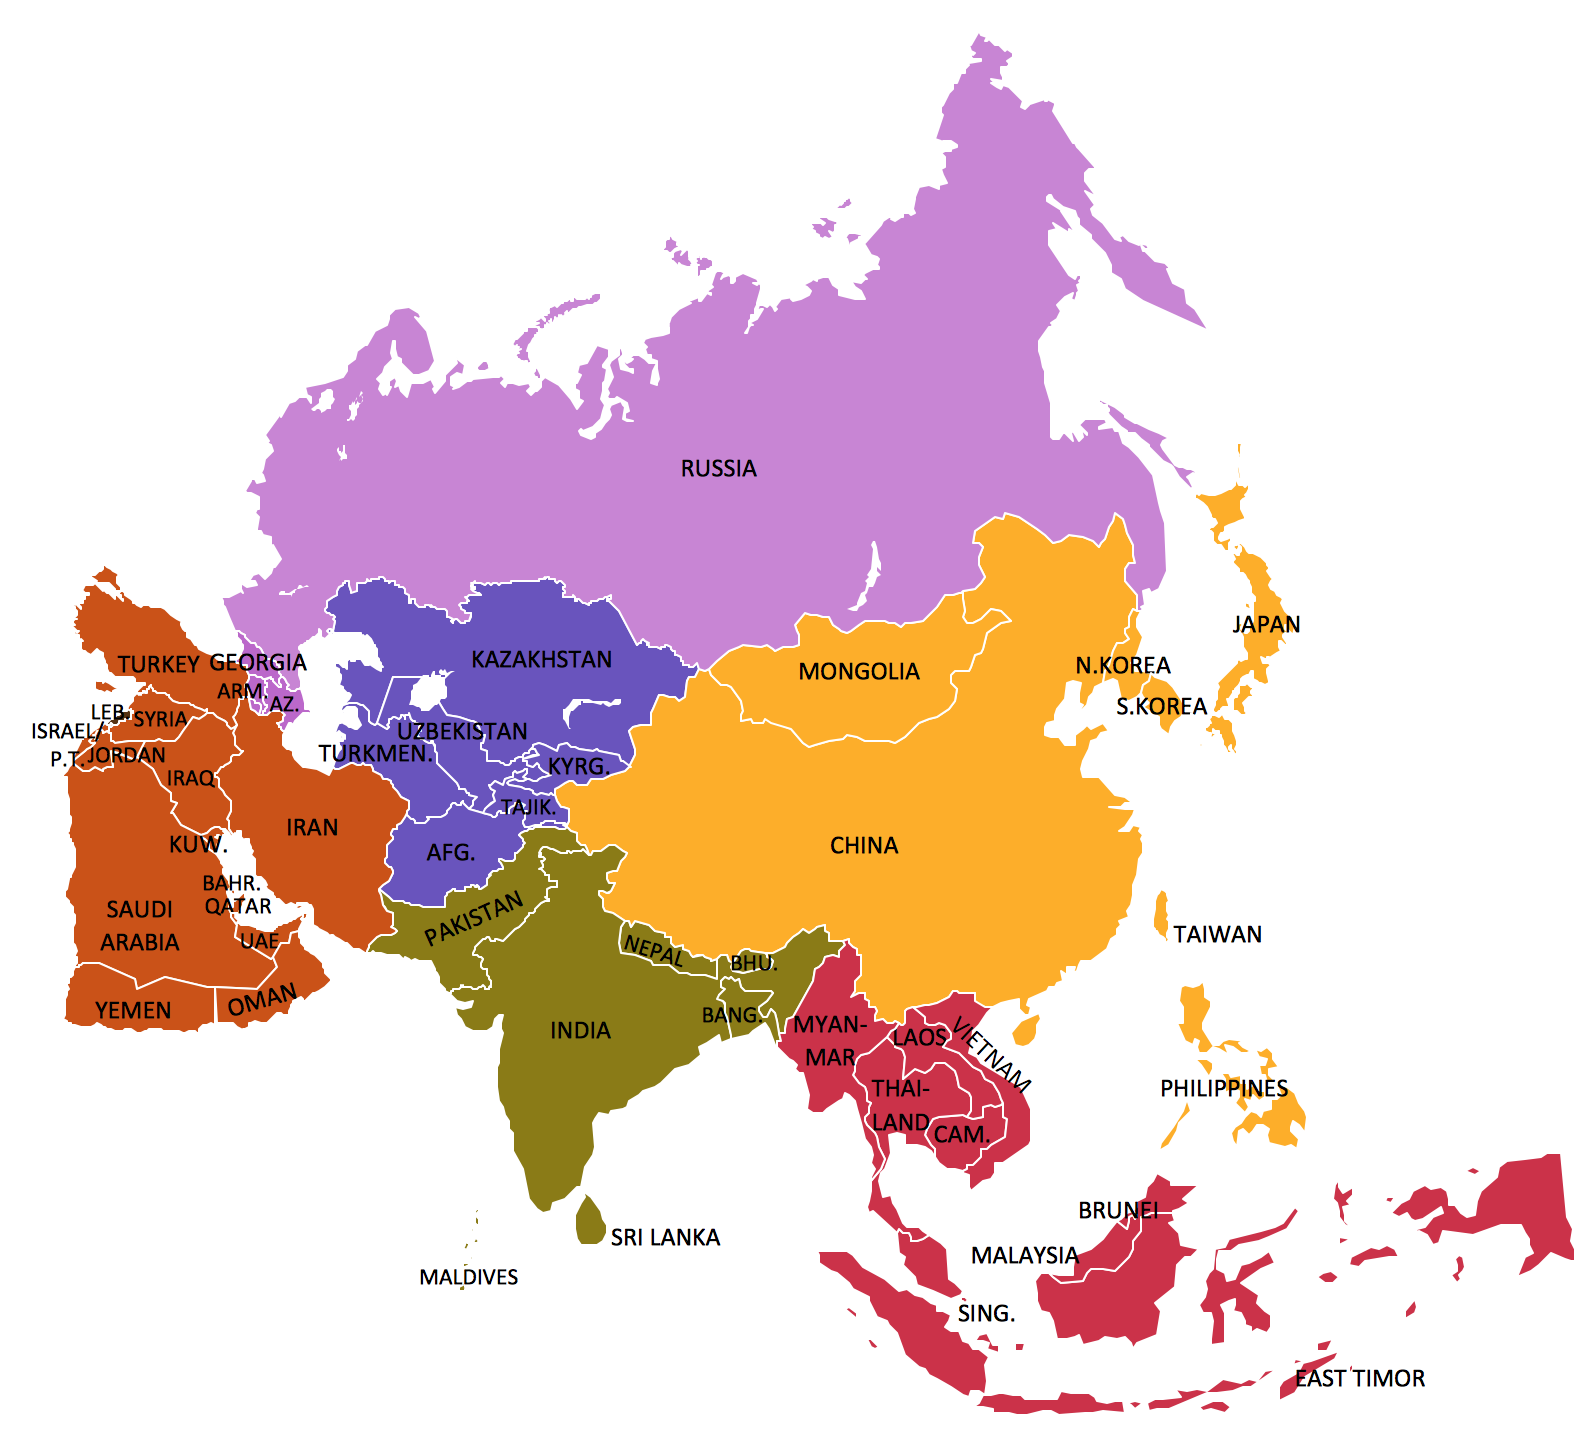
Picture: Geo Map — Asia
Related Solution:
Need to draw a diagram, process chart, flowchart, organizational chart, graphic design? ConceptDraw can help you to make professional graphic documents quickly.
Picture: Best Diagramming
Related Solution:
The Office Layout Plans Solution contains a large quantity of vector objects that will make your creating of the office design plans easy, quick and effective. It also provides templates and samples that will help you create the office designs of any difficulty in one moment.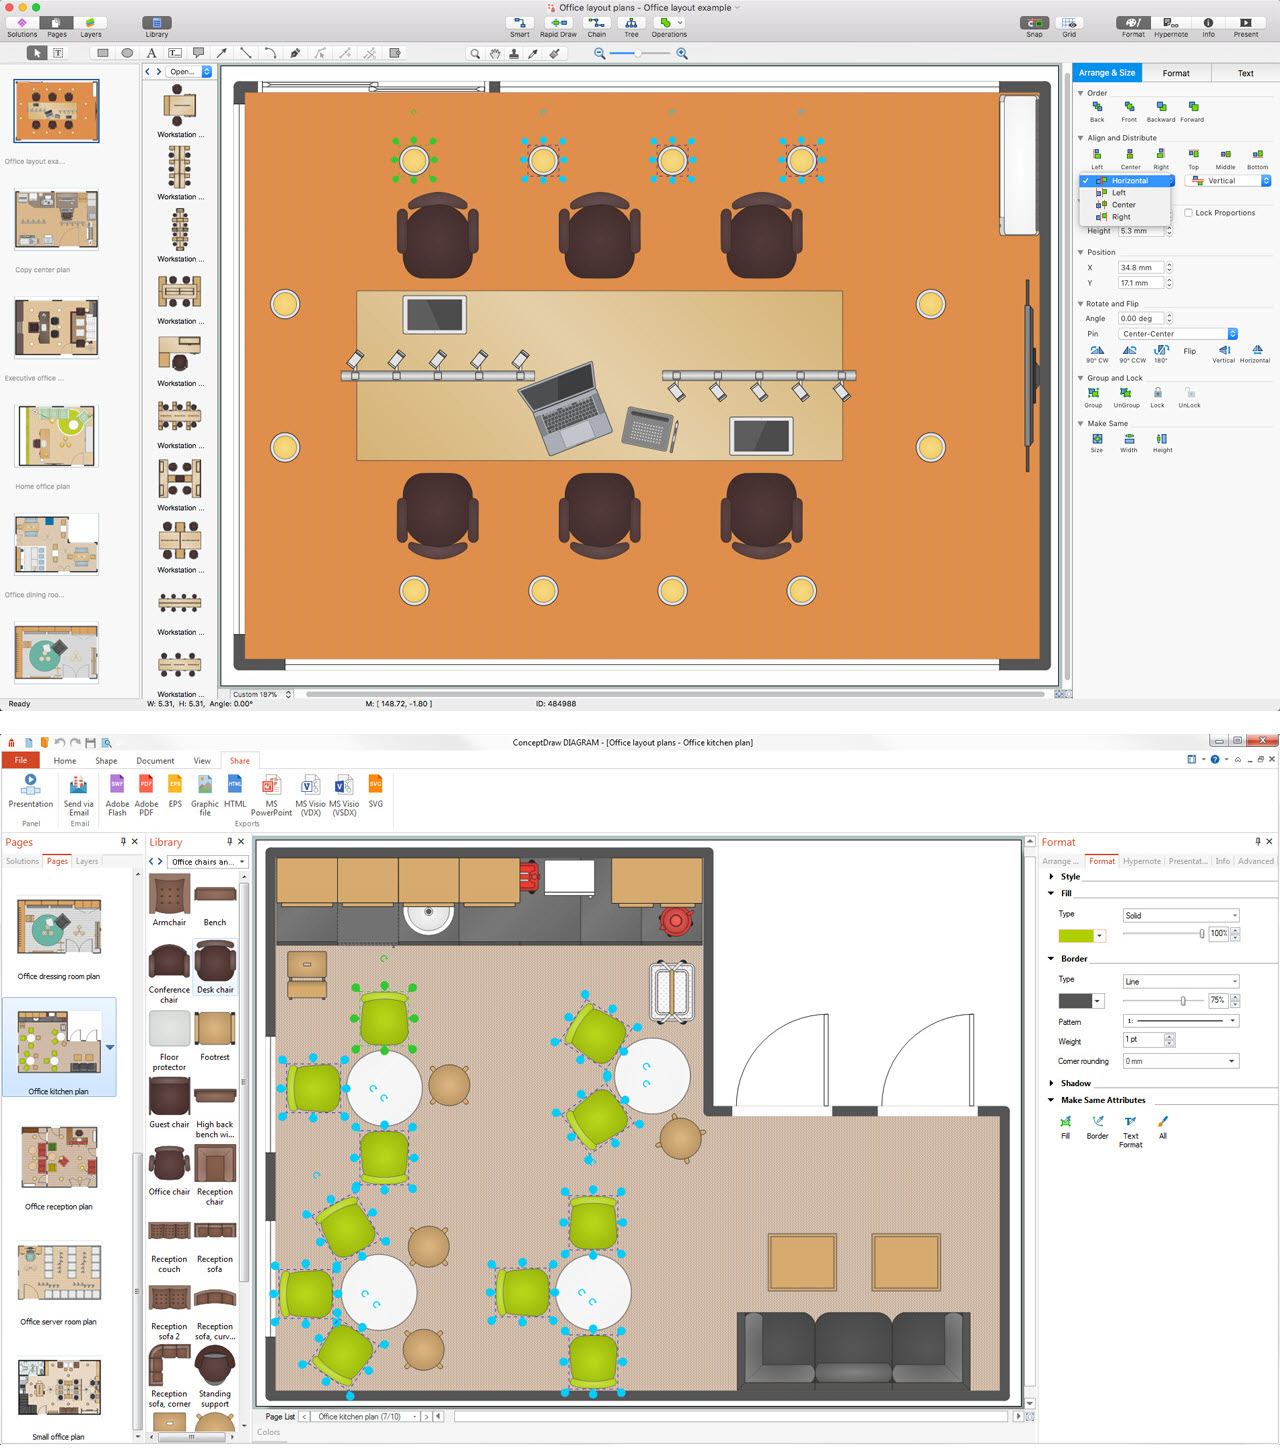
Picture: Office Design Software
Related Solution:
The calendars around us everywhere in the modern world. There are a lot of calendar types, each of them has its own assignment: Business calendar, Personal calendar, Economic calendar, Financial calendar, Daily calendar, Monthly calendar, and many other useful calendar types. ConceptDraw DIAGRAM offers you the possibility to make your own unique calendars on the base of the Blank Calendar Template which is included to the Calendars Solution from the Management Area.
Picture: Blank Calendar Template
Related Solution:
You need to draw the Bar Graph? The automated tool can be useful for you. ConceptDraw DIAGRAM diagramming and vector drawing software extended with Bar Graphs solution from Graphs and Charts area of ConceptDraw Solution Park will help you create any Bar Graph.
Picture: Bar Graph
Related Solution:
This sample shows the Scatter Plot without missing categories. It’s very important to no miss the data, because this can have the grave negative consequences. The data on the Scatter Chart are represented as points with two values of variables in the Cartesian coordinates. This sample can be used in the engineering, business, statistics, analytics, at the creating the financial and other types of reports.
Picture: Blank Scatter Plot
Related Solution:
Waterfall chart shows the changing of the value from one state to another through the series of intermediate changes. The waterfall diagrams are widely used in the business. They are used to represent the set of figures and allow link the individual values to the whole.
Picture: Waterfall Bar Chart
Related Solution: