
Example 1. Drawing ER diagrams on a Mac
Entity-Relationship Diagram (ERD) solution from the Software Development Area for ConceptDraw Solution Park specially designed for professional ERD drawing gives you the possibility to design ER diagrams easily on your Mac. Use powerful drawing tools of this solution and 2 libraries with 45 predesigned vector objects:
- ERD Chen's Notation Library
- ERD Crow’s Foot Notation Library
 Solution")
Example 2. ERD Libraries for Entity-Relationship Diagram (ERD) Solution
To quickly design the E-R Diagram for Mac, you can follow few simply steps:
- drag desired objects from the libraries of Entity-Relationship Diagram (ERD) Solution to your document,
- connect the objects,
- use the Action button menu in the upper right corner of the object to change it,
- apply Line, Fill, Shadow and Text tools to format your diagram.
Another useful way of drawing in ConceptDraw DIAGRAM is to use quick-start Chen ERD template or Crow's Foot ERD template, and change it according to your needs.

Example 3. Drawing ER Diagram
The ER diagrams you see on this page were created in ConceptDraw DIAGRAM using the libraries from Entity-Relationship Diagram (ERD) Solution. An experienced user spent 10-15 minutes creating each of these samples. You can find them all at ConceptDraw STORE.
Use the Entity-Relationship Diagram (ERD) Solution for ConceptDraw DIAGRAM software for quick, easy and effective drawing ER diagrams on a Mac.
All source documents are vector graphic documents. They are available for reviewing, modifying, or converting to a variety of formats (PDF file, MS PowerPoint, MS Visio, and many other graphic formats) from the ConceptDraw STORE. The Entity-Relationship Diagram (ERD) Solution is available for all ConceptDraw DIAGRAM users.
NINE RELATED HOW TO's:
ConceptDraw DIAGRAM is a powerful intelligent vector graphics engine that can be used to create basic diagrams including flowcharts, charts, workflows, flowcharts, organizational charts, business diagram, learn business diagrams, flow diagrams.
Picture: The Best Mac Software for Diagramming or Drawing
Related Solution:
There are many ways to describe a database structure. One of the most usual is to draw an entity relationship diagram (ERD) using a Crow’s Foot notation to represent database elements. If you don’t want to draw it on paper, you should use an appropriate software.
An entity-relationship (ER) diagram is used to show the structure of a business database. ERD represents data as objects (entities) that are connected with standard relationships symbols which Illustrate an association between entities. ERD, there is a wide range of ERD notations used by data bases architects for reflecting the relationships between the data entities. According to the crow’s foot notation relationships are drawn as single labeled lines designating a certain kinds of relationship. Crow foot notation is a most frequently used ERD standard, because of improved readability of diagrams, with a more accurate use of space on the page._Win_Mac.png)
Picture: Entity Relationship Diagram - ERD - Software for Design Crows Foot ER Diagrams
Related Solution:
Entity Relationship Diagram (aka ERD, ER Diagram, E-R Diagram) is a well-tried software engineering tool for illustrating the logical structure of databases. Professional ERD drawing is an essential software engineering method for database modeling. Use powerful tools of ConceptDraw DIAGRAM Entity Relationship Diagram Software extended with Entity-Relationship Diagram (ERD) Solution.
Picture: Entity Relationship Diagram Software
Related Solution:
Software designers and developers widely apply the UML for developing and building database systems and computer applications. For drawing the UML diagrams they need convenient database diagram tool. ConceptDraw DIAGRAM extended with Rapid UML Solution from the Software Development Area for ConceptDraw Solution Park is ideal database diagram tool for software designers and developers.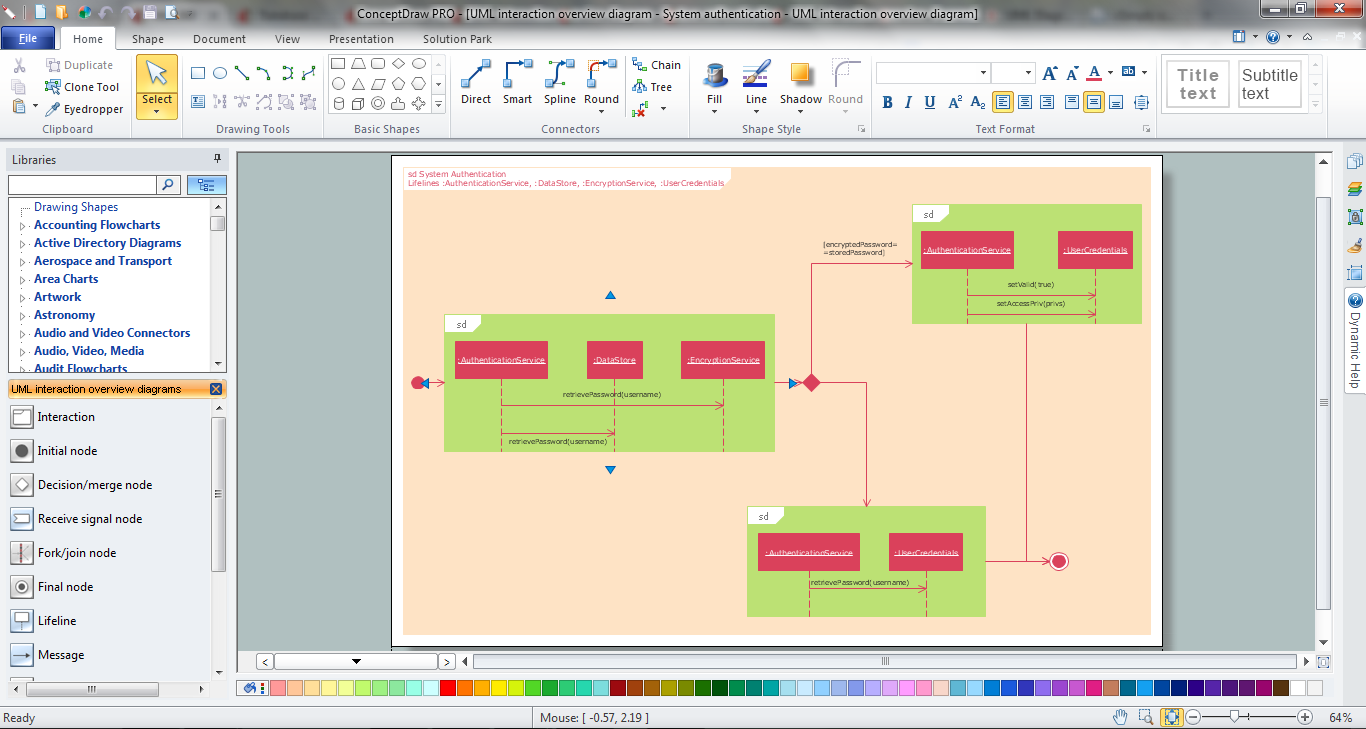
Picture: Database Diagram Tool
Related Solution:
This method of problem analysis is widely used in IT, manufacture industries and chemical engineering. If you want to take a fresh look on your problem, you can draw a fishbone diagram with ConceptDraw DIAGRAM software, which supports both MAC OS and Windows. You can see and download fishbone diagram samples and templates in ConceptDraw Solution Park.
This Fishbone (Ishikawa) diagram can be applied as template for performing the cause and effect analysis of a service industry problems. It can help to determine factors causing problems. Causes in this diagram are categorized according to the 4S’s principle that means Surroundings, Suppliers, Systems and Skills. Grouping causes allows to reveal main interactions between different events. This diagram was made using ConceptDraw Fishbone diagrams solution. It can help to reveal the causes effected a complicated issue. Of course it can be used together with other methods of approaching to the problem solving.
Picture: Draw Fishbone Diagram on MAC Software
Related Solution:
It is very difficult to get into database model idea without any examples. To create one, you can use Chen’s notation for Entity Relationship Diagrams (ERD) and try to see all the peculiarities yourself. This notation describes entities and relations as basic geometric shapes like rectangles and diamonds.
Chen notation for Entity-relationship diagrams is used for designing relational databases. It depicts the database entities as a set of subjects. For example events, people, ideas, etc. All entities has common characteristics (attributes). Any object of the system is identified as the sole and unique. The name of entity should indicate the class or type of the the whole object, not a given example. The connection commonly represents a relationship between entities. Conceptdraw Entity-Relationship Diagrams (ERD) solution provides the libraries with ready-to-use ERD element fitting Chen's notation objects and relationships.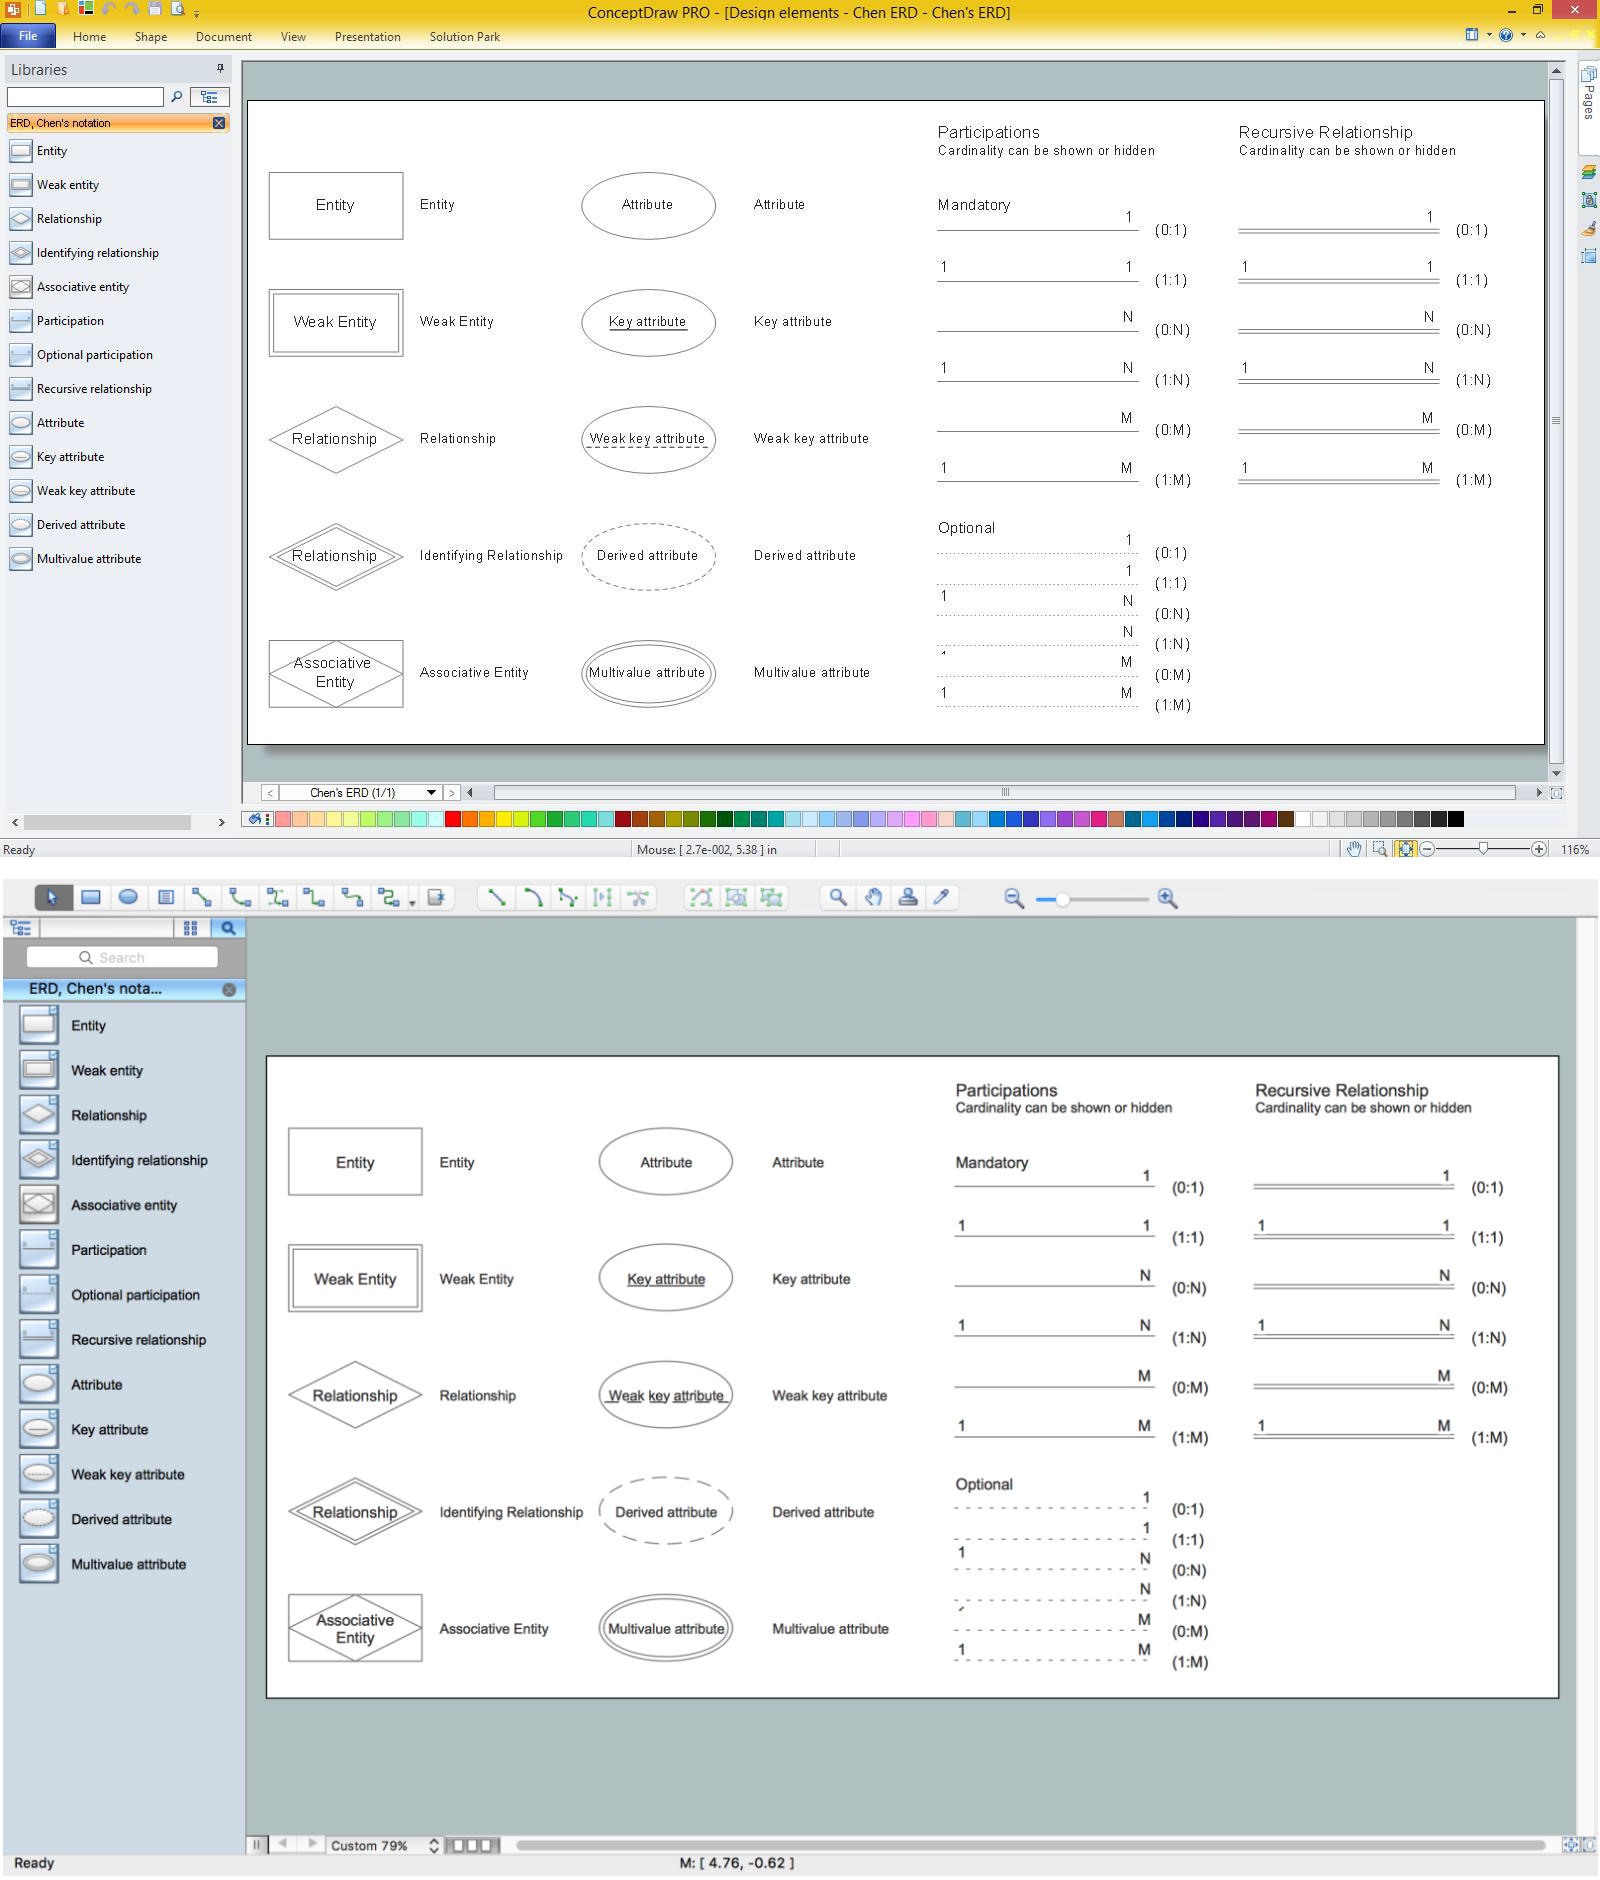
Picture: Design Element: Chen for Entity Relationship Diagram - ERD
Related Solution:
The entity–relationship (ER) model is a data model that lets graphically represent the information system and depict the relationships between people, objects, concepts, places, and events within a given system. It is also convenient to use the ER Diagram for Cloud computing representation and description the Cloud computing architecture, design them with pleasure using the extensive tools of the Cloud Computing Diagrams solution from the Computers and Network area of ConceptDraw Solution Park.
Picture: ER Diagram for Cloud Computing
Related Solution:
The Entity-Relationship Diagram (ERD) Solution from the Software Development Area for ConceptDraw Solution Park extends ConceptDraw DIAGRAM vector graphics and diagramming software with the ability of drawing the Entity Relationship Diagrams for visually describing the databases with Crow’s Foot and Chen's notation icons.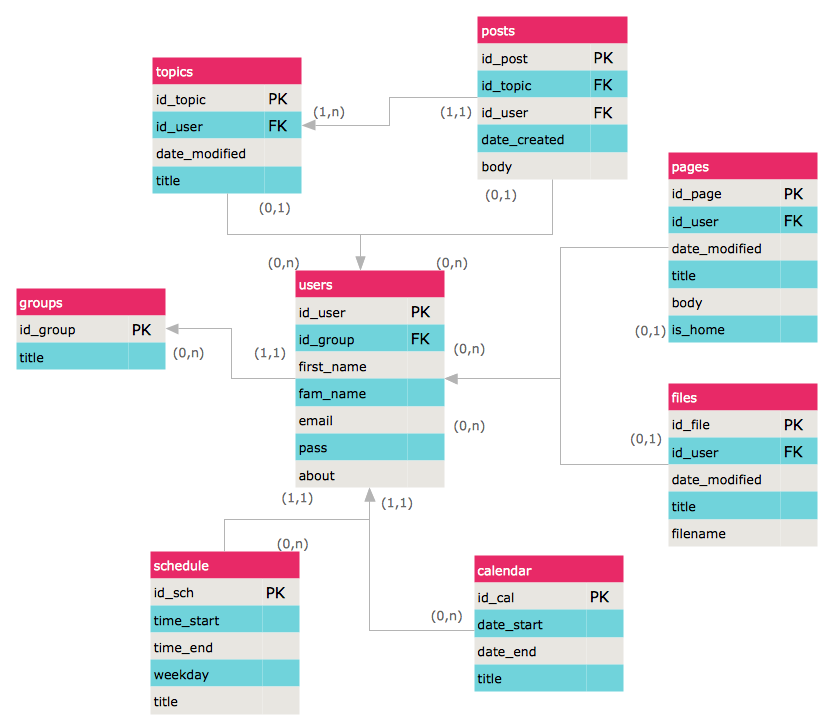
Picture: Entity Relationship Diagrams
Related Solution:
A database is a data collection, structured into some conceptual model. Two most common approaches of developing data models are UML diagrams and ER-model diagrams. There are several notations of entity-relationship diagram symbols and their meaning is slightly different. Crow’s Foot notation is quite descriptive and easy to understand, meanwhile, the Chen notation is great for conceptual modeling.
An entity relationship diagrams look very simple to a flowcharts. The main difference is the symbols provided by specific ERD notations. There are several models applied in entity-relationship diagrams: conceptual, logical and physical. Creating an entity relationship diagram requires using a specific notation. There are five main components of common ERD notations: Entities, Actions, Attributes, Cardinality and Connections. The two of notations most widely used for creating ERD are Chen notation and Crow foot notation. By the way, the Crow foot notation originates from the Chen notation - it is an adapted version of the Chen notation.
Picture: ERD Symbols and Meanings
Related Solution:
 Solution")
