Using the libraries of the Rapid UML Solution for ConceptDraw DIAGRAM you can create your own visual vector UML diagrams quick and easy.
TEN RELATED HOW TO's:
ConceptDraw DIAGRAM diagramming and vector drawing software extended with Marketing Diagrams Solution from the Marketing Area of ConceptDraw Solution Park is the best software for quick and easy creating Marketing Flow Chart of any complexity and design.
Picture: Marketing Flow Chart
Related Solution:
UML Diagrams Social Networking Sites Project. This sample was created in ConceptDraw DIAGRAM diagramming and vector drawing software using the UML Use Case Diagram library of the Rapid UML Solution from the Software Development area of ConceptDraw Solution Park.
This sample shows the Facebook Socio-health system and is used at the projection and creating of the social networking sites.
Picture: UML Use Case Diagram Example. Social Networking Sites Project
Related Solution:
This sample shows the UML Class Diagram of delivery system. On this diagram you can see the classes that are connected with aggregation and composition associations indicated with the multiplicity. This sample can be used by delivery services, postal services.
Picture: UML Diagram for System
Related Solution:
UML Apartment Plan. This sample was created in ConceptDraw DIAGRAM diagramming and vector drawing software using the UML Class Diagram library of the Rapid UML Solution from the Software Development area of ConceptDraw Solution Park.
This sample show the detailed plan of the apartment and is used by building companies, design apartments, real estate agencies, at the buying / selling of the realty.
Picture: UML Class Diagram Example - Apartment Plan
Related Solution:
ConceptDraw - Organigram software allows quickly create Organigrams and much more. ConceptDraw DIAGRAM is an ideal tool for Administrative staff to clearly demonstrate the company orgchart professional.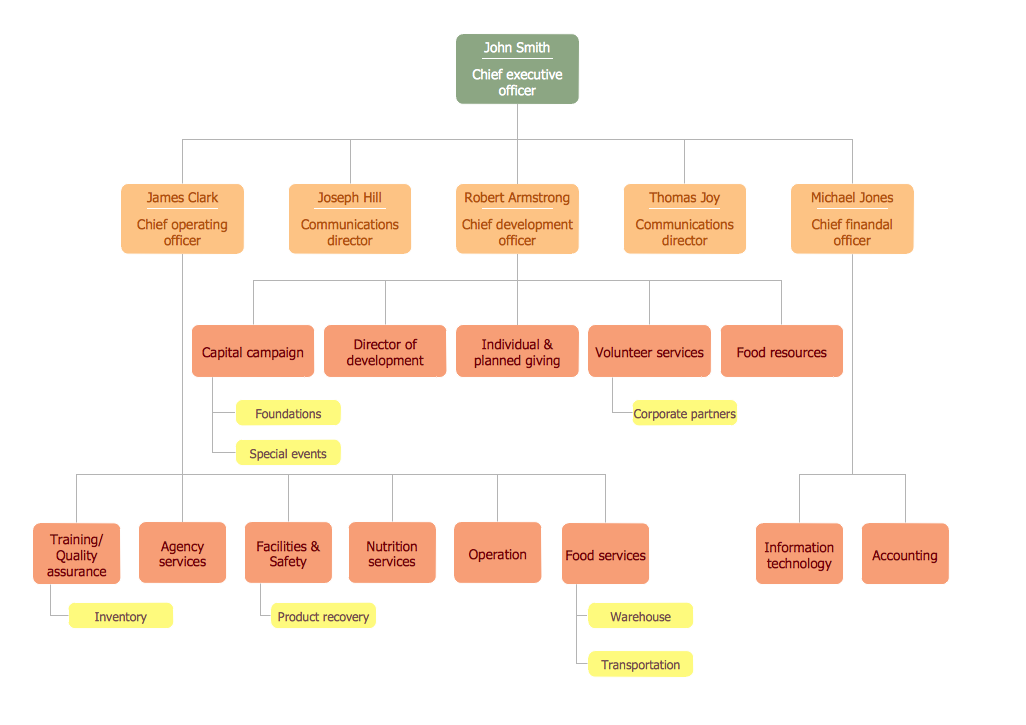
Picture: Organigrams with ConceptDraw DIAGRAM
Related Solution:
The economic calendar is a convenient way to display the economic events, the situation on the financial markets, it is a handy tool to keep track the chronology and dynamics of important events in the economy. But how design an economic calendar? ConceptDraw DIAGRAM extended with Calendars Solution from the Management Area is a useful, convenient and effective software for quick and easy design professional looking and attractive economic calendars.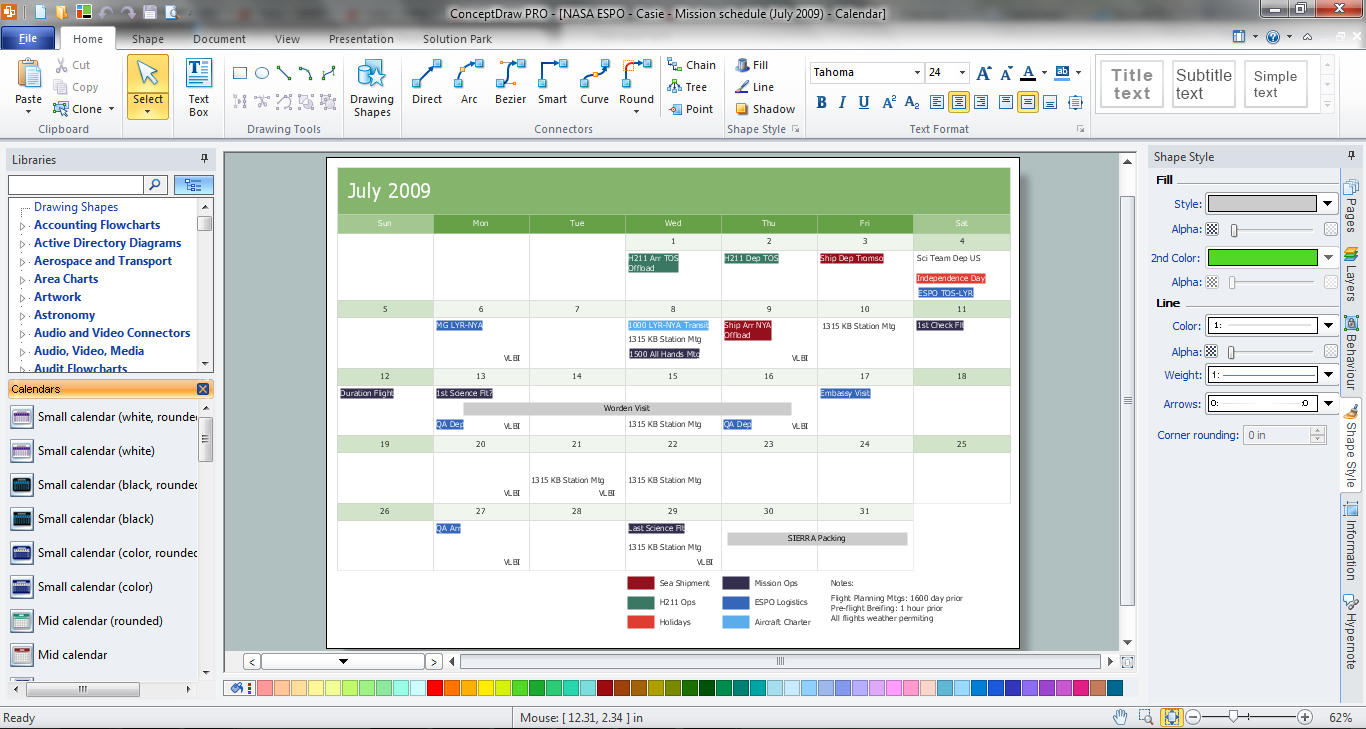
Picture: Economic Calendar
Related Solution:
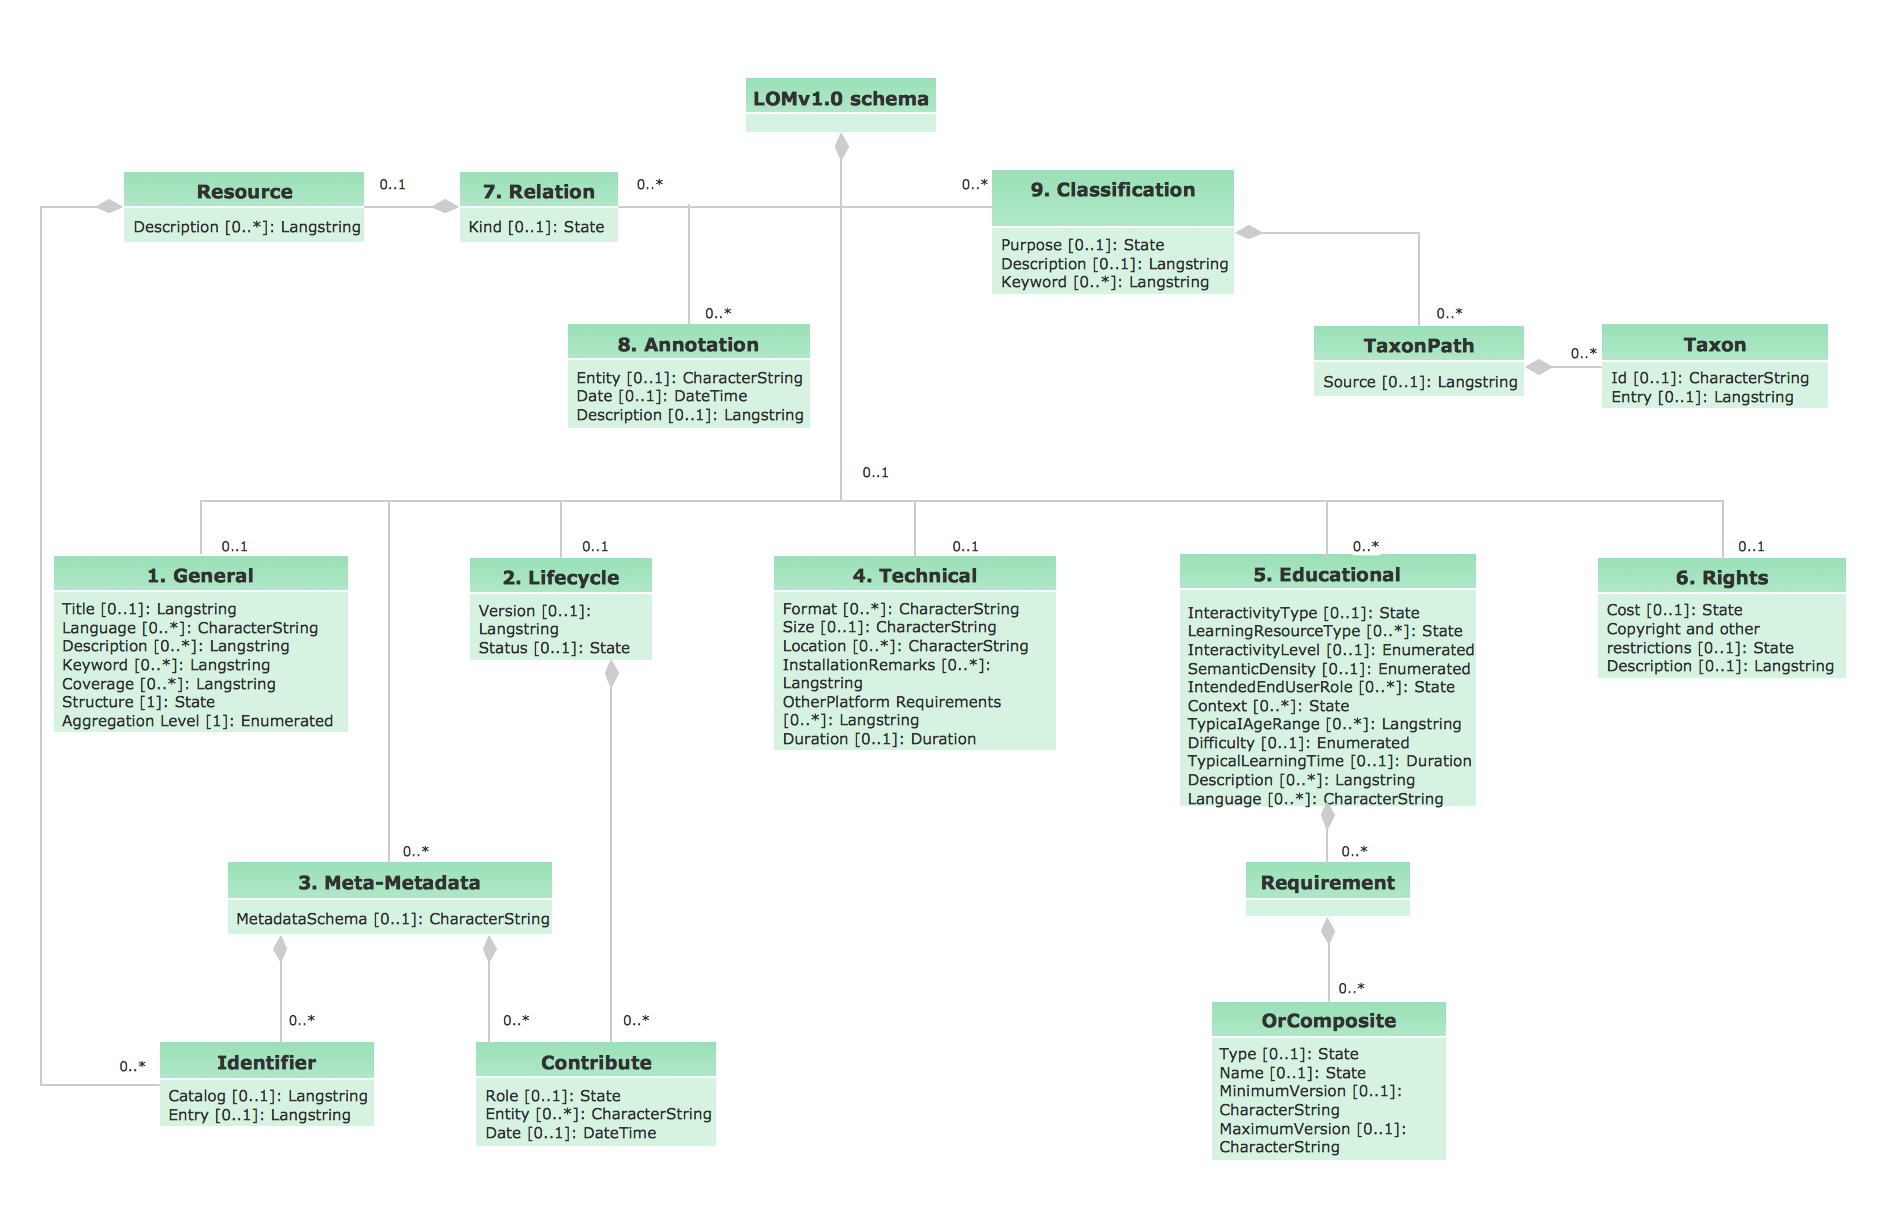
While developing software, it is very important to have a visual model, because it helps to represent the logic and the architecture of an application. Experienced engineers use UML diagrams to denote relationships between classes and their instances. UML is a general language for a set of diagrams like deployment diagrams, object diagrams or use case diagrams.
This diagram represents UML class diagram used for a software system development using an object-oriented method. Class diagrams are categorized as static structure diagrams that depict the physical structure of a system. Class diagram divides a software system's structure into "classes". Classes are defined by the methods and variables of objects. UML Class diagram is used to depict relationships and source code dependencies between objects.
Picture: UML Diagram
Related Solution:
ConceptDraw has several examples that help you to start using software for designing UML Use Case Diagrams.
Picture: UML Use Case Diagrams
UML Timing Diagram as special form of a sequence diagram is used to explore the behaviours of objects throughout a given period of time.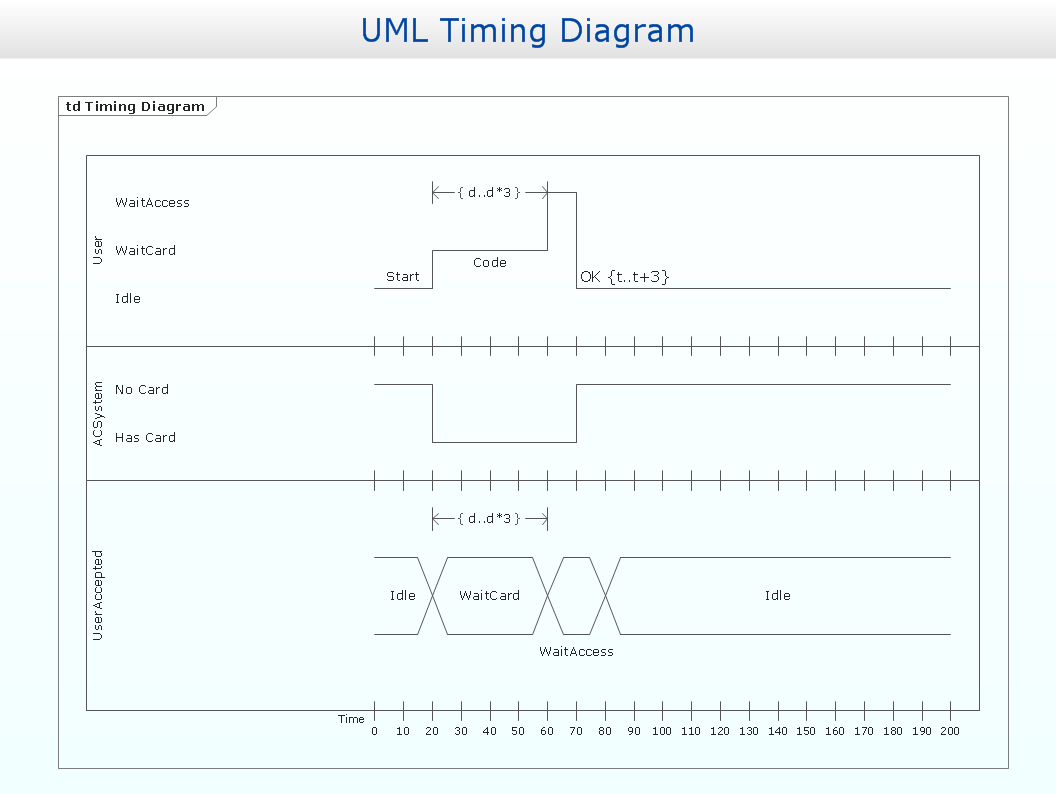
Picture: Timing diagram
Related Solution:
ConceptDraw Network Drawing Software - Network design software for network drawings with abundant examples and templates.
Create computer network designs, diagrams and schematics using ConceptDraw.
Picture: Network Drawing Software