Example 1. Online Diagram Tool - ConceptDraw DIAGRAM /p>
Installed once on your computer, ConceptDraw DIAGRAM will be always at hand with useful drawing tools, templates and samples, numerous libraries of Rapid UML Solution for designing:

Example 2. Online Diagram Tool - ConceptDraw STORE
In addition to ConceptDraw DIAGRAM is offered one more useful online diagram tool - ConceptDraw STORE that lets you the possibility to navigate through solutions of ConceptDraw Solution Park, access libraries, templates and samples, and also manage downloads and updates.

Example 3. UML Use Case Diagram - Project Administrator
This example was created in ConceptDraw DIAGRAM using the vector objects from the UML Use Case library of Rapid UML Solution and shows the UML Use Case Diagram with actors, use cases and dependencies between them. An experienced user spent 10 minutes creating this sample using the online diagram tool.
Use the Rapid UML solution to create your own UML diagrams of any type quick, easy and effective.
All source documents are vector graphic documents. They are available for reviewing, modifying, or converting to a variety of formats (PDF file, MS PowerPoint, MS Visio, and many other graphic formats) from the ConceptDraw STORE. The Rapid UML Solution is available for all ConceptDraw DIAGRAM or later users.
TEN RELATED HOW TO's:
Interactive tool helps you find the appropriate response to social media mentions quickly.
Picture: How to Use the ″Online Store PR Campaign″ Sample
Related Solution:
When you are a beginner in software development, you make a lot of mistakes. Developing logical models, or data flow diagrams is a way to see the the whole project and all the processes clearly. And some novices, unfortunately for them, miss modeling stage at the beginning of project life cycle, and get into troubles as the project grows.
This image represents the data flow diagram applying symbols of Yourdon and Coad notation. This DFD depicts the data flow inside an organization department deals with receivables. The icons of standard Yourdon and Coad notation provides possibility to draw professional looking and well- readable DFD for business documentation. This data flow diagram was designed with the help of ConceptDraw DIAGRAM and its Data Flow Diagrams solution. The solution delivers three vector graphic libraries including elements of Yourdon and Coad and Gane-Sarson notations.
Picture: Data Flow Diagram Process
Related Solution:
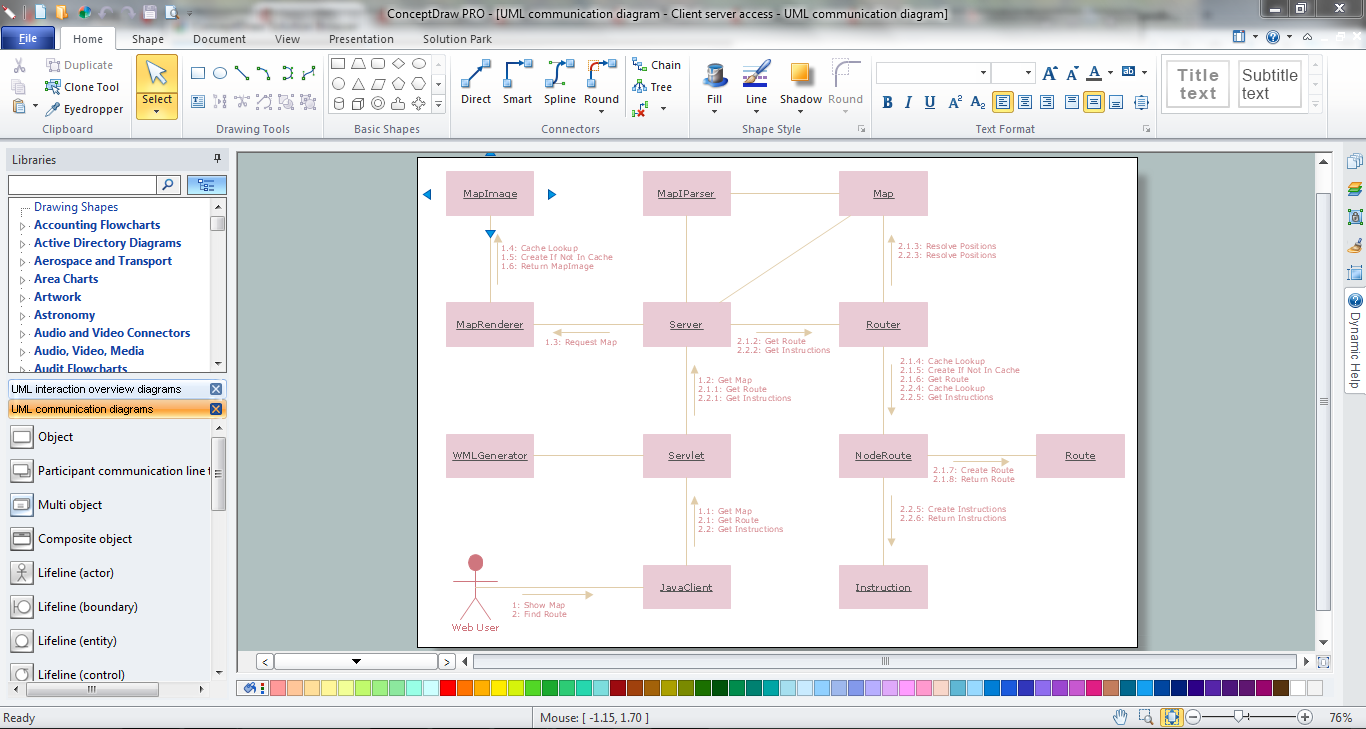
UML Communication Diagram depicts the interactions between objects or parts in terms of sequenced messages and describes both the static structure and dynamic behavior of a system.
Picture: Diagramming Software for Design UML Communication Diagrams
What Is a Circle Spoke Diagram? It is a diagram which has a central item surrounded by other items in a circle. The Circle Spoke Diagrams are often used to show the features or components of the central item in marketing and management documents and presentations. ConceptDraw DIAGRAM extended with Business Diagrams Solution from the Management Area is the best software for creating Circle-Spoke Diagrams.
Picture: What Is a Circle Spoke Diagram
Related Solution:
Working with information can be quite tedious, furthermore, some data can be quite difficult to perceive without any graphic representation. So, to facilitate your work, you can use business diagrams, such as simple flowcharts or Gantt charts for project management and orgcharts for clarifying your company structure. You can use a proper software, like ConceptDraw Pro, draw them on paper, or use whiteboards, but it is more convenient to use a digital tool.
This diagram shows a cross-functional flowchart that was made fore telecom service provider. A workflow of a common telecommunication service provider has a rather branched structure. Thus, it is useful to have a flow chart to visualize the sequences and interrelations of the work flow steps. Business process flowchart contains 17 processes and 4 decision points,that are distributed through 2 lines depicting the participants involved. Also there are connectors that show the data flow within processes. This flowchart displays a detailed model of the telecom service trading process, as well as all participants in the process and how they interact with each other.
Picture: Business diagrams & Org Charts with ConceptDraw DIAGRAM
Download ConceptDraw diagram software for easy drawing.
Picture: The Best Choice for Creating Diagram
Related Solution:
ConceptDraw the easy flowchart software that gives users the ability to draw any type of flowcharts. Fast visualization of the structured data with the vector stencils from object libraries by using RapidDraw technology.
Picture: Easy Flowchart Software
Related Solution:
Mathematical Drawing Software - Draw mathematical illustration diagrams easily from examples and templates!
Picture: Basic Diagramming
Related Solution:
The Entity-Relationship Diagram (ERD) solution from ConceptDraw Solution Park extends ConceptDraw DIAGRAM vector graphics and diagramming software with the ability to describe a database using the Entity-Relationship (Chen) model. Use it for design your ERDs and verify that ConceptDraw DIAGRAM offers the best ERD diagrams software tools for design element Chen notation._Win_Mac.png)
Picture: Entity Relationship Diagram - ERD - Software for Design Chen ER Diagrams
Related Solution:
UML Composite Structure Diagram shows the internal structure of a class and the possible interactions at this structure.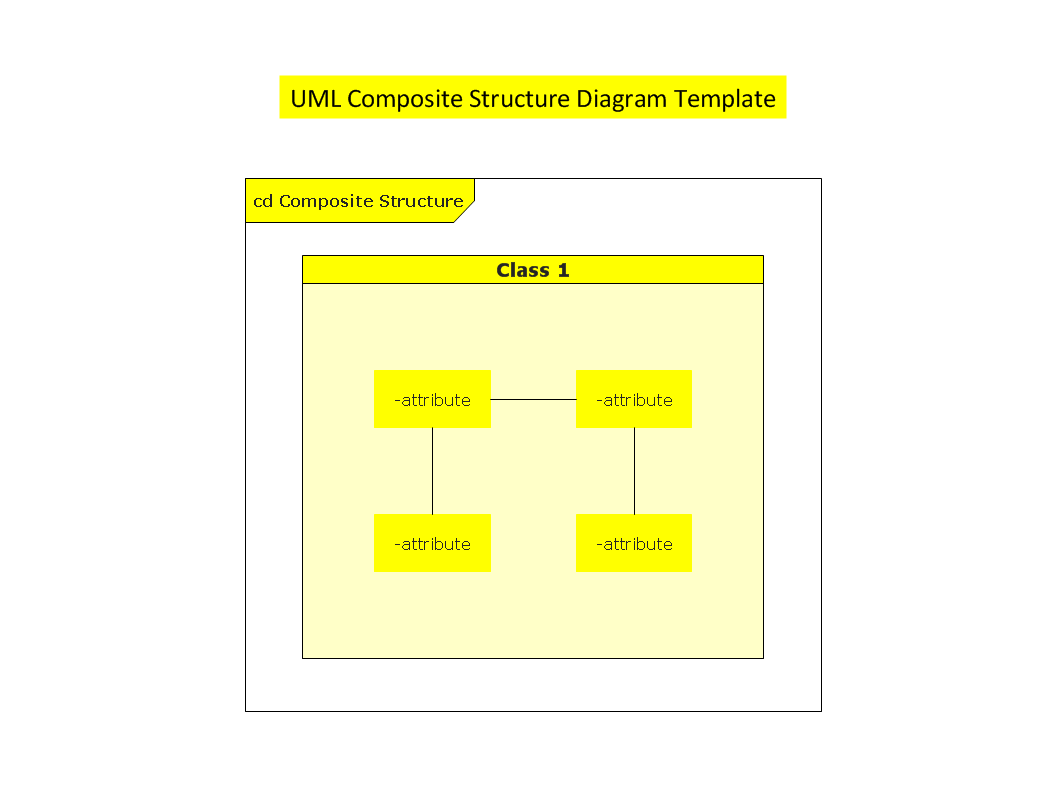
Picture: UML Composite Structure Diagram

