Finite State Machine
A finite-state machine can be known as “FSM, “finite-state automaton” (or “FSA”), “finite automaton” or a “state machine”. It is simply a mathematical model of computation, being an abstract machine in exactly one of a finite number of so called “states” at any time. The finite-state machine can change from one state to another. It is usually done in response to some external inputs. The so called “transition” is simply the change from one state to another. Any “FSM” can be defined by a list of its states as well as by its initial state and the conditions for each of the transitions.
The behaviour of each of the state machines can be observed in many devices. In modern society it can perform a predetermined sequence of actions, which depends on a sequence of events they are presented with. As an example, the vending machines can be mentioned. They simply dispense the products when the proper combination of coins is deposited. Another example can be elevators, whose sequence of stops is usually determined by the floors requested by its riders. The traffic lights are also a good example for the state machine as they change sequence when the cars are waiting on the road. The well-known combination locks are also the finite state machines, requiring the input of combination numbers, which all have to be input in the proper, definite order.
The finite state machines are studied in the more general field of “automata theory” knowing to be having less computational power to compare it to some other models of computation (for example, the “Turing machine”). The so called “computational power distinction” means there are some computational tasks which a “Turing machine” can do but a “FSM” cannot. The reason for this is because a finite state machine's memory is limited by the number of the states it already has.
A term “state” is a description of the status of a system, waiting for executing a so called “transition”, known to be a set of actions executed once a condition is fulfilled. Sometimes it can also be executed when an event is received. As an example: while using some audio system for listening to the radio, the receiving of the "next" stimulus results in moving to the next station. In this mentioned case the system is known to be in the so called "radio" state. Once the system is in the so called "CD" state, then the "next" stimulus ends in moving to the very next track. The identical stimuli trigger different the actions, which depends on the state taking place at the very this moment.
Sometimes, in some of the representations of the finite-state machines, the actions can be simply associated with a state. The so called “entry action” is known to be performing while entering the state and an “exit action” is performed while exiting the state.
The Unified Modelling Language has a notation for describing state machines, overcoming the limitations of traditional “finite state machines” during retaining their most main benefits as well as introducing the new concepts of orthogonal regions and hierarchically nested states. At the same time the notion of “actions” is being extended. To understand what exactly the term of “actions” means, we have to mention that once the so called “event instance” is dispatched, the state machine responds by these so called “performing actions”, which can be involved in changing a variable, invoking a function, generating some other event instance, changing to another state or performing I/O.
In the so called “extended state machines”, a transition can have a “guard”, meaning that the transition can "fire" only in case the guard evaluates to “TRUE”.
A state is known to be having many transitions in response to the same trigger, but there’s always a chance that this situation can create even more problems in the sequence of evaluation of the guards once the common trigger occurs. The “UML specification” intentionally does not stipulate any particular order, meaning that the guard expressions should have no side effects left.
UML state machines are popular for having the characteristics of “Moore machines” as well as “Mealy” ones. They are known to be supporting actions, depending on the so called “triggering event” and “the state of the system” as in Mealy machines. They also support the “entry” and “exit” actions, associated with states, not transitions (as in Moore machines).
Thus, the finite state machines are significant in many different areas, being subdivided into acceptors, transducers, sequencers and classifiers. They are being widely used in such fields of business activities, as linguistics, computer science, electrical engineering, philosophy, mathematics, logic, biology, etc. They are a class of automata studied in so called “automata theory” as well as the “theory of computation”. Finite state machines are used in computer science for modelling of application behaviour, software engineering, designing of hardware digital systems, network protocols, compilers as well as the study of languages and computation.
Once you need to create a Finite State Machine (FSM) diagram, one of the best tools may be ConceptDraw DIAGRAM diagramming and drawing software extended with ConceptDraw STORE application, where all the pre-made solutions full of the examples and templates as well as stencil libraries are. You can always download ConceptDraw DIAGRAM software as well as ConceptDraw STORE application, find the “Specification and Description Language (SDL) Solution” from the last mentioned product of CS Odessa to be able to create any needed diagrams within the Description Language field of business activity, including the finite state machine’s ones, within only an hour or so having all the needed tools, such as design elements of SDL Connectors from the stencil library and the pre-made templates of the SDL Diagrams which can be always used as drafts for your own smart as well as professionally looking drawings.
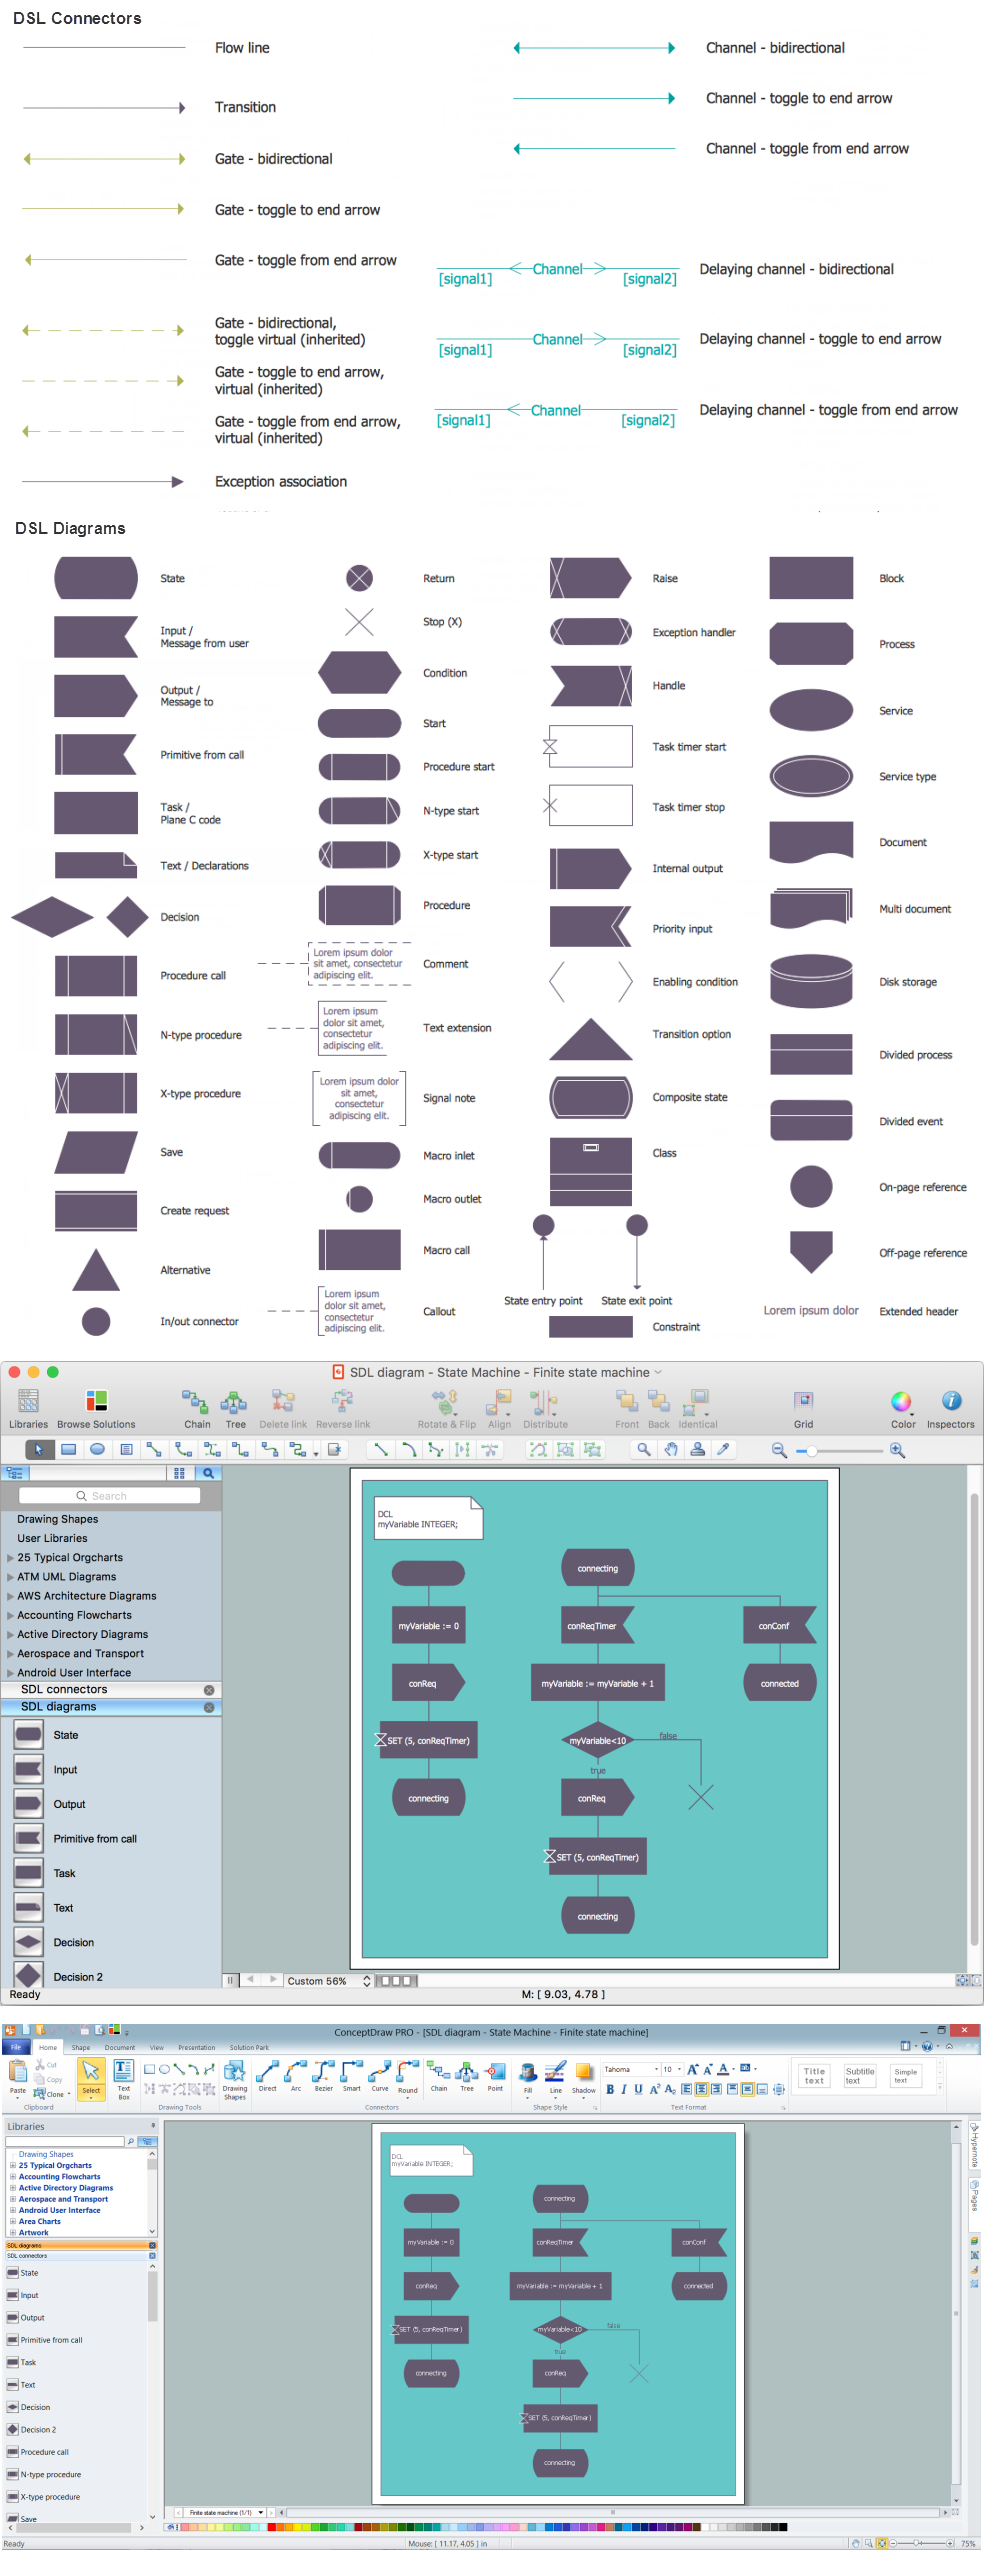
Example 1. Design Elements. Finite State Machine Diagram for Apple OS X and Windows
To design the Finite State Machine Diagram from the beginning in new ConceptDraw document, use the predesigned connectors and SDL design elements offered in quantity of 71 objects by 2 libraries of Specification and Description Language (SDL) Solution. The predesigned vector objects give the possibility easily draw any FSM Diagrams you want.
Thanks to the Specification and Description Language (SDL) Solution we also have a variety of SDL and FSM diagrams samples in ConceptDraw STORE. Each of them can be opened in ConceptDraw DIAGRAM and used as is or changed according to your needs.
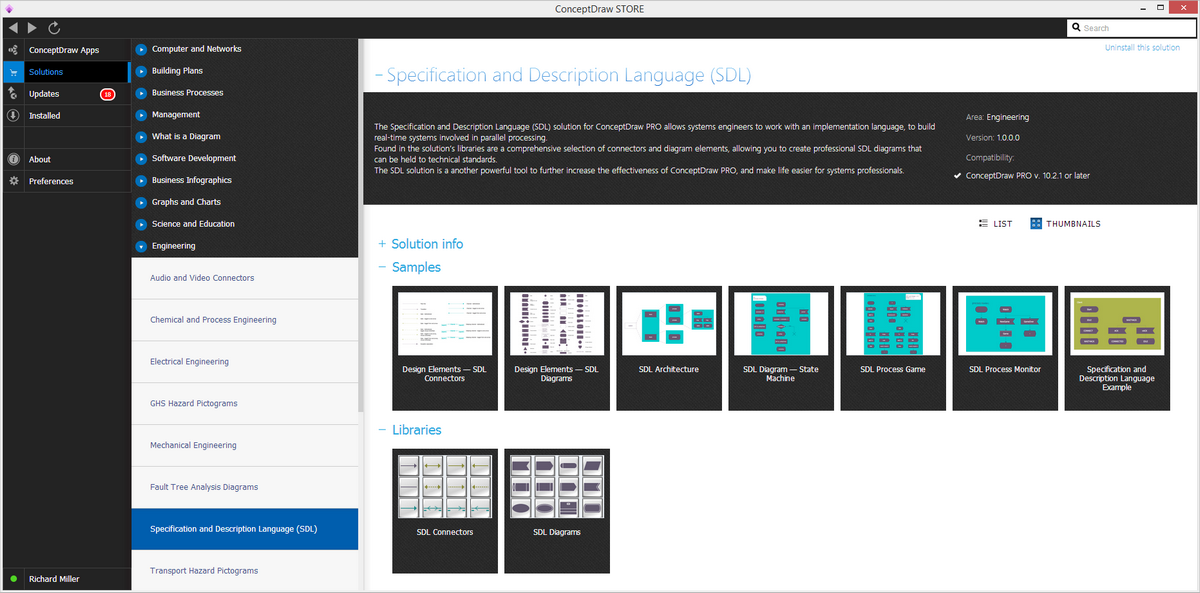
Example 2. Specification and Description Language (SDL) Solution in ConceptDraw STORE
The Finite State Machine diagram you see on this page was created in ConceptDraw DIAGRAM software using the objects from the libraries of Specification and Description Language (SDL) Solution. An experienced user spent 25 minutes creating this sample in ConceptDraw DIAGRAM
Use the Specification and Description Language (SDL) Solution for ConceptDraw DIAGRAM software to create your own professional looking SDL and FSM diagrams quick, easy and effective.
All source documents are vector graphic documents. They are available for reviewing, modifying, or converting to a variety of formats (PDF file, MS PowerPoint, MS Visio, and many other graphic formats) from the ConceptDraw STORE. The Specification and Description Language (SDL) Solution is available for all ConceptDraw DIAGRAM users.