The Best Business Process Modeling Software: Comprehensive Guide
Business Process Modeling Notation (BPMN) is a graphical language used to model business processes and workflows within an organization. It is a global standard of business process management that provides a set of symbols and notations to show the sequence of steps or business activities and information flows needed to complete a process. BPMN provides clear visualization and documentation based on a flowcharting technique. Its semantics allows representing both simple and complex processes being at the same time clear for all stakeholders.
Business Process Modeling Notation is a powerful tool that facilitates communication between technical and non-technical business users including technical developers, business analysts, business managers, and others. Clear and standardized diagrams improve communication and collaboration, help to analyze and optimize the business processes, reduce waste and eliminate inefficiencies to improve the efficiency of the processes and boost productivity, mitigate potential risks, make informed decisions, enhance strategic planning and problem-solving, and gain a competitive advantage in the ever-changed market.
Key BPMN Elements
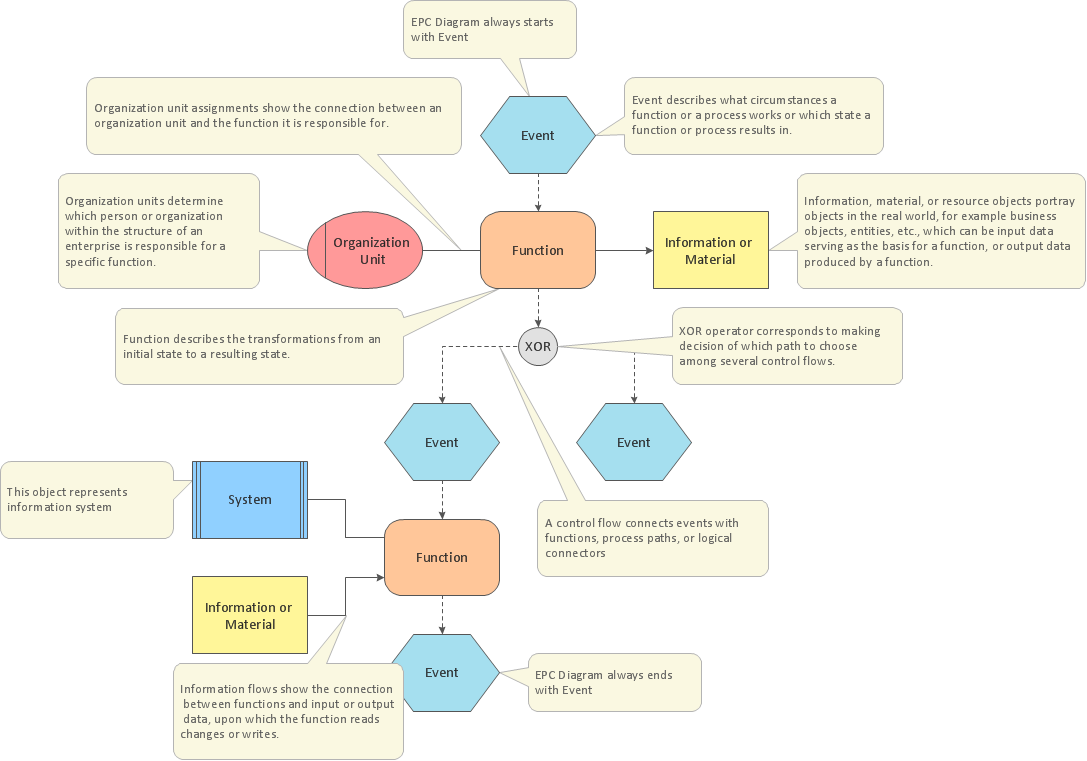
The key Business Process Modeling Notation (BPMN) elements include the following:
- Flow objects — symbols that represent elements in a business process and help to model processes.
- Events are key elements depicted as circles with certain symbols inside and representing occurrences or states within a business process. They serve as a trigger — a starting point, intermediate step, or end point of a process. These include message, timer, error, link, compensation, signal, cancel, and others.
- Activities are represented by rounded rectangles and show tasks or work performed within the process. They can be both simple tasks or complex with subprocesses, loops, compensations, etc.
- Gateways are shown as diamond shapes and serve decision points in the process flow based on conditions or events.
- Connecting objects — elements that illustrate the relationships, connections, flow steps, and dependencies between different components within a business process.
- Sequence flow uses a straight line with an arrow at the end and shows the order of activities to be performed.
- Message flow is represented by a dashed line with a circle and an arrow at the ends and depicts communication between different participants or processes, messages that flow across “pools”.
- Conditional flow is shown by a straight line with a diamond and an arrow at the ends and represents a flow in the process taken based on a specific condition or decision.
- Default flow is represented by a straight line with a stroke at the beginning and an arrow at the end, and is the branch chosen if all other conditions are false.
- Association is a dotted line that associates an artifact or text to an event, activity, or gateway.
- Swimlanes — elements used to organize the process into different roles or participants using pools (high-level entities like departments, organizations, etc.) and lanes (major stakeholders, roles or actors in a business process).
- Artifacts — elements that represent the additional information about a step or part of the process useful to make the diagram more detailed.
- Data objects indicate the data necessary or produced during a step of the business process and show how data is passed along or created.
- Group shows a logical grouping of activities and doesn’t change the diagram’s flow or direction of the steps necessary to follow.
- Annotation provides additional explanation to a part of the diagram if it is complex.
- Choreographies — elements focused on the communication and coordination between different entities, a way to model the interactions and collaborations between several participants or entities in a business process.

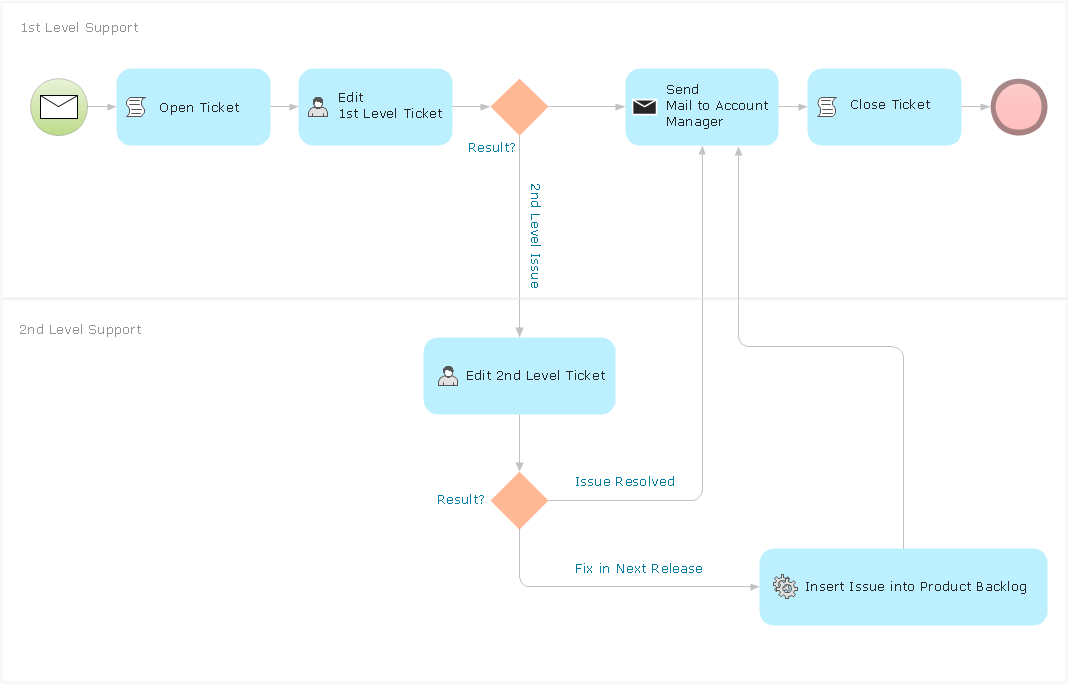
Example 1. Collaboration BPMN 2.0 Diagram — Application Handling And Invoicing
Application of Business Process Modeling
Business Process Modeling plays a crucial role across diverse industries. It helps organizations streamline operations, align processes with strategic goals, analyze workflows, identify inefficiencies, make better decisions, and improve overall efficiency and performance. It is successfully applied in the following fields:
| Field | Role of BPM |
|---|---|
| Manufacturing | Helps to model and optimize production lines, manage inventory, order fulfillment, control quality, identify bottlenecks, enhance resource utilization, reduce waste, minimize downtime, and improve supply chain management. |
| Finance | Helps to streamline transaction processing and customer service, manage risks, ensure regulatory compliance, and automate some financial operations. |
| Healthcare | Helps to improve service delivery and operational efficiency, streamline patient care workflows like patient intake, diagnosis, treatment, billing, and others, reduce errors, increase patient satisfaction, and ensure compliance with regulatory standards. |
| Telecommunications | Helps to optimize workflows and improve service delivery, troubleshooting, technical support, network management, and billing processes, reduce costs, and enhance customer satisfaction. |
| Logistics and Transportation | Helps to streamline supply chain operations through optimization of route and delivery processes, reducing delay, managing fleet maintenance, improving delivery timelines, and saving costs. |
| Sales | Helps to model supply chain processes, sales workflows, stock management, and customer interactions, improve customer experience, and reduce operational costs. |
| Government and Public Sector | Helps to improve transparency and efficiency of administrative processes, streamline tax collections, permit approvals, and citizen engagement, enhance service delivery, and ensure compliance with policies. |
Importance of Business Process Modeling for Business Success
Business Process Modeling (BPM) is significant for the success of any business. It provides a wide variety of benefits and opportunities, which help improve your business and maintain an edge in the marketplace.
Business models give a comprehensive view of essential business functions and help companies optimize and improve the effectiveness of the workflows, identify opportunities for enhancement, target bottlenecks and inefficiencies, save time and resources, and drive the organization's growth.
Business Process Modeling is so important because:
- Enhances process understanding and clarity
- Streamlines and optimizes business operations
- Reduces costs
- Improves efficiency
- Supports decision making
- Enhances communication and collaboration
- Drives innovations and continuous improvement
- Enables better strategic planning and problem-solving
- Provides data-driven insights for better decision-making
- Facilitates compliance and risk management
- Supports automation and digital transformation
- Boosts employee engagement and empowerment
- Aligns operations with new business strategy
- Supports compliance and risk management
- Increases control and consistency
- Helps to gain a competitive advantage
- Encourages a customer-centric approach
- Provides a valuable resource for knowledge management and training
- Allows measurement of the process improvements impact
- Supports meeting regulatory requirements
How Business Process Modeling Software Enhances Efficiency
Business Process Modeling is a critical tool for managers and analysts to ensure that the business processes are optimized and running accurately. Business process modeling software is a key assistant that helps to achieve this task as simply as possible.
The professional business process design software is intended to enhance efficiency, performance, and ensure the company's competitiveness at the market due to the powerful business process modeling tools that facilitate the visualization process, as well as improve optimization, collaboration, and automation of processes. As a result, it enables organizations to stay competitive and responsive to changing needs, work faster, smarter, and cohesively, with greater consistency and productivity, make data-driven decisions, drive innovations and ensure compliance regulations.
Business process modeling software helps to:
- Create accurate visual representations of complex business processes.
- Model processes efficiently before implementing them.
- Streamline workflow design.
- Understand and analyze processes.
- Identify areas for improvement and optimization workflows.
- Enhance collaboration and communication on process improvements due to common business modeling notation.
- Design flexible and scalable processes.
- Create clear documentation.
- Minimize errors in process design.
- Increase productivity and reduce the time.
- Spot needed improvements easily.
- Exchange of process improvement ideas.
- Reduce redundancies and optimize resource use.
- Identify and mitigate risks.
- Standardize processes across teams and departments, ensuring consistency and improving quality control.
- Detect and highlight process bottlenecks, redundant tasks, delays, resource constraints, and other inefficiencies to eliminate them and improve workflows.
- Automate routine and repetitive tasks assisting businesses in increasing throughput and improving consistency across operations.
- Facilitate monitoring of performance metrics, analysis of business processes, and tracking process changes over time.
- Ensure compliance with industry regulations and standards.
- Optimize critical processes to improve operational efficiency.

Example 2. Business Process Diagram Solution
Benefits of ConceptDraw DIAGRAM in Business Processes Modeling
ConceptDraw DIAGRAM is the best software BPMN for business process modeling and graphical documenting of the company's workflows. The Business Process Diagram solution contains predesigned libraries and templates based on the BPMN 2.0 standard that allows the creation of both simple and complex (nested) models of processes. These process diagrams can be printed or converted to a web page, PDF document, PowerPoint presentation, or graphical formats, and shared with other team members.
ConceptDraw DIAGRAM BPMN modeling software provides BPMN diagram examples and powerful tools for BPMN, which are efficient for clear visualization, simple understanding, and analysis of business processes. It helps to increase the productivity and competitiveness of the businesses and provide better resource utilization. ConceptDraw DIAGRAM facilitates risk-free experimentation allowing to model process designs before their actual implementation and encourages the exchange of process improvement ideas.
BPMN Tools
ConceptDraw DIAGRAM is a best business processes modeling software for graphical documenting processes of the company. The Business Process Diagram solution contains pre-designed libraries and templates based on the BPMN 2.0 standard that allows to create of both simple and complex (nested) models of processes. These process diagrams can then be printed or converted to a web-page, PDF or PowerPoint presentation.
The solution provides 142 vector stencils in the 8 libraries assisting you to start using diagramming software for designing your own Business Process Diagrams and Business Process Models:
Business Process elements, symbols, icons, shapes, stencils: Swimlanes
Contains 12 objects.

Business Process elements, symbols, icons, shapes, stencils: Activities
Contains 34 objects.

Business Process elements, symbols, icons, shapes, stencils: Events
Contains 63 objects.

Business Process elements, symbols, icons, shapes, stencils: Choreographies
Contains 25 objects.

Business Process elements, symbols, icons, shapes, stencils: Expanded Objects
Contains 14 objects.

Business Process elements, symbols, icons, shapes, stencils: Gateways
Contains 8 objects.

Business Process elements, symbols, icons, shapes, stencils: Data
Contains 10 objects.

Business Process elements, symbols, icons, shapes, stencils: Conversations
Contains 11 objects.

A conversation diagram is a particular usage of and an informal description of a collaboration diagram. A conversation depicts the logical relation of message exchanges between the participants (pools) and allows the modeler to group collaboration interactions between two or more participants which together achieve a common goal.
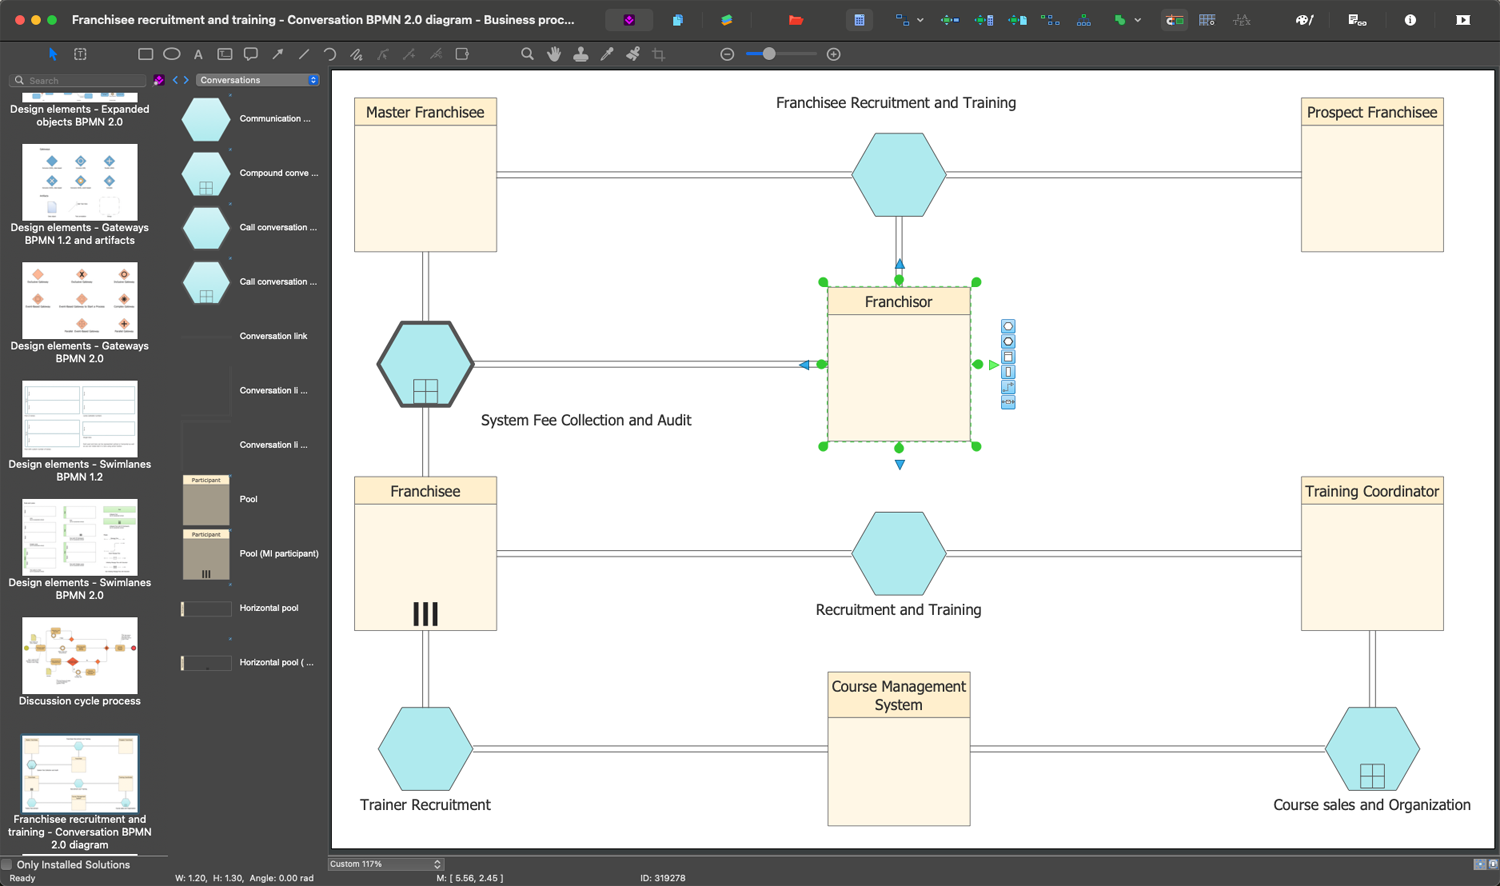
Example 3. Business Process Modeling Software — Conversation model diagram BPMN 2.0
Conclusion
Business Process Modeling Notation is a generally accepted notation that is useful as a powerful tool to model business processes, It is directed to support the generally desirable aim of all stakeholders on a project. Clear BPMN diagrams help to avoid communication gaps at any level of the business process, from its design to the implementation.
ConceptDraw DIAGRAM software with Business Process Diagram solution provides incredibly useful BPM tools to model, analyze, document, and optimize business processes. It helps all stakeholders to understand how tasks are performed and how information moves through the system, helps to identify inefficiencies, and supports automation and efficient decision-making. The user-friendly interface and integrated export tools, make ConceptDraw DIAGRAM software suitable for businesses of all sizes and specialization. Use it to design professionally looking business process models and diagrams using BPMN standards, exchange and collaborate with your colleagues, make changes, and optimize your business processes easily.