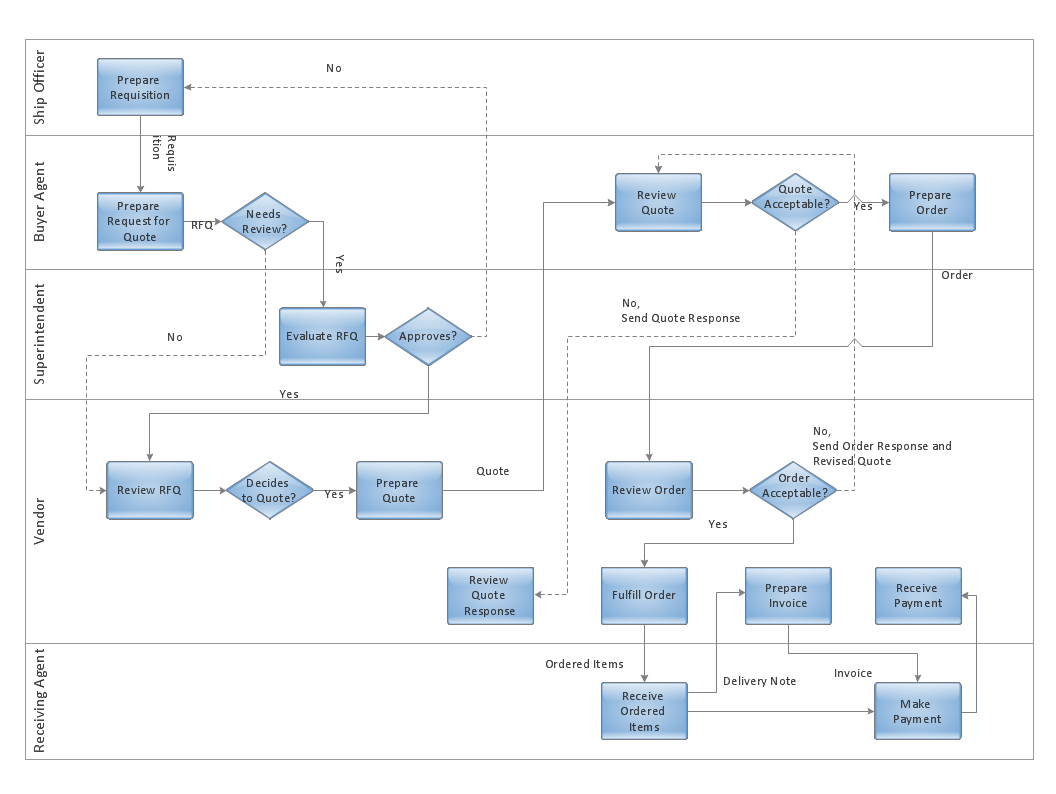
Sample 1. Cross-functional flowchart - Trading process deployment flow chart.
ConceptDraw DIAGRAM diagramming software provides vector shapes and connector tools for quick and easy drawing diagrams for business, technology, science and education.
Use ConceptDraw DIAGRAM enhanced with solutions from ConceptDraw Solution Park to create diagrams to present and explain structures, process flows, logical relationships, networks, design schemes and other visually organized information and knowledge.
TEN RELATED HOW TO's:
This sample shows the Flowchart that displays the layout and work flow of the cloud marketing platform. This diagram has a style of the marketing brochure. This style displays the central product that is related to the other issues.
Using the ready-to-use predesigned objects, samples and templates from the Flowcharts Solution for ConceptDraw DIAGRAM you can create your own professional looking Flowchart Diagrams quick and easy.
Picture: Flowchart Marketing Process. Flowchart Examples
Related Solution:
There are many tools to manage a process or to illustrate an algorithm or a workflow. Flowcharting is one of those tools. However, it may be difficult to show complex processes that require multiple attributes or several people in a simple flowchart, so a cross-functional flowchart would be a solution for that situation. To create such flowchart, group processes and steps to labeled rows or columns, and divide those groups with horizontal or vertical parallel lines. It is worth mentioning that there are different types of cross-functional flowcharts, like opportunity or deployment flowchart.
This diagram shows a cross-functional flowchart that was made for a trading process. It contains 14 processes, distributed through 5 lines depicting the participants who interact with the process. Also there are connectors that show the data flow of information between processes. The cross-functional flowchart displays a detailed model of the trading process, as well as all participants in the process and how they interact with each other. The lines in the flowchart indicates the position, department and role of the trading process participants.
Picture: Cross-Functional Flowchart
Related Solution:
ConceptDraw DIAGRAM extended with Cross-Functional Flowcharts Solution from the Business Processes Area is a powerful software which offers a variety of Cross Functional Flowchart examples. The use of predesigned examples as the base for your own Cross Functional Flowchart Diagrams is a timesaving and useful way.
Picture: Cross Functional Flowchart Examples
Related Solution:
The UML Diagrams are widely used by developers and software engineers for professionally design and development any bank system or Automated Teller Machine (ATM) system. You need a powerful software for their design? ConceptDraw DIAGRAM extended with ATM UML Diagrams Solution from the Software Development Area of ConceptDraw Solution Park suits the best for this goal.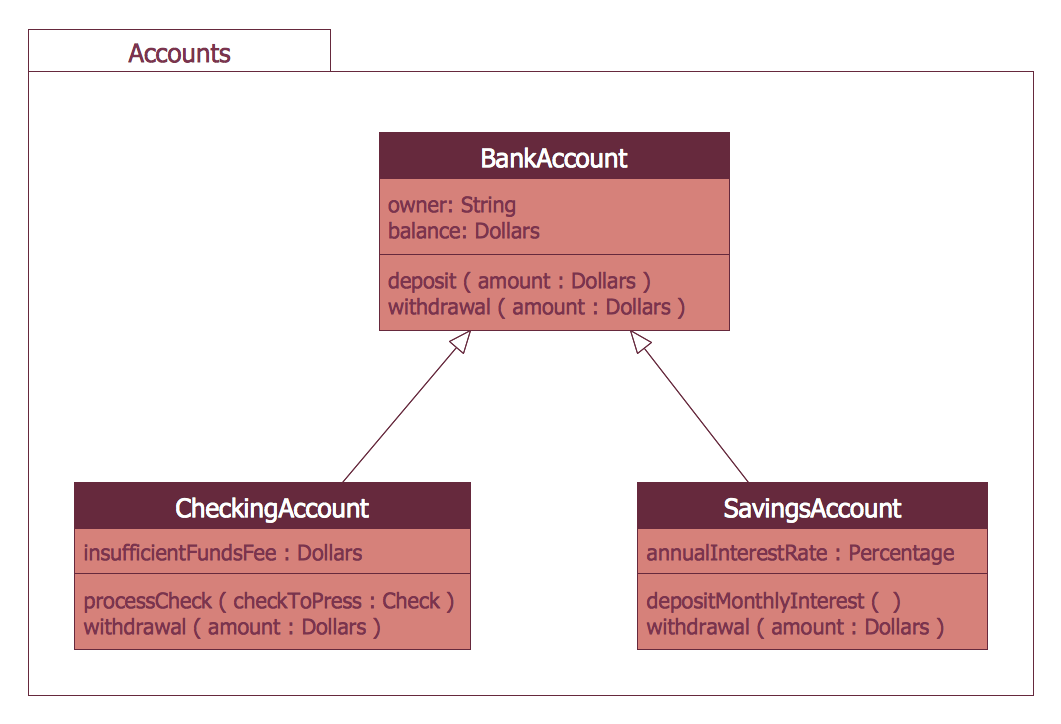
Picture: Bank System
Related Solution:
Block diagrams solution extends ConceptDraw DIAGRAM software with templates, samples and libraries of vector stencils for creating the block diagram.
Create block diagrams, electrical circuit diagrams, schematics, and more in minutes with ConceptDraw DIAGRAM.
Picture: Create Block Diagram
ConceptDraw DIAGRAM is a powerful software that helps you create professional looking cross-functional flowcharts with the well-designed objects. ConceptDraw DIAGRAM allows you to focus on work, not the drawing process. ConceptDraw Arrows10 Technology allows to draw connectors with smart behavior that gives flexibility to you during work process.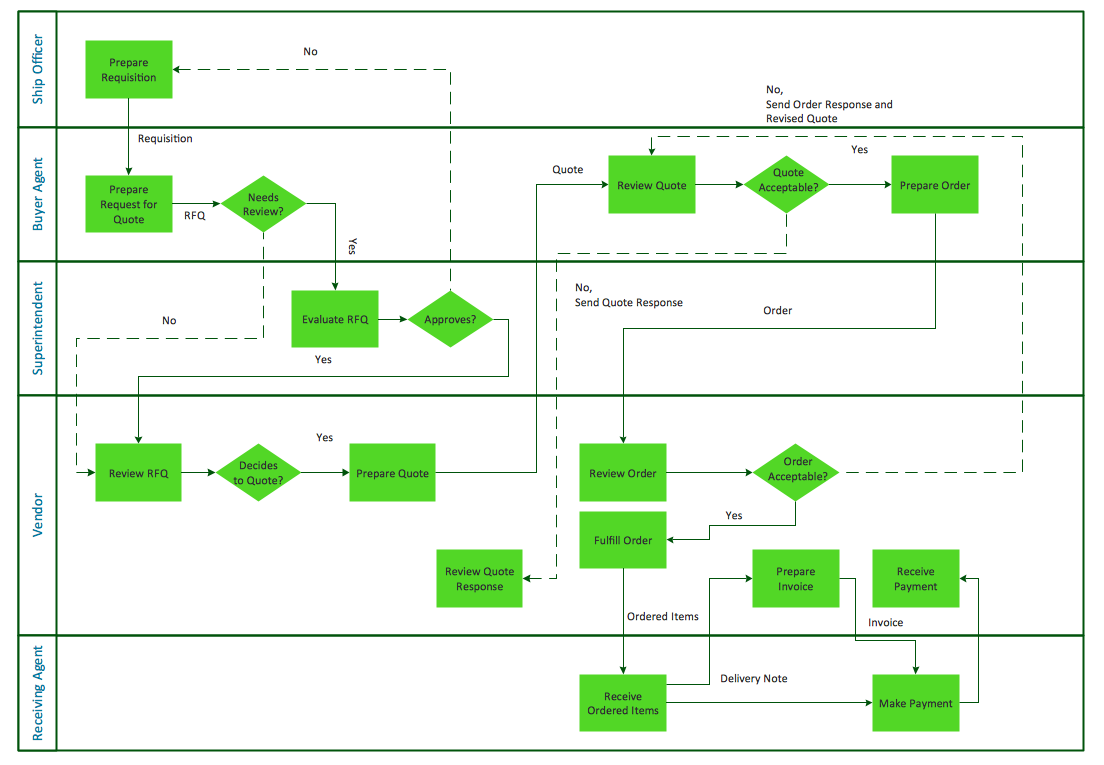
Picture: Horizontal Cross Functional Flowchart
Related Solution:
ConceptDraw DIAGRAM is a professional software for building flowcharts quickly with auto-connect technology.
Picture: Build a Flowchart Quickly With AutoConnect
Related Solution:
If you need to describe some process, diagramming is a perfect tool for almost any imaginable purpose. The set of the most commonly used flow charts symbols is quite wide and includes symbols for operations, processes, data inputs and outputs. You can see the full list of all the symbols used for flowcharting in Flowcharts solution from Diagrams area in ConceptDraw Solution Park.
A flow chart is often used for visual representation of a sequential process flow. The flowchart approach to any process is to divide it into some sequential actions. What makes a flow chart so popular and clear to make out is the set of standard flowchart symbols that has the same reading independently from processes described with their applying. The current drawing represents the vector library containing the pack of standard flowchart symbols. This library is supplied with ConceptDraw Flowcharts solution.
Picture: Flow Chart Symbols
Related Solution:
What is a Work Flow Chart? It is a chart which visually displays the step-by-step transferring of data, documents and tasks during the work. ConceptDraw DIAGRAM extended with Workflow Diagrams solution from the Business Processes area of ConceptDraw Solution Park is the best software for drawing the Work Flow Chart of any complexity.
Picture: Work Flow Chart
Related Solution:
ConceptDraw DIAGRAM is a professional diagramming and vector drawing software. Now, enhanced with SysML Solution from the Software Development Area of ConceptDraw Solution Park, ConceptDraw DIAGRAM became an ideal software for model based systems engineering (MBSE).
Picture: Model Based Systems Engineering
Related Solution: