UML Sequence Diagram Example. SVG Vectored UML Diagrams Tools
This sample was created in ConceptDraw DIAGRAM diagramming and vector drawing software using the UML Sequence Diagram library of the Rapid UML Solution from the Software Development area of ConceptDraw Solution Park.

Example 1. UML Diagrams solution
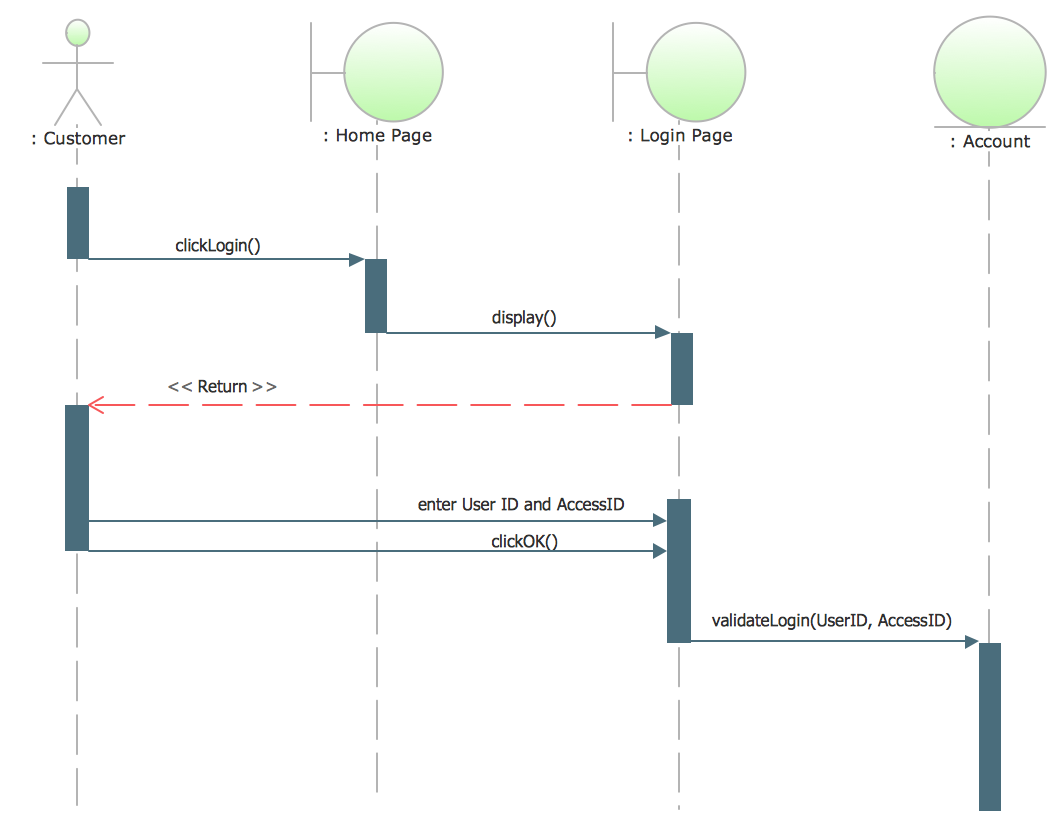
This sample shows the interactions of the customer with the system and is used at the registration on the sites.
Example 2. SVG Vectored UML Diagrams Tools
Using the libraries of the Rapid UML Solution for ConceptDraw DIAGRAM you can create your own visual vector UML diagrams quick and easy.


UML Resource:
- UML Software
- How to create a UML Diagram
- UML Diagram Examples
- Class Diagram
- Use Case Diagram
- Timing Diagram
- Interaction Overview Diagram
- Communication Diagram
- State Machine Diagram
- Activity Diagram
- Deployment Diagram
- Package Diagram
- Collaboration Diagram
- Object Diagram
- Sequence Diagram
- Composite Structure
- Component Diagram
TEN RELATED HOW TO's:
UML Use Case Diagram Taxi Service - This sample was created in ConceptDraw DIAGRAM diagramming and vector drawing software using the UML Use Case Diagram library of the Rapid UML Solution from the Software Development area of ConceptDraw Solution Park.
This sample shows the work of the taxi service and is used by taxi stations, by airports, in the tourism field and delivery service.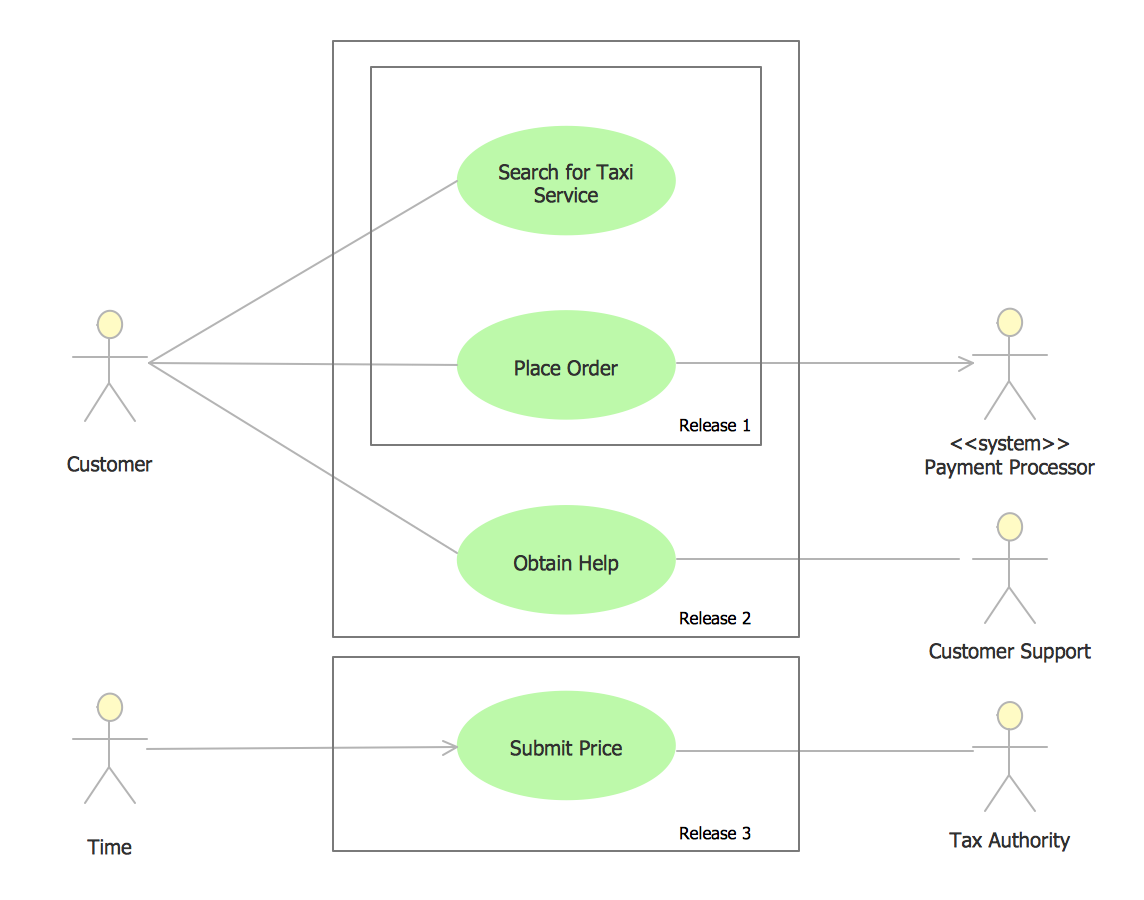
Picture: UML Use Case Diagram Example - Taxi Service
Related Solution:
UML Object Diagram shows the structure of a modeled system at a specific time.
ConceptDraw Rapid UML solution delivers libraries contain pre-designed objects fit UML notation, and ready to draw professional UML Object Diagram.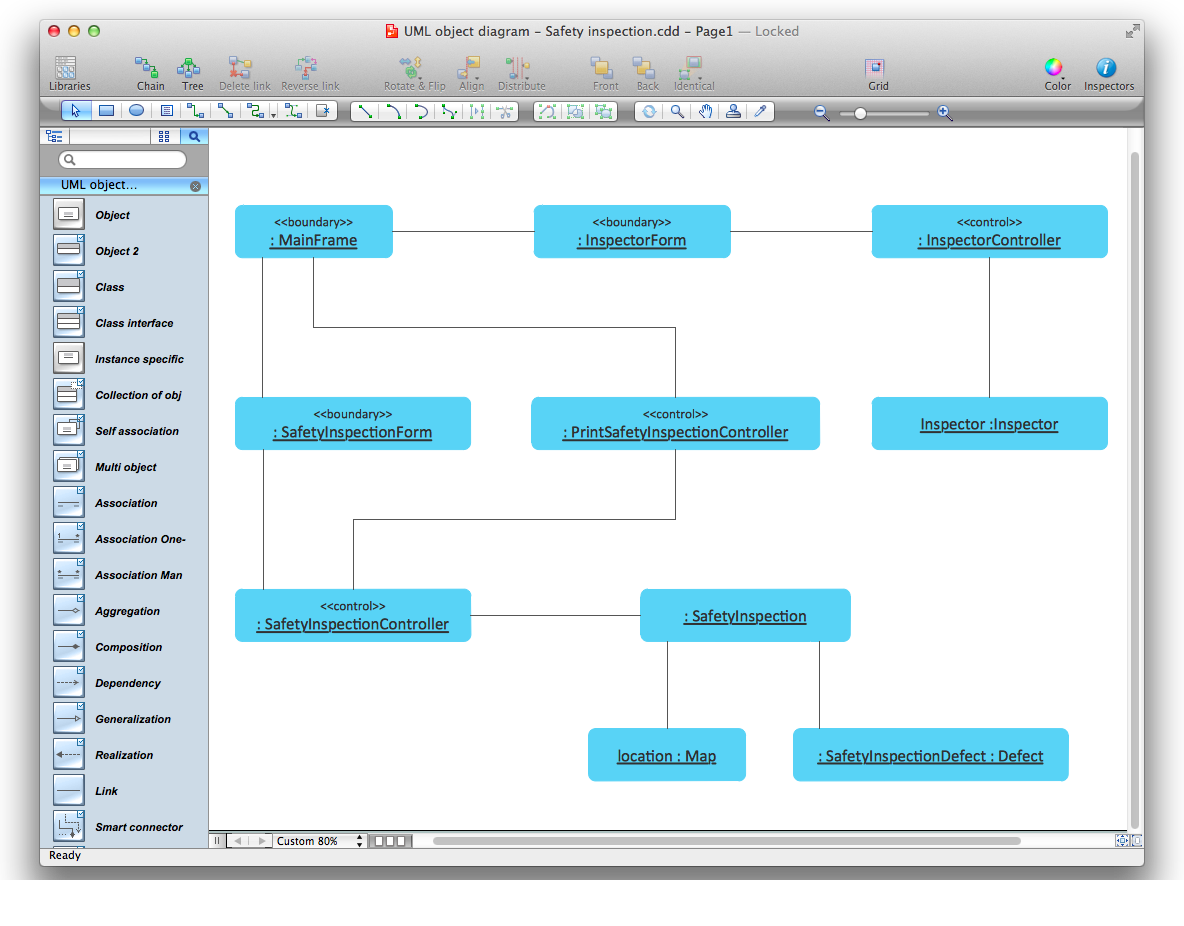
Picture: Diagramming Software for Design UML Object Diagrams
Related Solution:
ER-modeling nowadays is a very popular approach for database design. If you are tired of looking for a good entity relationship diagram Software for Mac, then your search is almost over. ConceptDraw DIAGRAM is a great tool for creating diagrams of any complexity with tons of editable samples and templates.
This diagram represents the vector library of the Chen’s and Crow’s Foot notation icons for drawing ERD (entity-relationships diagram). ConceptDraw Entity Relationship Diagram solution delivers the ability to visualize databases structure on both Mac and PC. The "bricks" entity-relationships models are the entity, and the relation. An entity is represented by a rectangle comprising the entity name. It means an object, information about which should be available and stored. A relation is intended to show a relations between two entities. There are several types of relations between entities. To show there are a number of different symbols for the types of relationships.
Picture: Entity Relationship Diagram Software for Mac
Related Solution:
In general, you can use any icons to represent network equipment on a diagram. However, there are some icons, for instance, Cisco icons, shapes, stencils and symbols, that are recognizable worldwide. Using those icons you can create Cisco network topology diagrams in minutes and share them anywhere.
The icons depicting Cisco network equipment are recognized and generally applied as standard images for designing network diagrams. They are free to used , but can not be reworked. Cisco network diagrams are created to depict how signals processed on the network equipment and end-user computers and how data transfer through LAN or WLAN between nodes. The vector graphic library of ConceptDraw CISCO Network Diagrams solution includes about 90 icons of Cisco network equipment for designing computer network diagrams with ConceptDraw DIAGRAM.
Picture: Cisco Network Topology. Cisco icons, shapes, stencils and symbols
Related Solution:
State Diagram UML of Online Store. This sample was created in ConceptDraw DIAGRAM diagramming and vector drawing software using the UML Class Diagram library of the Rapid UML Solution from the Software Development area of ConceptDraw Solution Park.
This sample shows the work of the medical shop and is used at the creation of the medical shop or pharmacy project, for understanding the process of shopping in the medical shop, for keeping purchases, for medical supplies.
Picture: UML Class Diagram Example - Medical Shop
Related Solution:
Event-Driven Process Chain Diagrams for improvement throughout an organisation.
ConceptDraw DIAGRAM - software that reduces the time needed to create a business process model.
Picture: Graphical Symbols to use in EPC diagrams
Related Solution:
This sample shows the UML Activity Diagram that describes the flow of controls in the system. This is preparation to see how the system will work when executed. Black circle indicates the start of the workflow, encircled black circle indicates the end of the workflow. This sample shows the decision of the problem and can be used when you need to solve some set of problems.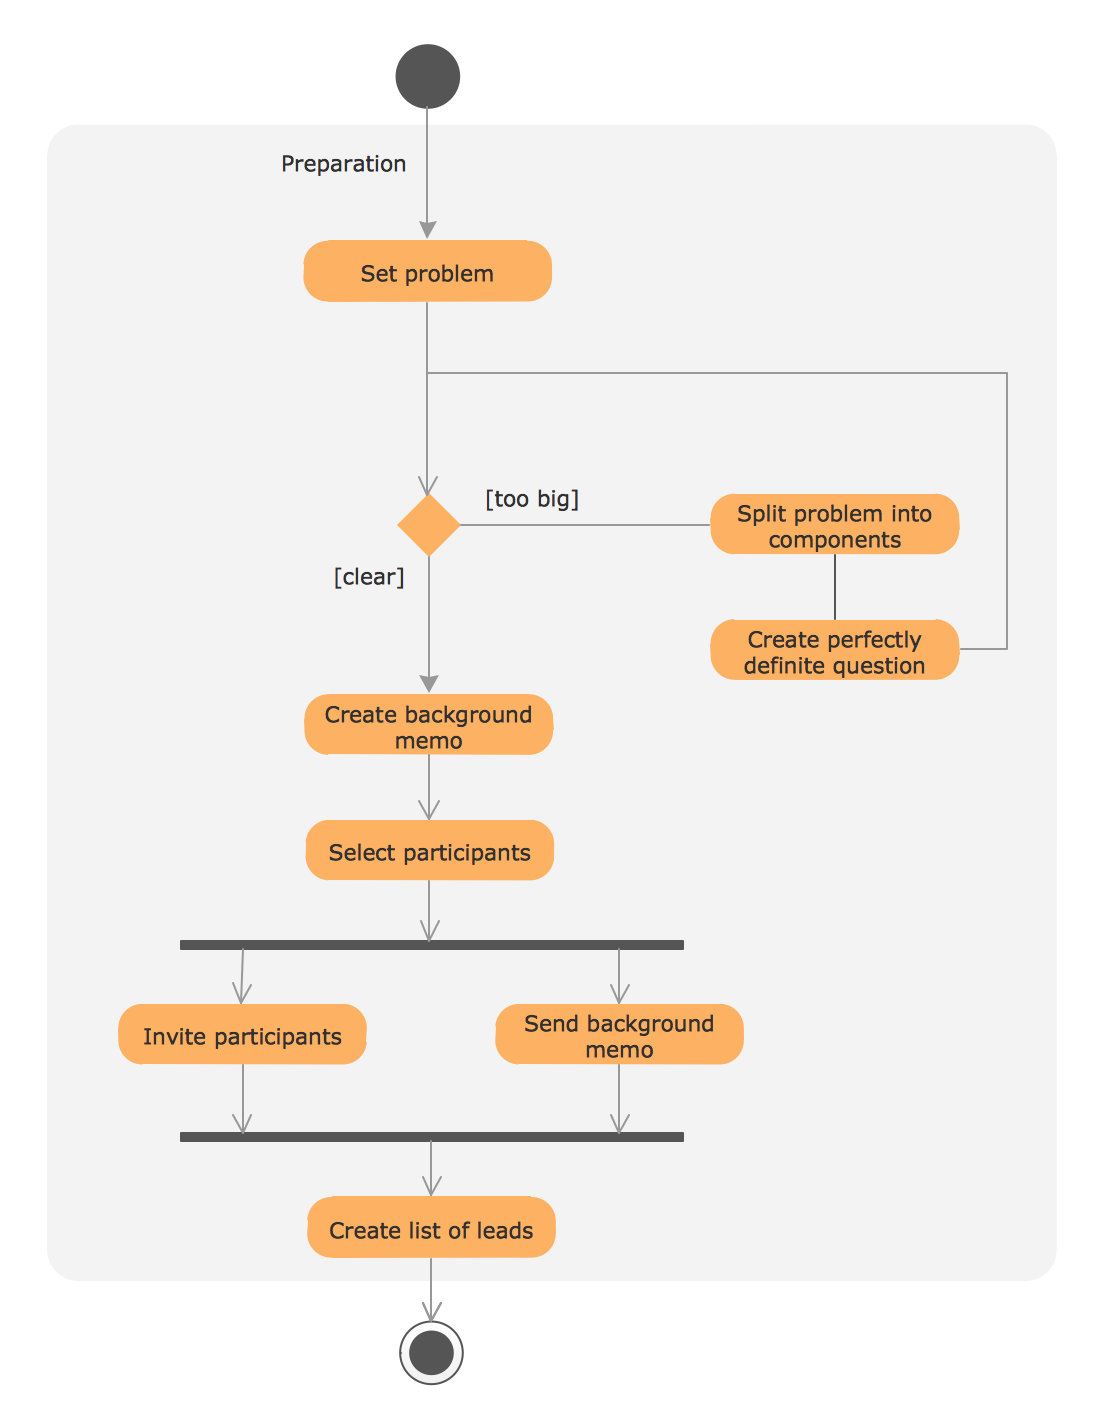
Picture: UML Process Diagram Example
Related Solution:
ConceptDraw DIAGRAM is a powerful software that helps you create professional looking cross-functional flowcharts with the well-designed objects. ConceptDraw DIAGRAM allows you to focus on work, not the drawing process. ConceptDraw Arrows10 Technology allows to draw connectors with smart behavior that gives flexibility to you during work process.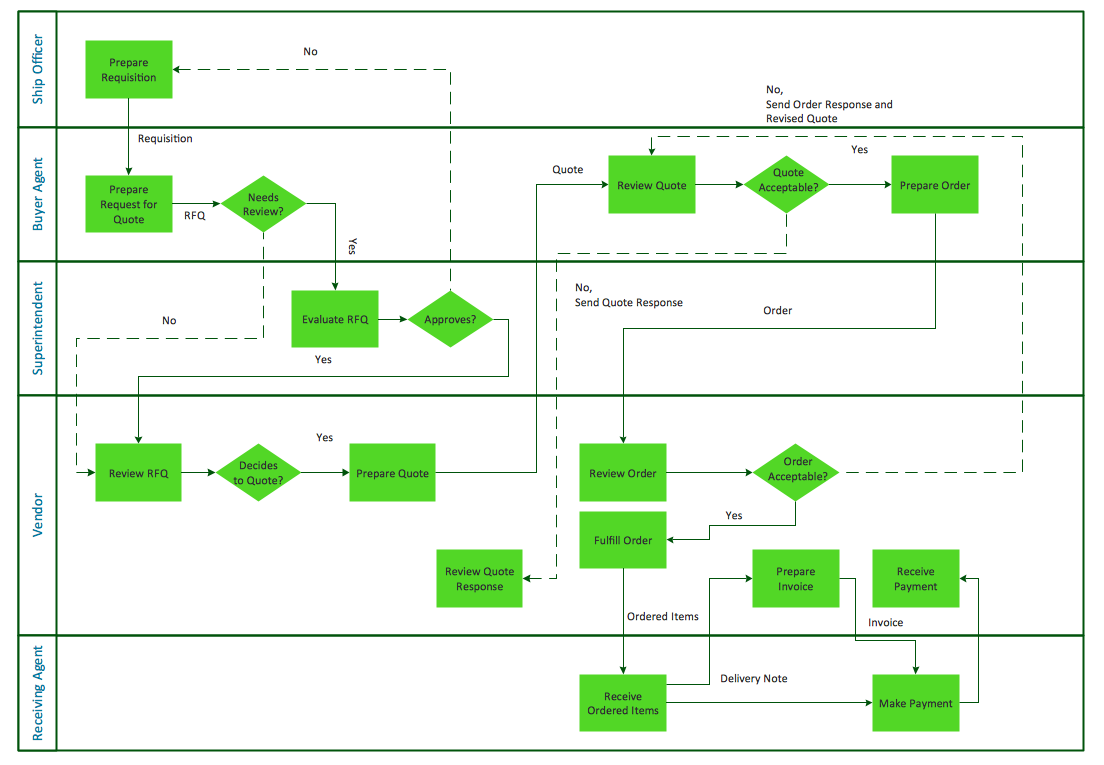
Picture: Horizontal Cross Functional Flowchart
Related Solution:
If you have a premise, or a studio and you want to start your own business, catering might be perfect for you. You can see a cafe floor plan as an example of possible usages of the free space on the floor. Obviously, you can rearrange it in any plausible way.
This cafe floor plan was created with a help of ConceptDraw solution for Cafe and Restaurant Floor Plans. Working under the design of interiors plans for cafe, commonly cause various creative and architectural issues. Primarily, cafe floor plan and interior design must be nice and at the same time comfortable for customers. Developing a floor plan and interior conception for cafe involve various elements that can be found out in the ConceptDraw Cafe and Restaurant Floor Plan solution. This sample drawing may be used as a template while proceeding to design a particular cafe. This sample plan can help to select furniture most suitable for cafe's guest rooms or cuisine. Also, this drawing may be handy as a requirements list of a furnishing and accessories necessary for the new cafe.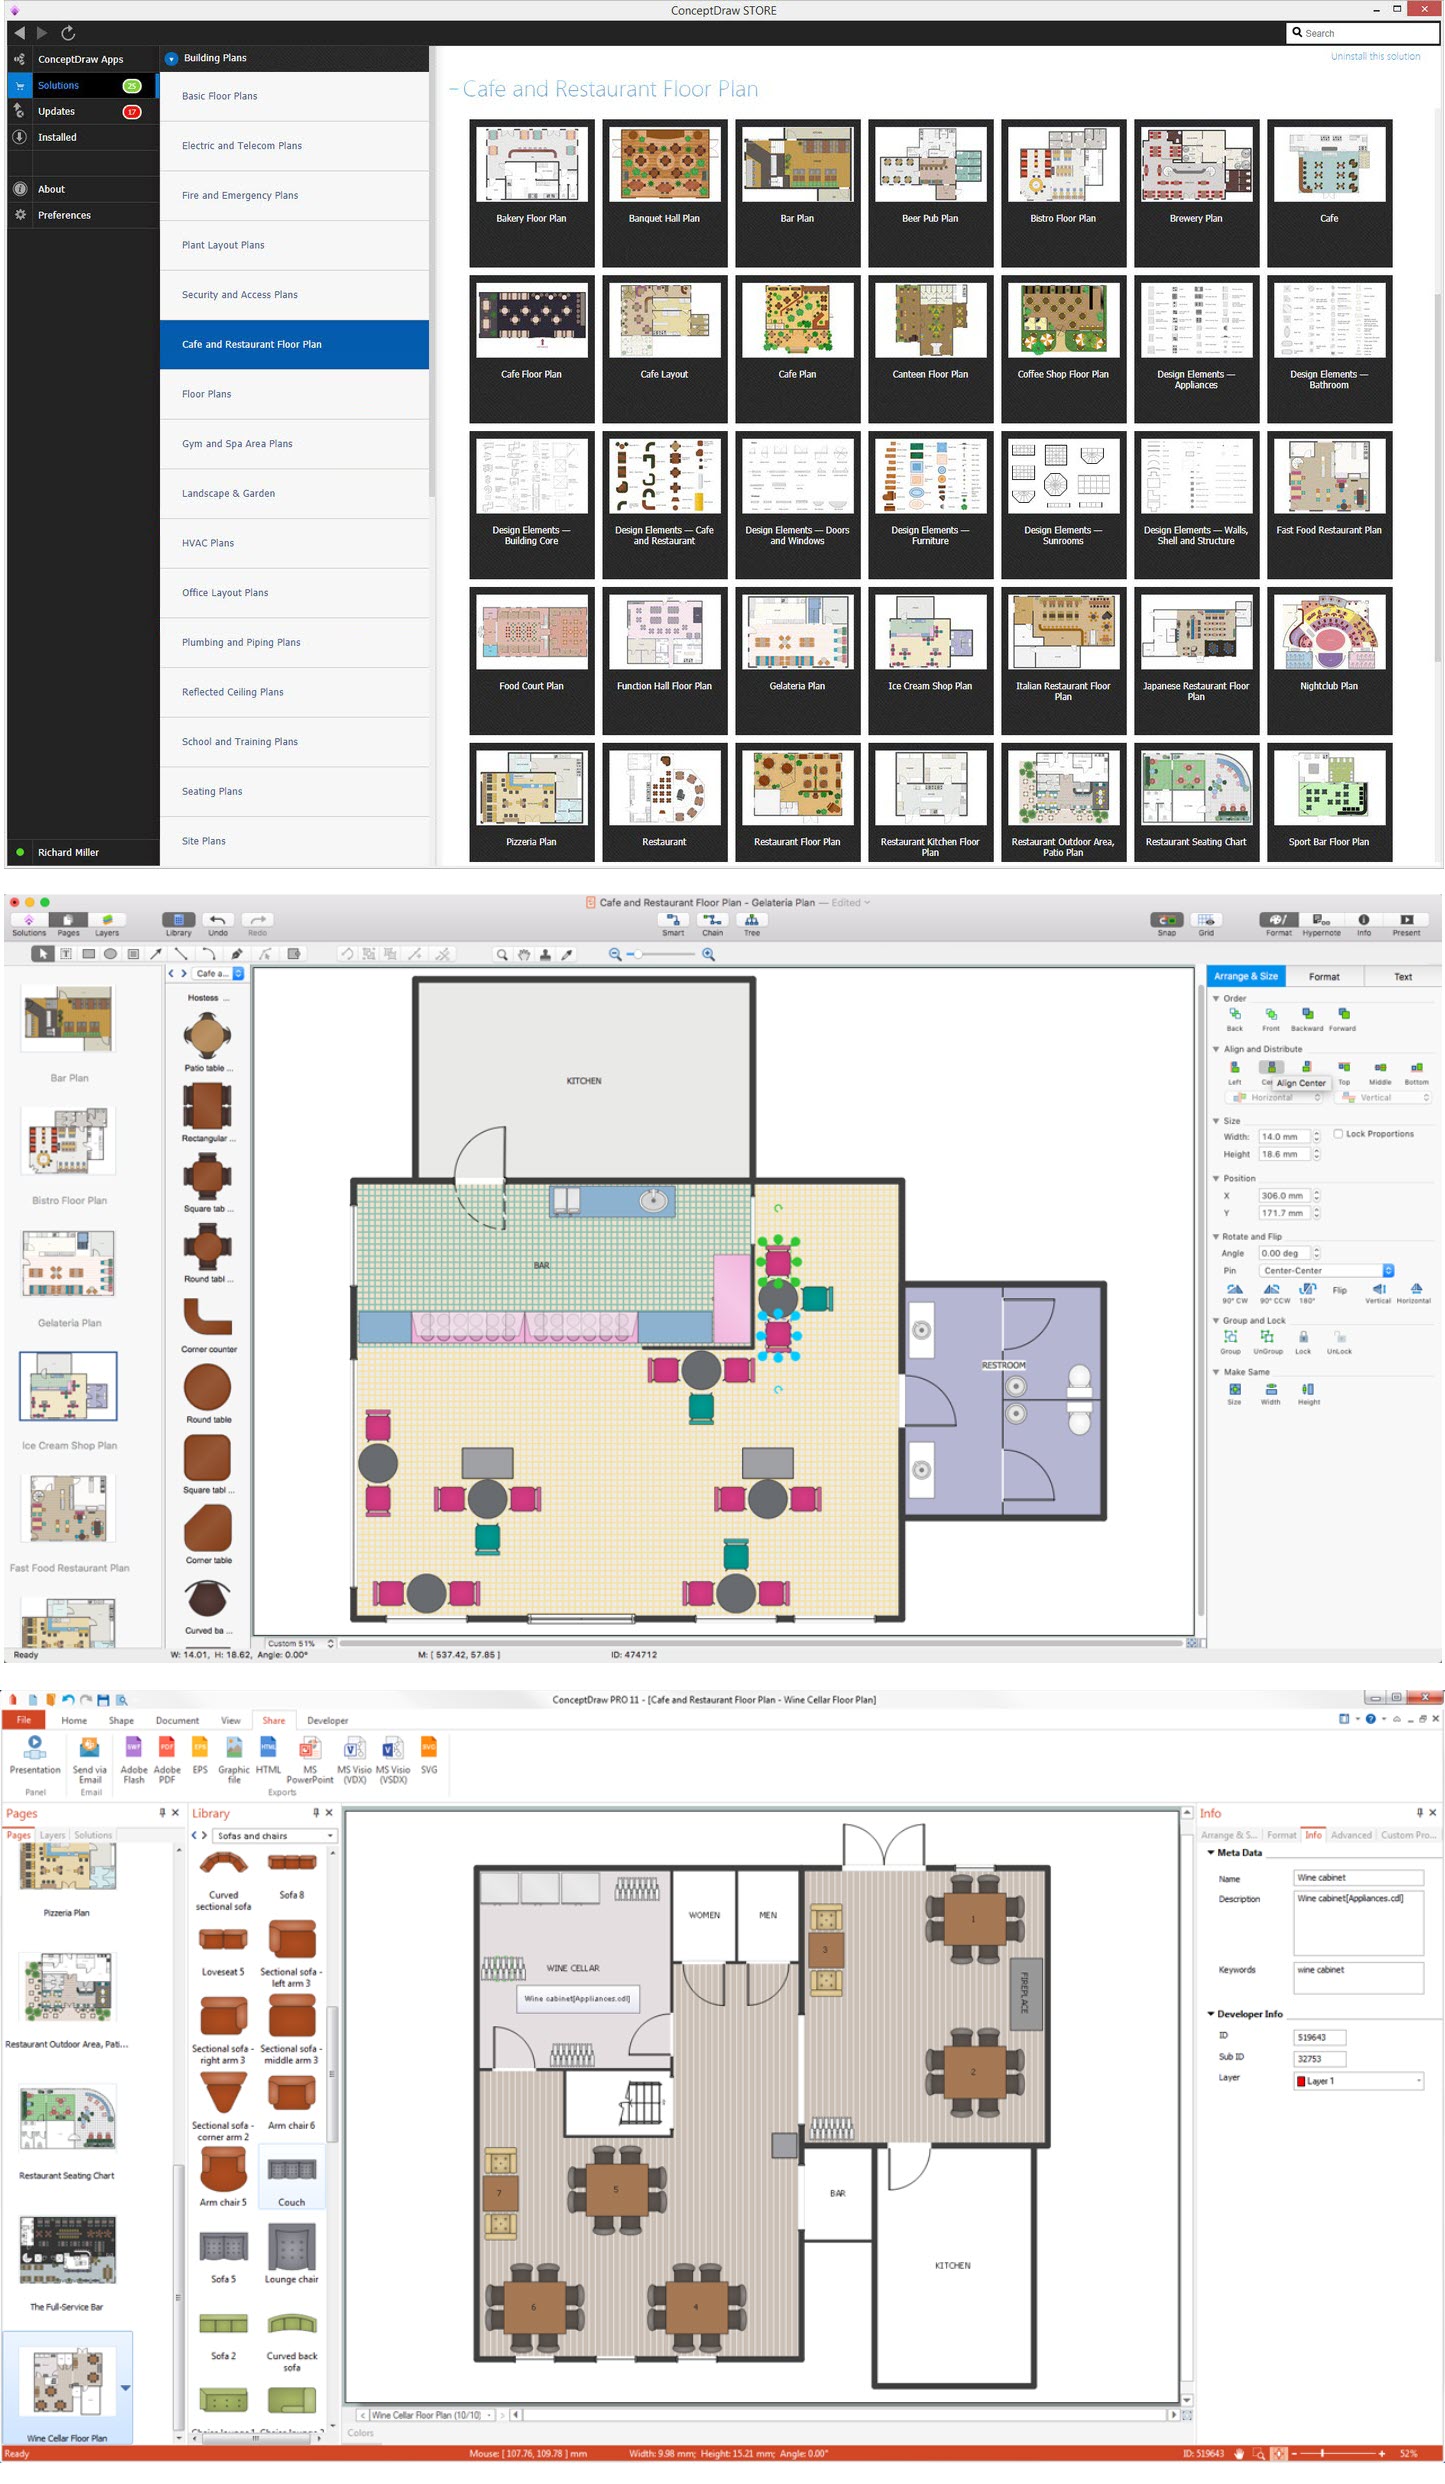
Picture: Café Floor Plan Example
Related Solution:
The Audio & Video Connectors solution contains a set of pre-designed objects, libraries, templates, and samples; allowing quick and easy diagramming of various configurations of audio and video devices.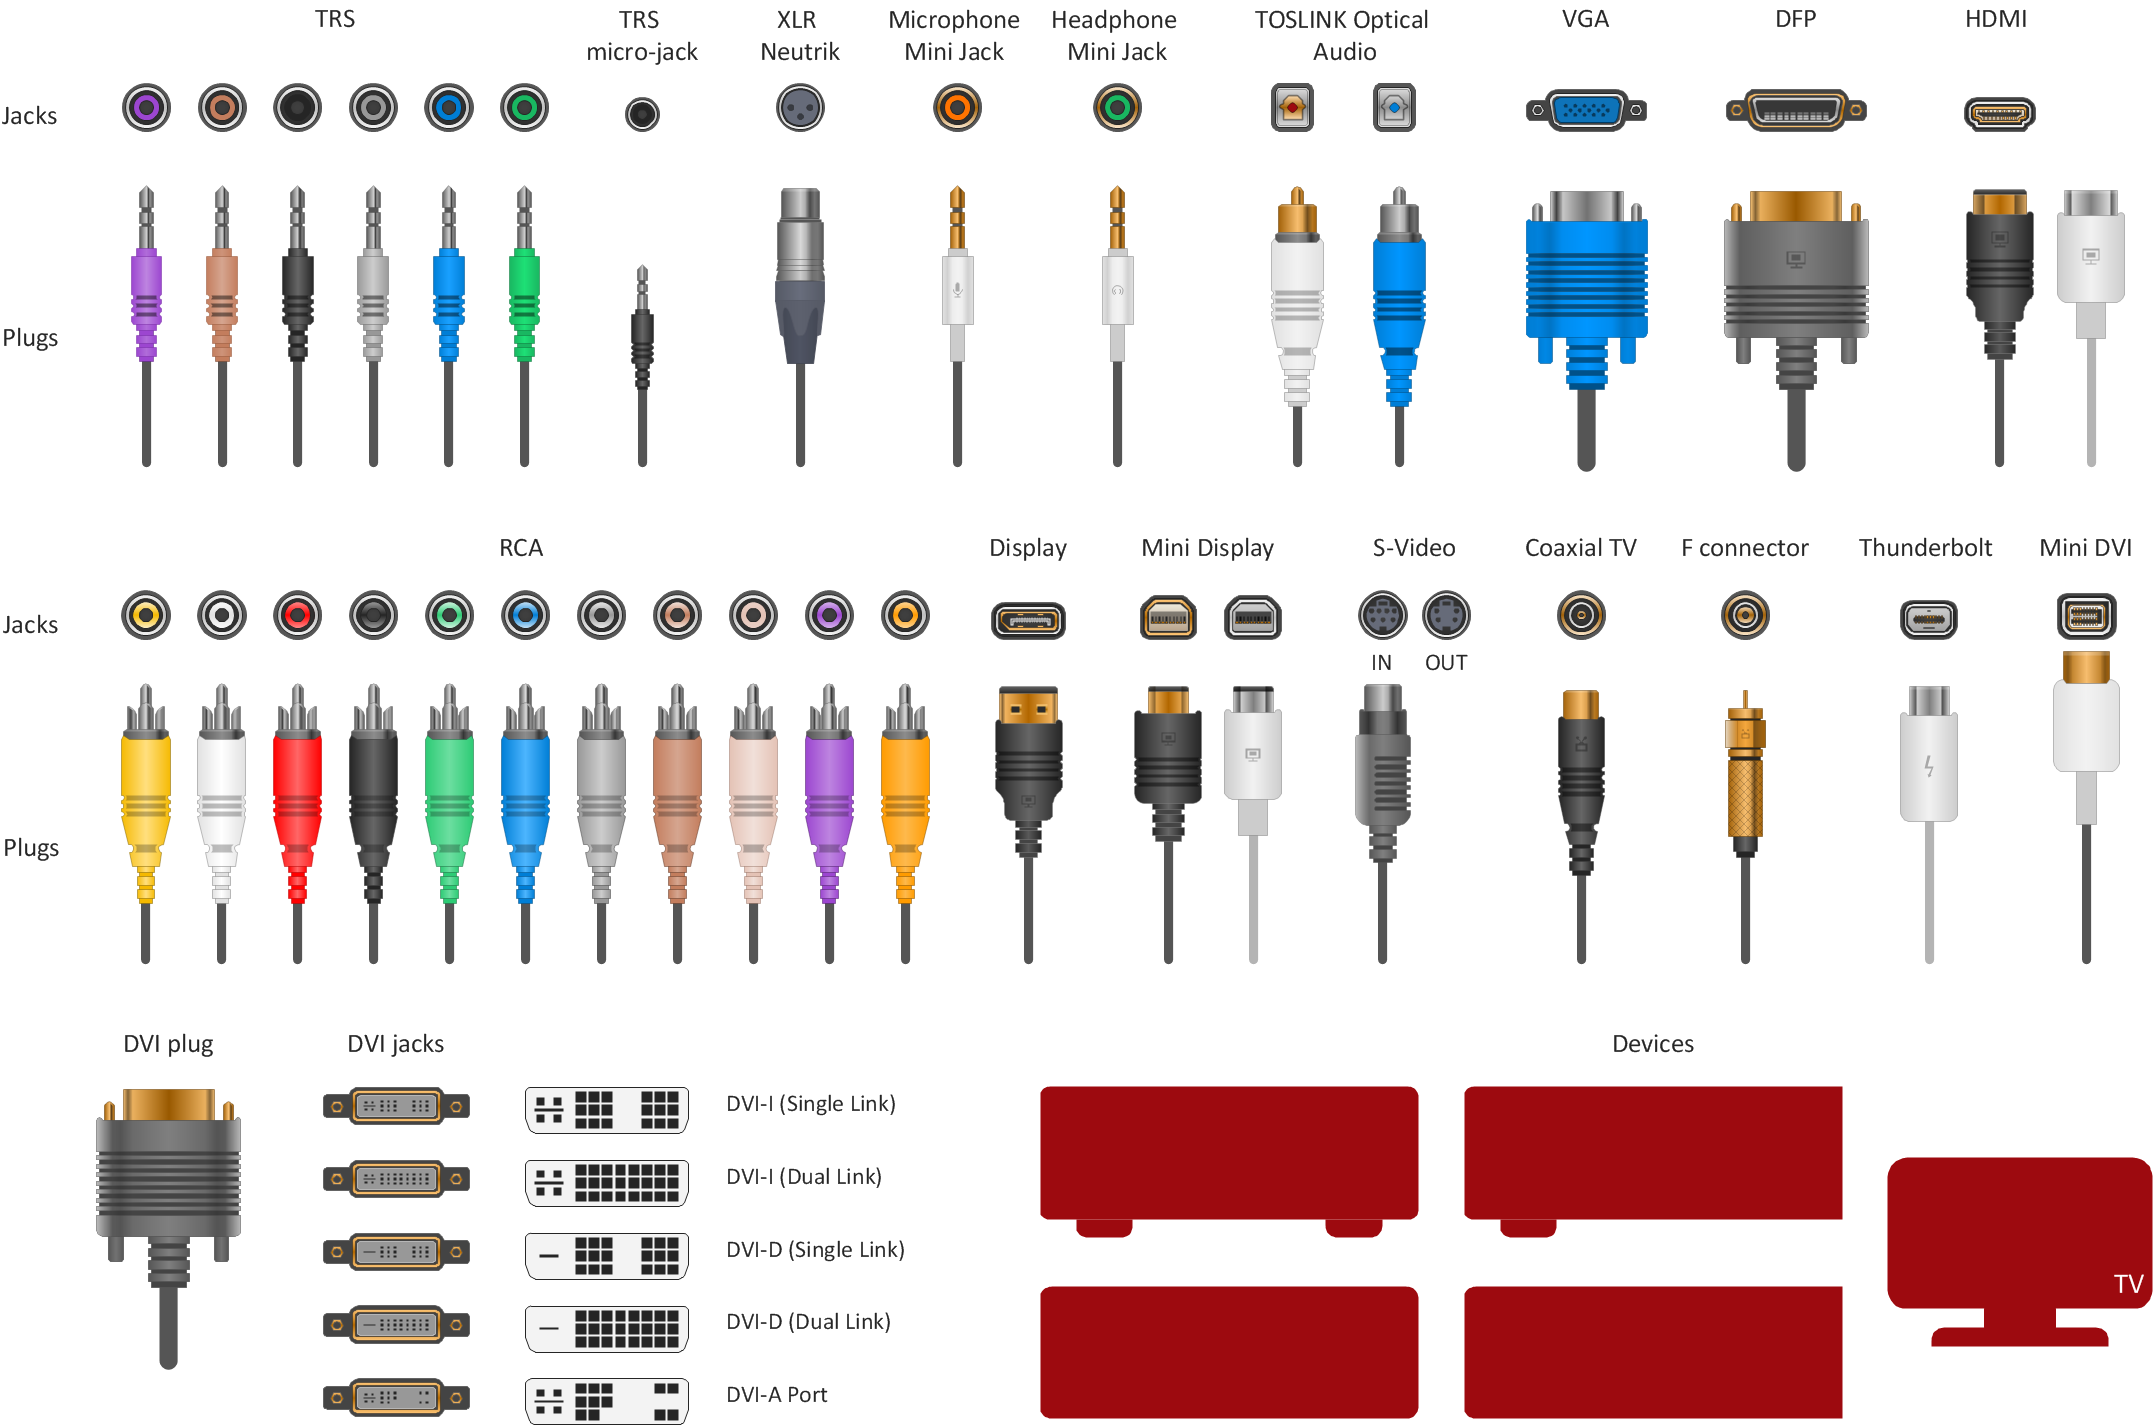
Picture: How To Print Audio & Video Connectors Schema in a Large Format
Related Solution:
ConceptDraw
DIAGRAM 18