Example 1. UML Diagram Tool
Rapid UML Solution provides 13 libraries with 393 vector objects for quick and easy designing the UML diagrams of any types.
The ConceptDraw DIAGRAM UML Diagram Tool offers you to choose the library that corresponds to your diagram type and simply drag the needed objects. Then you just need to arrange and connect these objects with connectors appropriate for diagrams of this type.

Example 2. UML Activity Diagram - Deposit Slip Processing
The Rapid UML Solution provides also large quantity of predesigned templates and samples that are available from ConceptDraw STORE. You can use them as the base for your own UML Diagrams.

Example 3. UML Timing Diagram - Inspection
The UML diagrams you see on this page were created in ConceptDraw DIAGRAM using a powerful UML diagram tool - libraries of Rapid UML Solution. These samples demonstrate the solution's capabilities and the professional results you can achieve. An experienced user spent 10 minutes creating every of these samples.
The UML diagrams produced with ConceptDraw DIAGRAM are vector graphic documents and are available for reviewing, modifying, and converting to a variety of formats (image, HTML, PDF file, MS PowerPoint Presentation, Adobe Flash or MS Visio).
SIX RELATED HOW TO's:
UML Interaction Overview Diagram schematically shows a control flow with nodes and a sequence of activities that can contain interaction or sequence diagrams.
Picture: Interaction Overview Diagram
Experience the main advantage of using ConceptDraw Ice Hockey solution with all tools you need to 🔸 create professional ice hockey diagrams as quickly as possible and visualize ✔️ ice hockey rinks, ✔️ roles, ✔️ positioning, ✔️ game situations, ✔️ tactics, and ✔️ strategies to succeed in tactical planning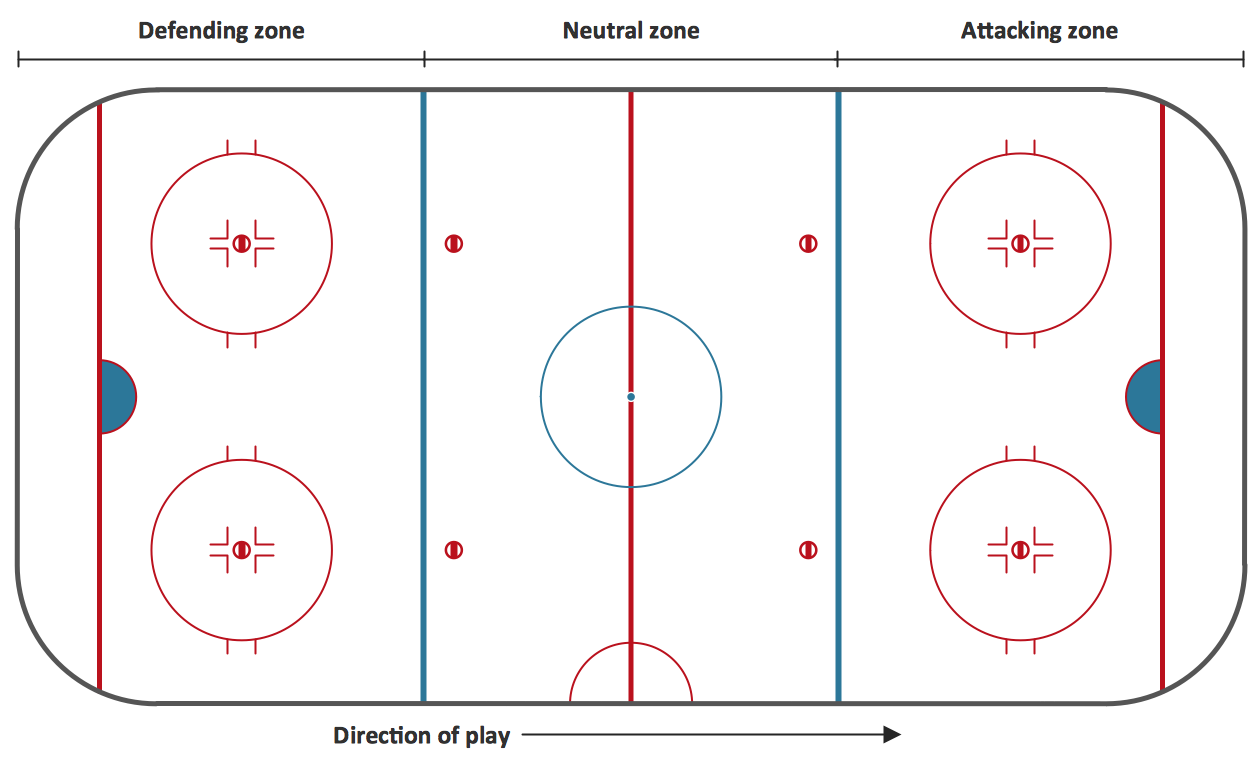
Picture: Ice Hockey Rink Diagram
Related Solution:
This sample was created in ConceptDraw DIAGRAM diagramming and vector drawing software using the Flowcharts solution from the Diagrams area of ConceptDraw Solution Park.
This sample shows the Flowchart of the Subprime Mortgage Crisis. This Flowchart describes the decline in housing prices when the housing bubble burst and what it caused on the housing and financial markets. You can also see the Government and Industry responses in this crisis situation.
Picture: Flowchart on Bank. Flowchart Examples
Related Solution:
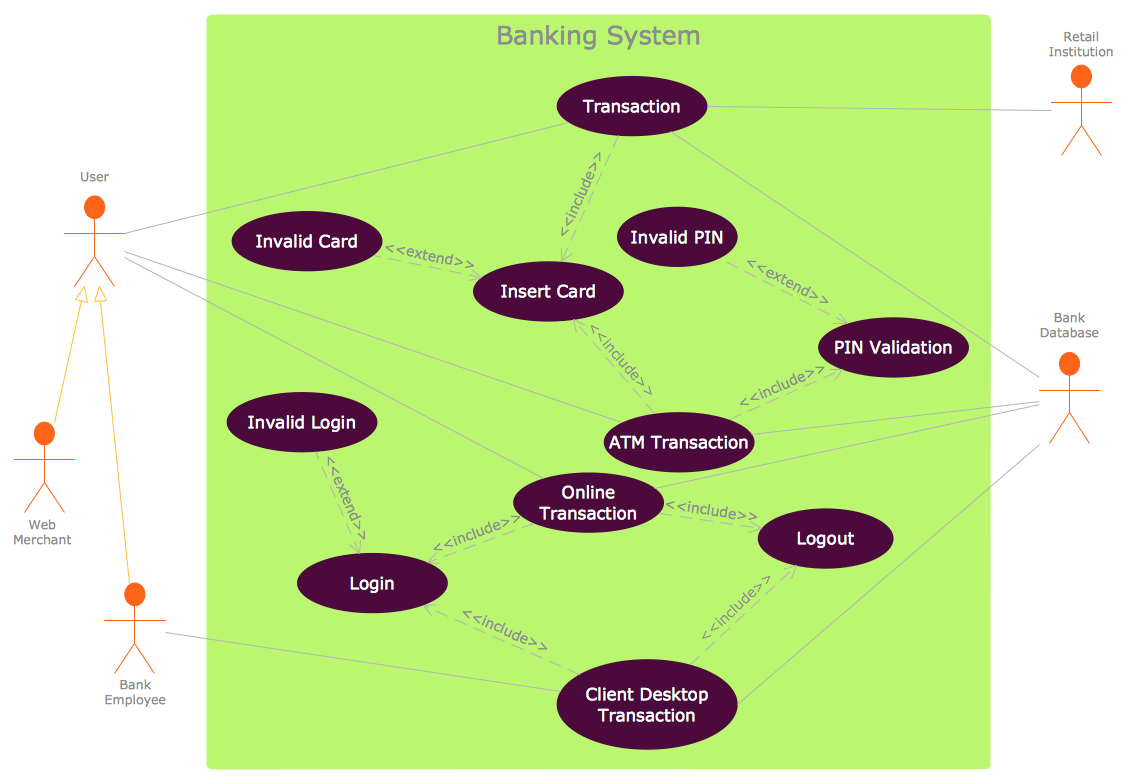
Unified Modeling Language (UML) is a graphical modeling language for describing, visualizing, projecting and documenting of object oriented systems. UML digram is used for modeling of organizations and their business processes, for development the big projects, the complex software applications. Comprehensive UML diagram allows to create the set of interrelated documents that gives the complete visual representation of the modeling system.
Picture: UML Sample Project
Related Solution:
Business Process Flow Diagram is one of the main tool of business analysis and business process re-engineering that lets identify and easy understand process flows within organization. Sign up and start today.
Picture: Business Process Flow Diagram
Related Solution:
Jackson System Development (JSD) is a linear method of system development created by Michael A. Jackson and John Cameron in the 1980s. It comprises the whole software life cycle directly or providing a framework for more specialized techniques.
When implementing the Jackson System Development method and designing JSD diagrams, you can succesfully use the powerful and helpful tools of ConceptDraw DIAGRAM software extended with Entity-Relationship Diagram (ERD) solution from the Software Development area of ConceptDraw Solution Park.
Picture: JSD - Jackson system development
Related Solution:


