UML Class Diagram Example for Transport System
This sample was created in ConceptDraw DIAGRAM diagramming and vector drawing software using the UML Class Diagram library of the Rapid UML Solution from the Software Development area of ConceptDraw Solution Park.
This sample shows the transport protocol mappings for SNMP (Simple Network Management Protocol), the classes of the transport system and relationships between them and is used in IP network.
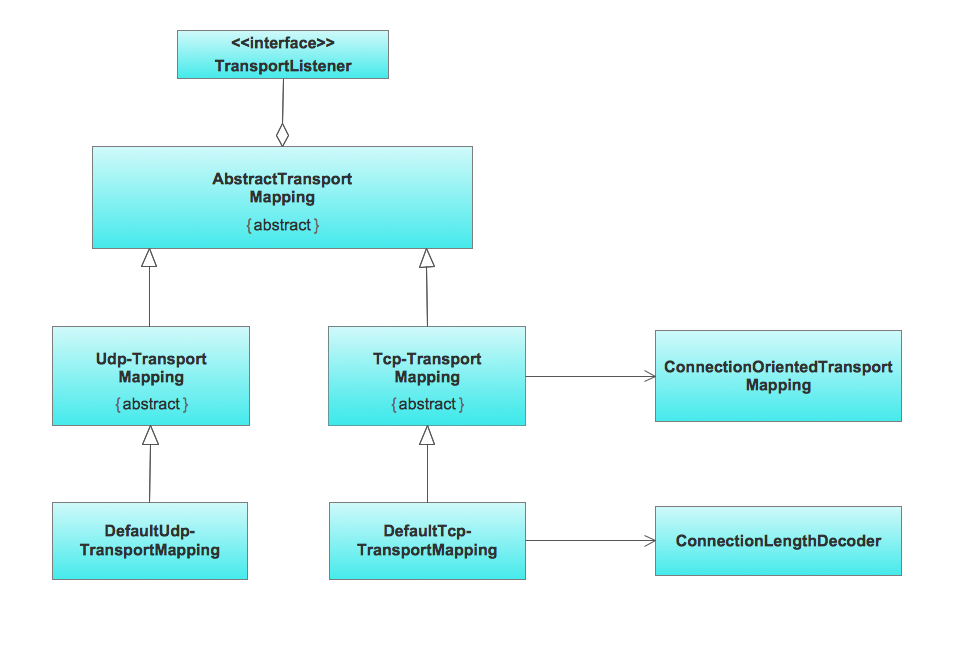
Example 1. Class Diagram for Transpotr System in UML
Using the libraries of the Rapid UML Solution for ConceptDraw DIAGRAM you can create your own visual vector UML diagrams quick and easy.
UML Resource:
- UML Software
- How to create a UML Diagram
- UML Diagram Examples
- Class Diagram
- Use Case Diagram
- Timing Diagram
- Interaction Overview Diagram
- Communication Diagram
- State Machine Diagram
- Activity Diagram
- Deployment Diagram
- Package Diagram
- Collaboration Diagram
- Object Diagram
- Sequence Diagram
- Composite Structure
- Component Diagram
TEN RELATED HOW TO's:
The use case diagram (behavior scenarios, precedents) is the initial conceptual representation of the system during its design and development. This diagram consists of actors, use cases and relationships between them. When constructing a diagram, common notation elements can also be used: notes and extension mechanisms.
This sample was created in ConceptDraw DIAGRAM diagramming and vector drawing software using the UML Use Case Diagram library of the Rapid UML Solution from the Software Development area of ConceptDraw Solution Park.
This sample shows the types of user’s interactions with the system and is used at the registration and working with the database system.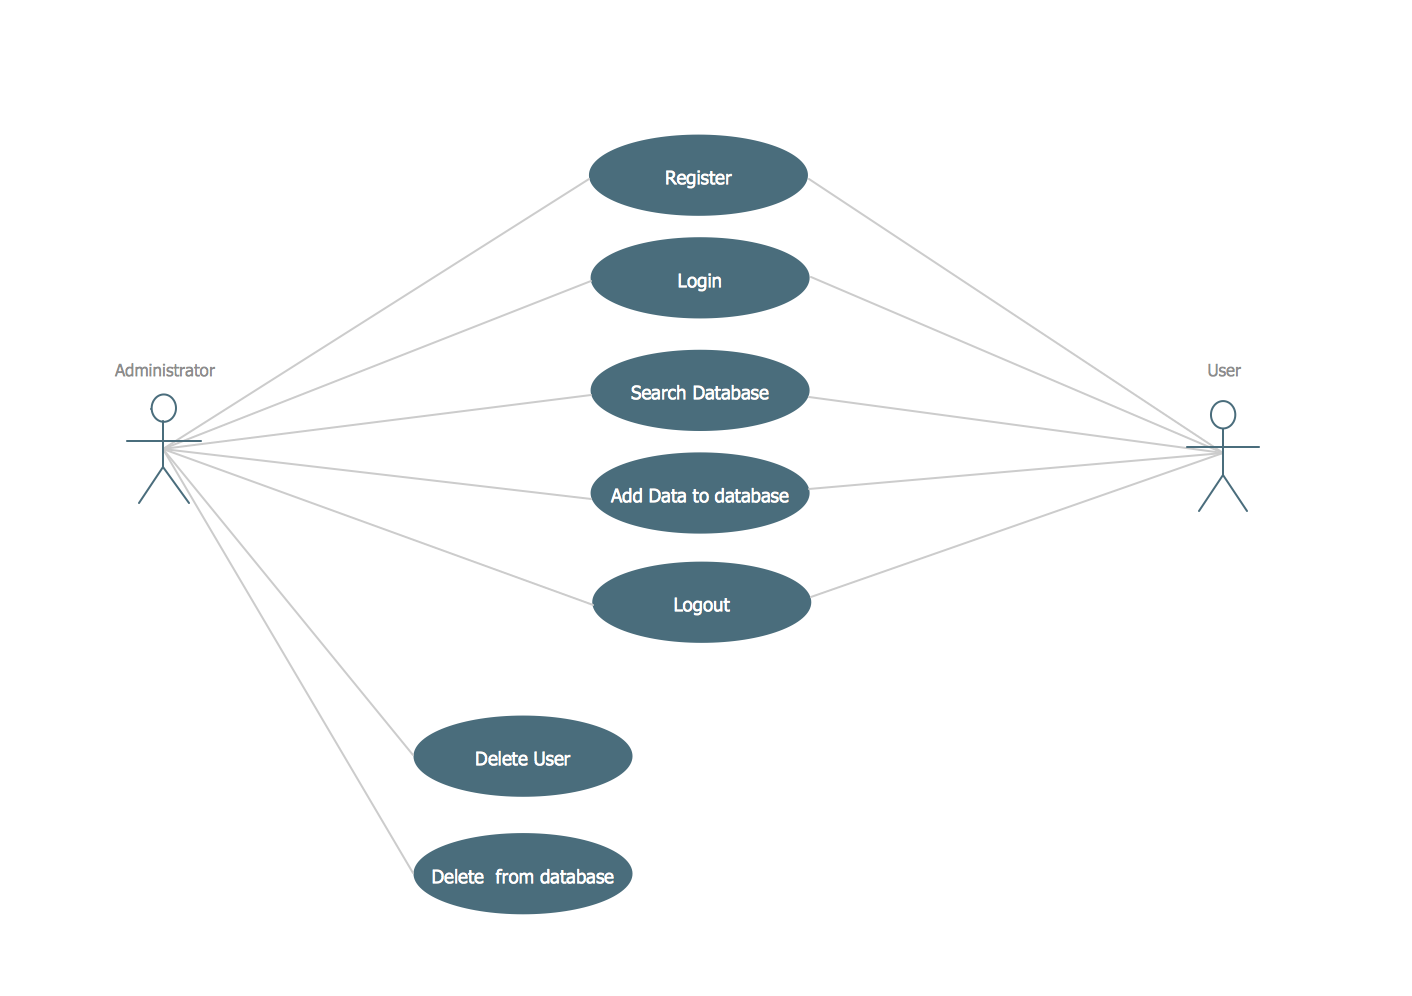
Picture: UML Use Case Diagram Example. Registration System
Related Solution:
Electrical Engineering Solution used together with ConceptDraw DIAGRAM drawing facilities makes short a work of drawing various electrical and electronic circuit schemes. A library of vector objects composed from symbols of Analog and Digital Logic elements of electric circuit includes 40 symbolic images of logic gates, bistable switches of bi-stable electric current, circuit controllers, amplifiers, regulators, generators, etc. All of them can be applied in electronic circuit schemes for showing both analog and digital elements of the circuit.
Electrical Engineering Solution used together with ConceptDraw DIAGRAM drawing facilities makes short a work of drawing various electrical and electronic circuit schemes. A library of vector objects composed from symbols of Analog and Digital Logic elements of electric circuit includes 40 symbolic images of logic gates, bistable switches of bi-stable electric current, circuit controllers, amplifiers, regulators, generators, etc. All of them can be applied in electronic circuit schemes for showing both analog and digital elements of the circuit.
Picture:
Electrical Diagram Symbols F.A.Q.
How to Use Electrical ConceptDraw Diagram Software
Related Solution:
Jackson System Development (JSD) is a linear method of system development created by Michael A. Jackson and John Cameron in the 1980s. It comprises the whole software life cycle directly or providing a framework for more specialized techniques.
When implementing the Jackson System Development method and designing JSD diagrams, you can succesfully use the powerful and helpful tools of ConceptDraw DIAGRAM software extended with Entity-Relationship Diagram (ERD) solution from the Software Development area of ConceptDraw Solution Park.
Picture: JSD - Jackson system development
Related Solution:
This sample was created in ConceptDraw DIAGRAM diagramming and vector drawing software using the UML Class Diagram library of the Rapid UML Solution from the Software Development area of ConceptDraw Solution Park.
This sample describes the use of the classes, the generalization associations between them, the multiplicity of associations and constraints. Provided UML diagram is one of the examples set that are part of Rapid UML solution.
Picture: UML Class Diagram Generalization ExampleUML Diagrams
Related Solution:
Stakeholder management is a critical component to the successful delivery of any project, programme or activity.
ConceptDraw DIAGRAM is a powerful diagramming and vector drawing software. Now, thanks to the Stakeholder Onion Diagrams Solution included to the Management Area of ConceptDraw Solution Park, ConceptDraw DIAGRAM became also unique stakeholder management system design software.
Picture: Stakeholder Management System using Onion Diagram
Related Solution:
ConceptDraw DIAGRAM diagramming and vector drawing software extended with Flowcharts Solution from the 'Diagrams' area of ConceptDraw Solution Park is a powerful tool for drawing Flow Charts of any complexity you need. Irrespective of whether you want to draw a Simple Flow Chart or large complex Flow Diagram, you estimate to do it without efforts thanks to the extensive drawing tools of Flowcharts solution, there are professional flowchart symbols and basic flowchart symbols. This sample shows the Gravitational Search Algorithm (GSA) that is the optimization algorithm.
Picture: Simple Flow Chart
Related Solution:
Diagrams are a very important part of modern life. With the help of flow diagram software, a lot of companies can promote their ideas at the market. Its usefulness is totally doubtless.
This is a flow chart of the invoice payment flow. This flowchart details decrypts all stages of the process of obtaining and paying bills. It is a description of the universal process - such steps performs accounting departments of almost any organization. Since every business no matter what it does is a consumer of some goods or services. The given flow chart was made using ConceptDraw DIAGRAM software and the Diagrams solution for making flowcharts of any kind.
Picture: Flow Diagram Software
Related Solution:
While creating flowcharts and process flow diagrams, you should use special objects to define different statements, so anyone aware of flowcharts can get your scheme right. There is a short and an extended list of basic flowchart symbols and their meaning. Basic flowchart symbols include terminator objects, rectangles for describing steps of a process, diamonds representing appearing conditions and questions and parallelograms to show incoming data.
This diagram gives a general review of the standard symbols that are used when creating flowcharts and process flow diagrams. The practice of using a set of standard flowchart symbols was admitted in order to make flowcharts and other process flow diagrams created by any person properly understandable by other people. The flowchart symbols depict different kinds of actions and phases in a process. The sequence of the actions, and the relationships between them are shown by special lines and arrows. There are a large number of flowchart symbols. Which of them can be used in the particular diagram depends on its type. For instance, some symbols used in data flow diagrams usually are not used in the process flowcharts. Business process system use exactly these flowchart symbols.
Picture: Flowchart Symbols: Meaning and Examples
Related Solution:
Working with personnel might be difficult if you are not prepared enough. To explain your workers all the details of communication with customers, you can draw an order process flowchart which will describe every step of the process and answer all the questions that might appear. You can view a lot of business process mapping diagram examples here, in ConceptDraw Solution Park.
This business process flow chart is created to illustrate the sample work order process. Before an organization can make some work for a person, the customer work order request must be completed. It is needed for tracking and accountability objectives. We used this business process flowchart to show a certain tasks and actions assumed by an organization. This flowchart depicts the outside inputs that are needed to launch a process, and ways the organization delivers its outputs. This business process flowchart was created with a help of ConceptDraw Business Process Mapping solution.
Picture: Work Order Process Flowchart. Business Process Mapping Examples
Related Solution:
UML Apartment Plan. This sample was created in ConceptDraw DIAGRAM diagramming and vector drawing software using the UML Class Diagram library of the Rapid UML Solution from the Software Development area of ConceptDraw Solution Park.
This sample show the detailed plan of the apartment and is used by building companies, design apartments, real estate agencies, at the buying / selling of the realty.
Picture: UML Class Diagram Example - Apartment Plan
Related Solution:
ConceptDraw
DIAGRAM 18