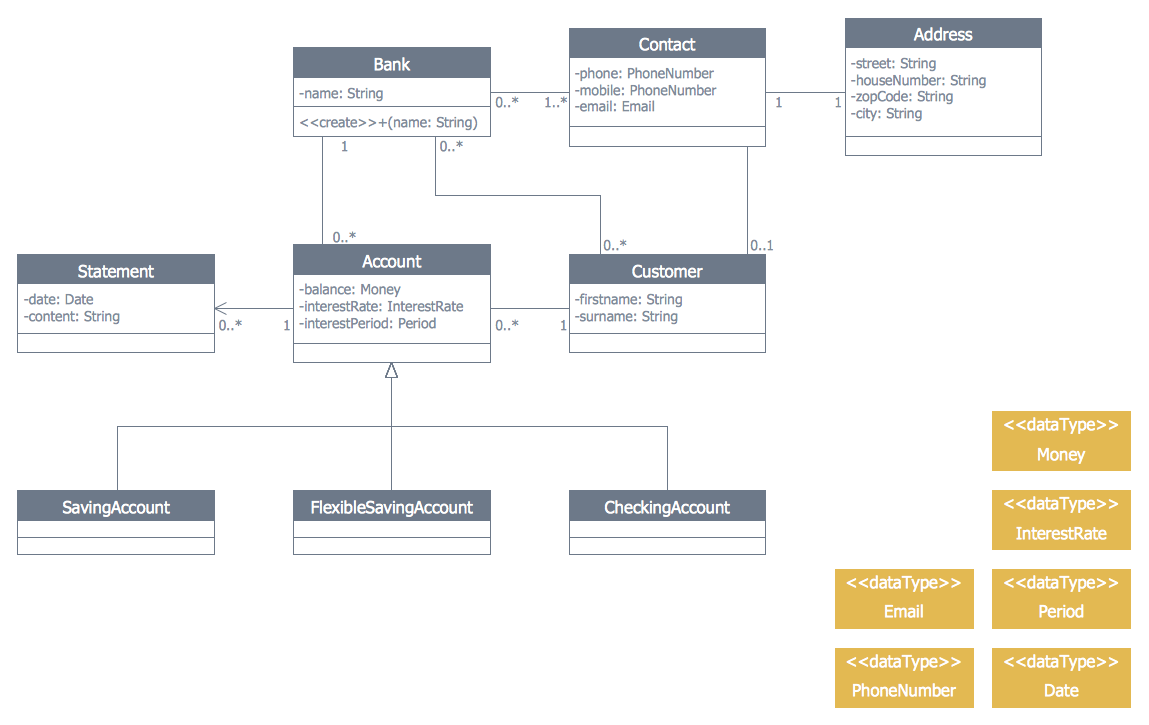
Example 1. Banking System - UML Class Diagram
ATM UML Diagrams Solution offers all needed tools for representing banking system of any complexity. You can choose any type of Bank UML Diagram useful for you and use the corresponding library from the set of offered by ATM UML Diagrams Solution.
Here are represented 14 libraries of ATM UML Diagrams Solution which contain 182 ready-to-use vector shapes. All they are professionally designed and universally accepted UML objects which will help to facilitate design and development process of the banking system.

Example 2. UML Package Diagram for Banking System
The banking system samples you see on this page were created in ConceptDraw DIAGRAM software using the ATM UML Diagrams Solution. These samples successfully demonstrate solution's capabilities and professional results you can achieve. An experienced user spent 10-15 minutes creating each of them.
Use the ATM UML Diagrams Solution for ConceptDraw DIAGRAM to create your own professional looking UML Diagrams for the banking system quick, easy and effective.
All source documents are vector graphic documents. They are available for reviewing, modifying, or converting to a variety of formats (PDF file, MS PowerPoint, MS Visio, and many other graphic formats) from the ConceptDraw STORE. The ATM UML Diagrams Solution is available for all ConceptDraw DIAGRAM users.
TEN RELATED HOW TO's:
This sample shows the concept of working of the transport company and is used by transport companies, carriers at the transportation of various goods.
Picture: UML Class Diagram Example for GoodsTransportation System
Related Solution:
Software development flourishes nowadays. Students have tons of educational information and courses that would fit every taste. And it's no secret that knowing how to draw data flow diagrams is a useful skill for a future software architect. The diagrams help a lot in understanding how to storage data effectively and how data processes within a system.
This data flow diagram represents the model of small traditional production enterprise. It was created using Yourdon and Coad notation. The data flow diagram include four main objects: entity, process, data store and data flow. Yourdon and Coad notation uses circles to depict processes and parallel lines to represent data stores. Dataflows are shown as arrowed lines. They are labeled with the description of the data that move through them. Dataflow's role is to deliver the pieces of information. A process's function is to transform. the input data flow into output data flow. ConceptDraw Data Flow Diagrams solution contains the data flow diagram symbols of both Yourdon-Coad and Gane-Sarson notations and a set of handy templates to get started with DFD.
Picture: Data Flow Diagrams
Related Solution:
The vector stencils library Activity diagrams from the solution Rapid UML contains specific data modeling symbols for ConceptDraw DIAGRAM software.
Picture: Data Modeling Diagram
UML Interaction Overview Diagram schematically shows a control flow with nodes and a sequence of activities that can contain interaction or sequence diagrams.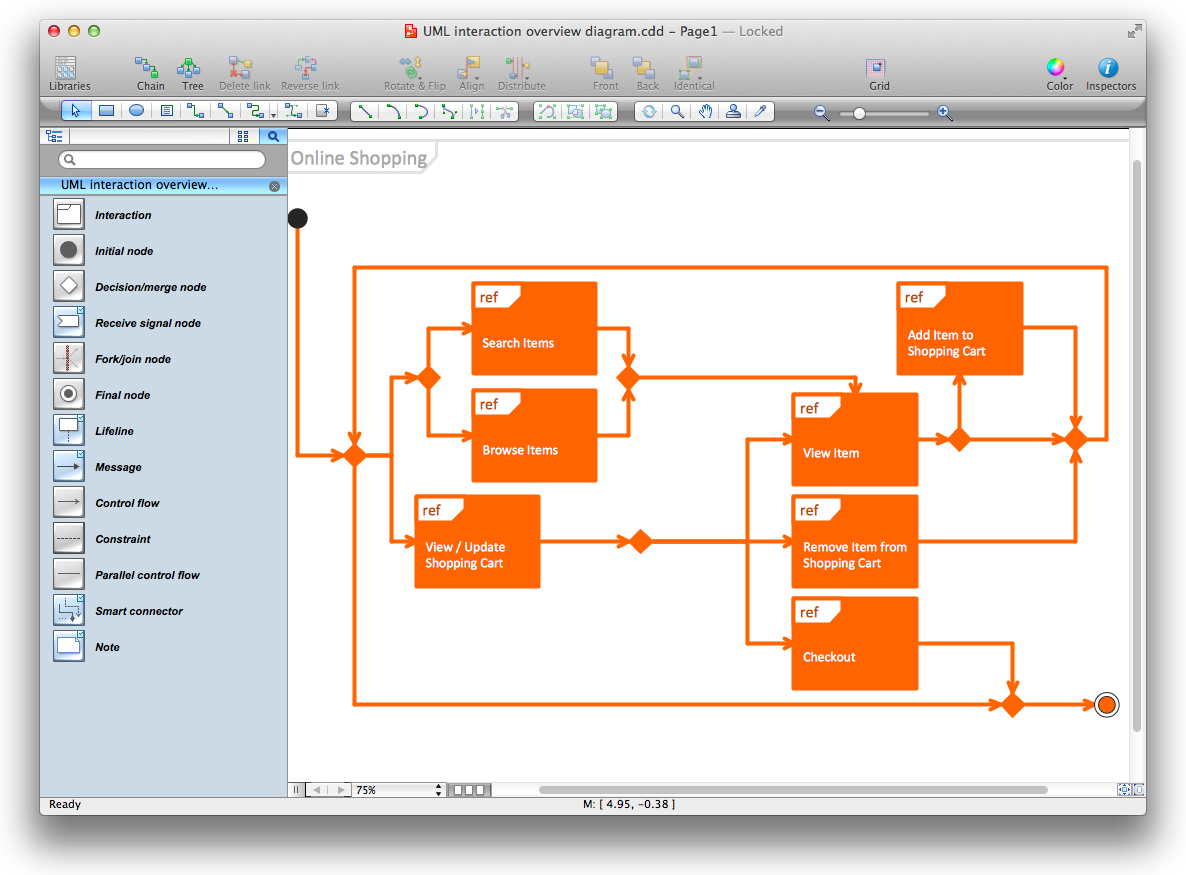
Picture: Diagramming Software for Design UML Interaction Overview Diagrams
All information you send from ConceptDraw MINDMAP is indexed for you by Evernote, making information easy to find and use.
Picture: Evernote exchange - Personal Productivity
Related Solution:
Monitoring Deployment Management icons - Amazon AWS pro diagrams - AWS diagrams are part of architecturing tools provided with ConceptDraw Solution Park.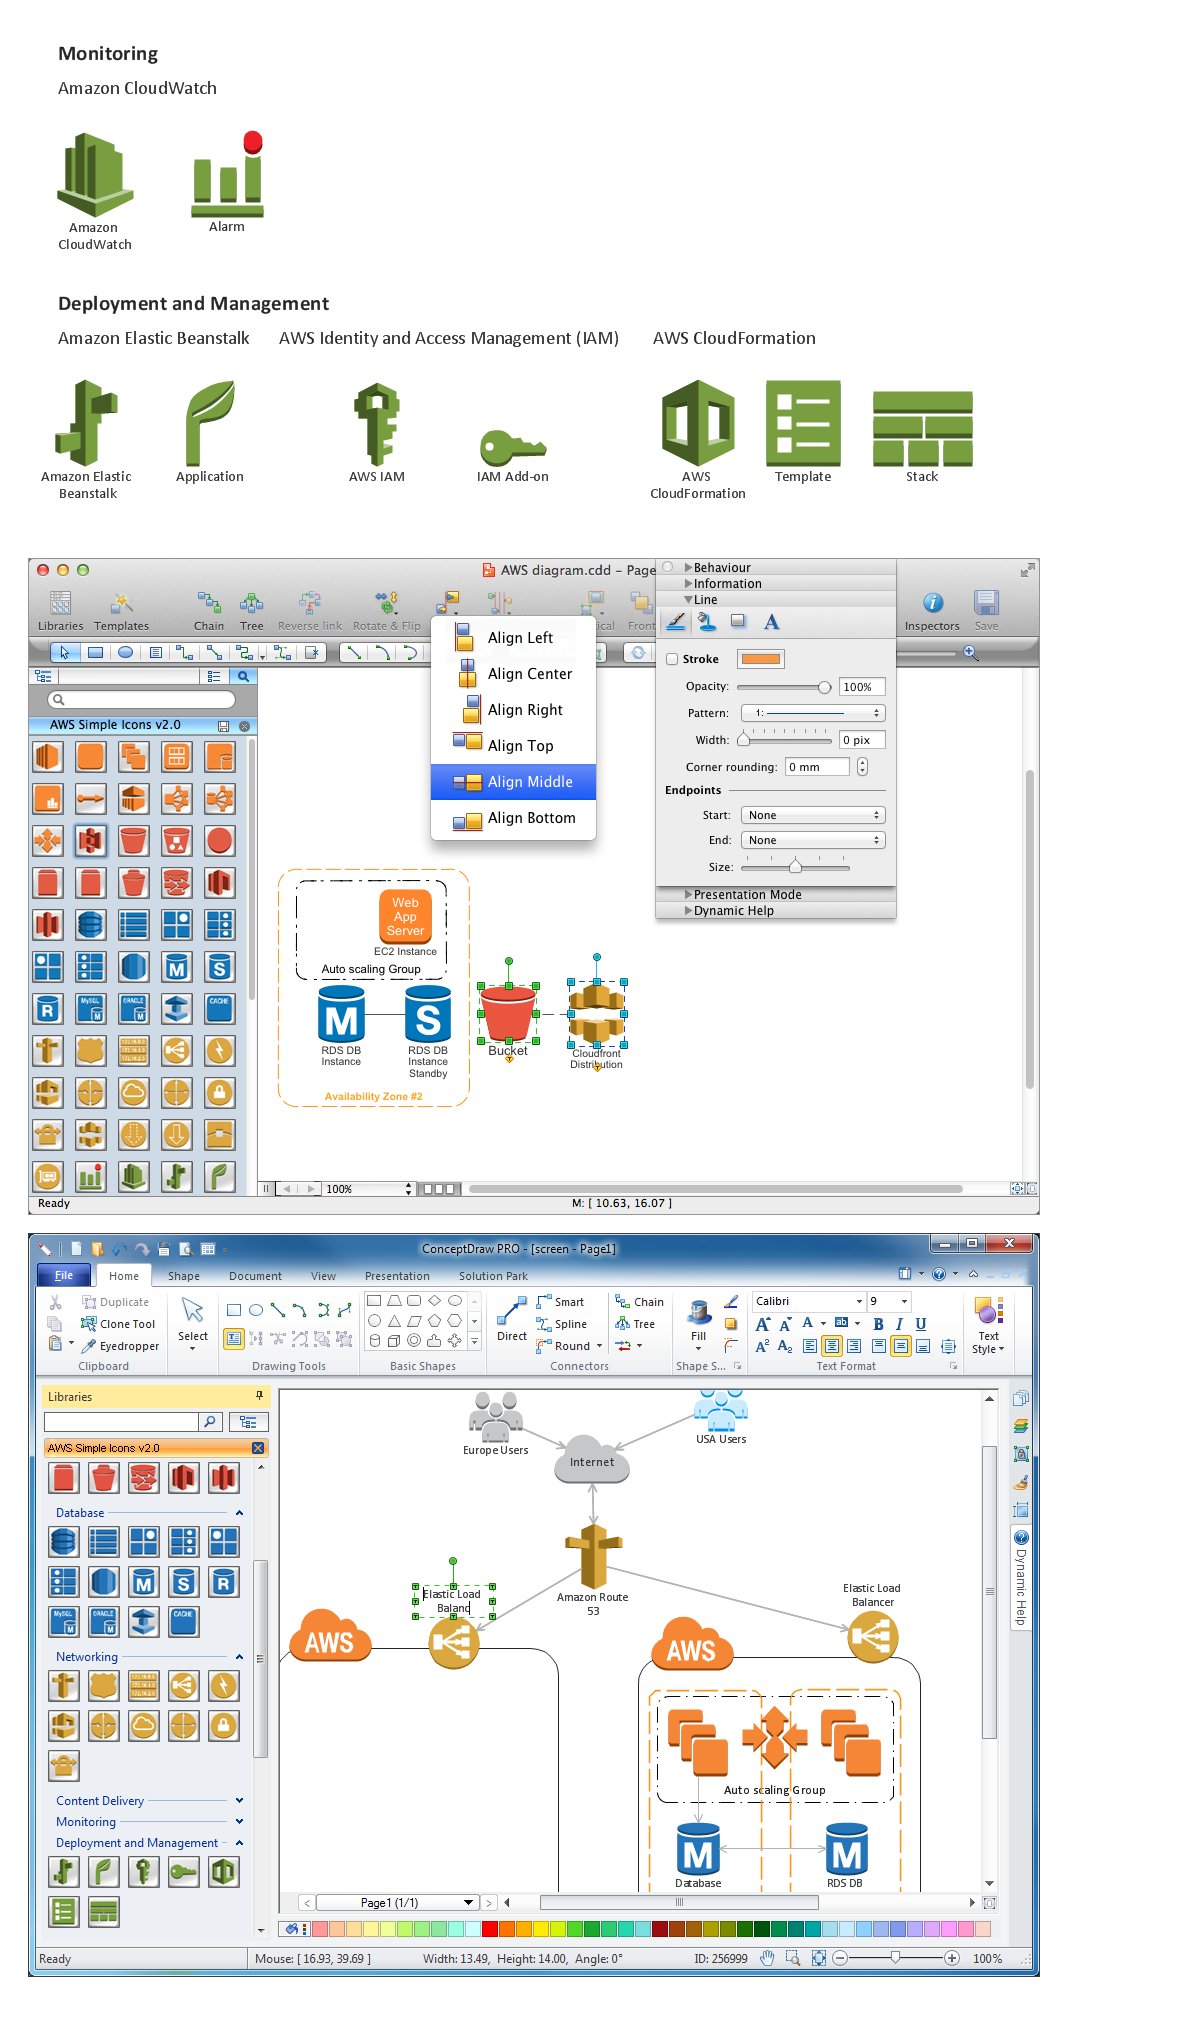
Picture: Diagramming software for Amazon Web Service icon set: Monitoring, Deployment, Management
There are plenty of diagramming tools, the question is to choose the most suitable for your needs. For example, you can choose ConceptDraw DIAGRAM as organizational chart software and get fascinating results in a few minutes. An orgchart is useful for any corporation.
This is an example of a hierarchical organization scheme of the company. It has tree-like structure. Each middle manager is subordinated to a few employees, and he is accountable to one of the top managers. Every type of organizational composition of businesses may be presented in the view of an organizational chart that is supported by ConceptDraw Organisational Charts solution. There are number of ways of building a structure of business organization, establishing how it should function.
Picture: ConceptDraw DIAGRAM - Organizational chart software
Related Solution:
UML state machine's goal is to overcome the main limitations of traditional finite-state machines while retaining their main benefits.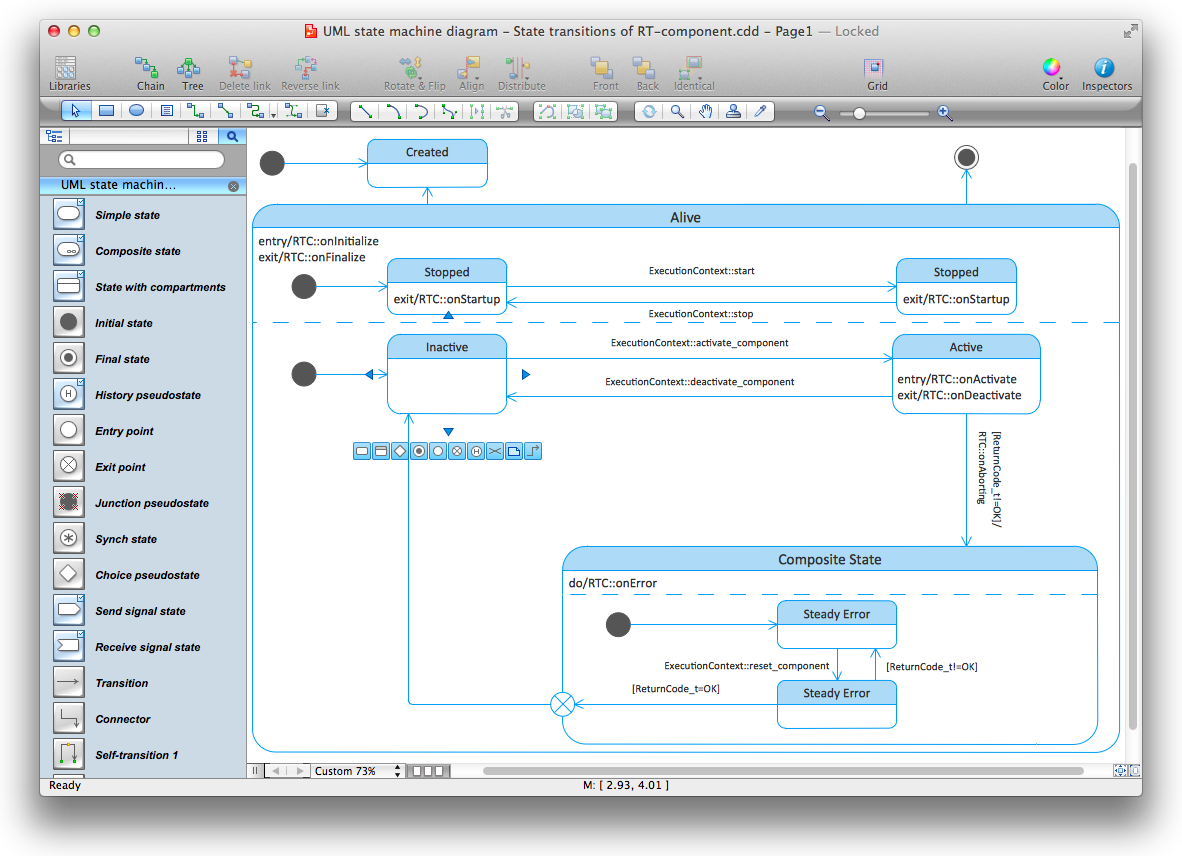
Picture: Diagramming Software for Design UML State Machine Diagrams
ConceptDraw DIAGRAM system design software is a product of CS Odessa that was developed especially for making it much simpler to create all the needed diagrams, charts, flowcharts, schemes and other drawings when there is such a need in it. Having the Specification and Description Language (SDL) solution installed from the ConceptDraw STORE application may be another bonus to any ConceptDraw DIAGRAM diagramming and drawing software’s user as it offers both stencil libraries with the design elements and the pre-made examples of the diagrams, such as the SDL ones.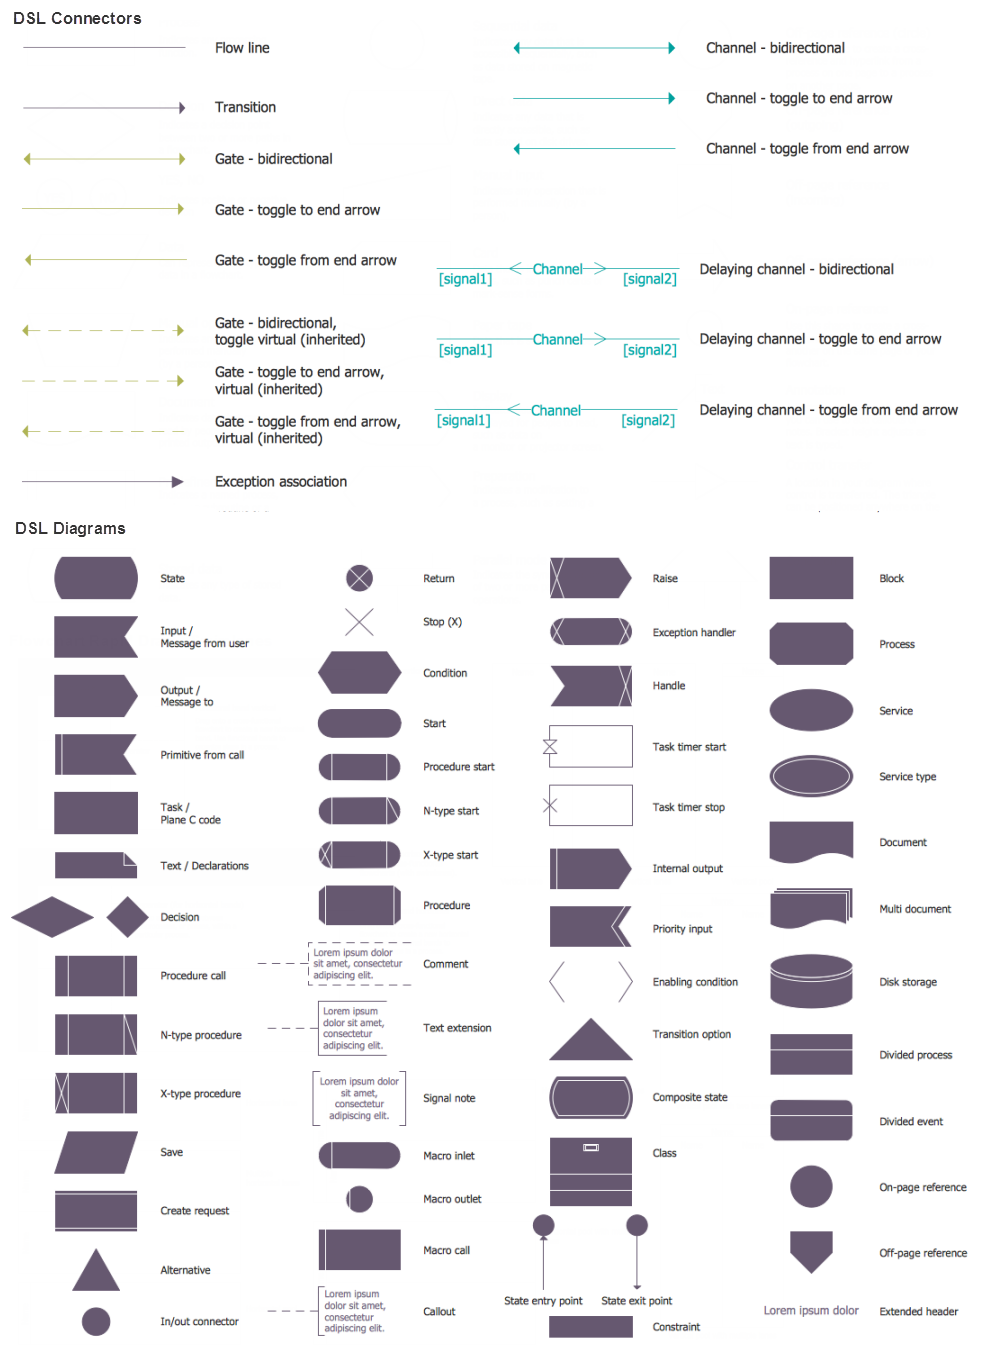
Picture: System Design
Related Solution:
Creating CCTV system diagrams is quick and easy with ConceptDraw DIAGRAM diagramming software enhanced with Audio, Video, Media solution from ConceptDraw Solution Park. It contains library of vector cliparts of video and TV devices and different digital gadgets for drawing this kind of diagrams.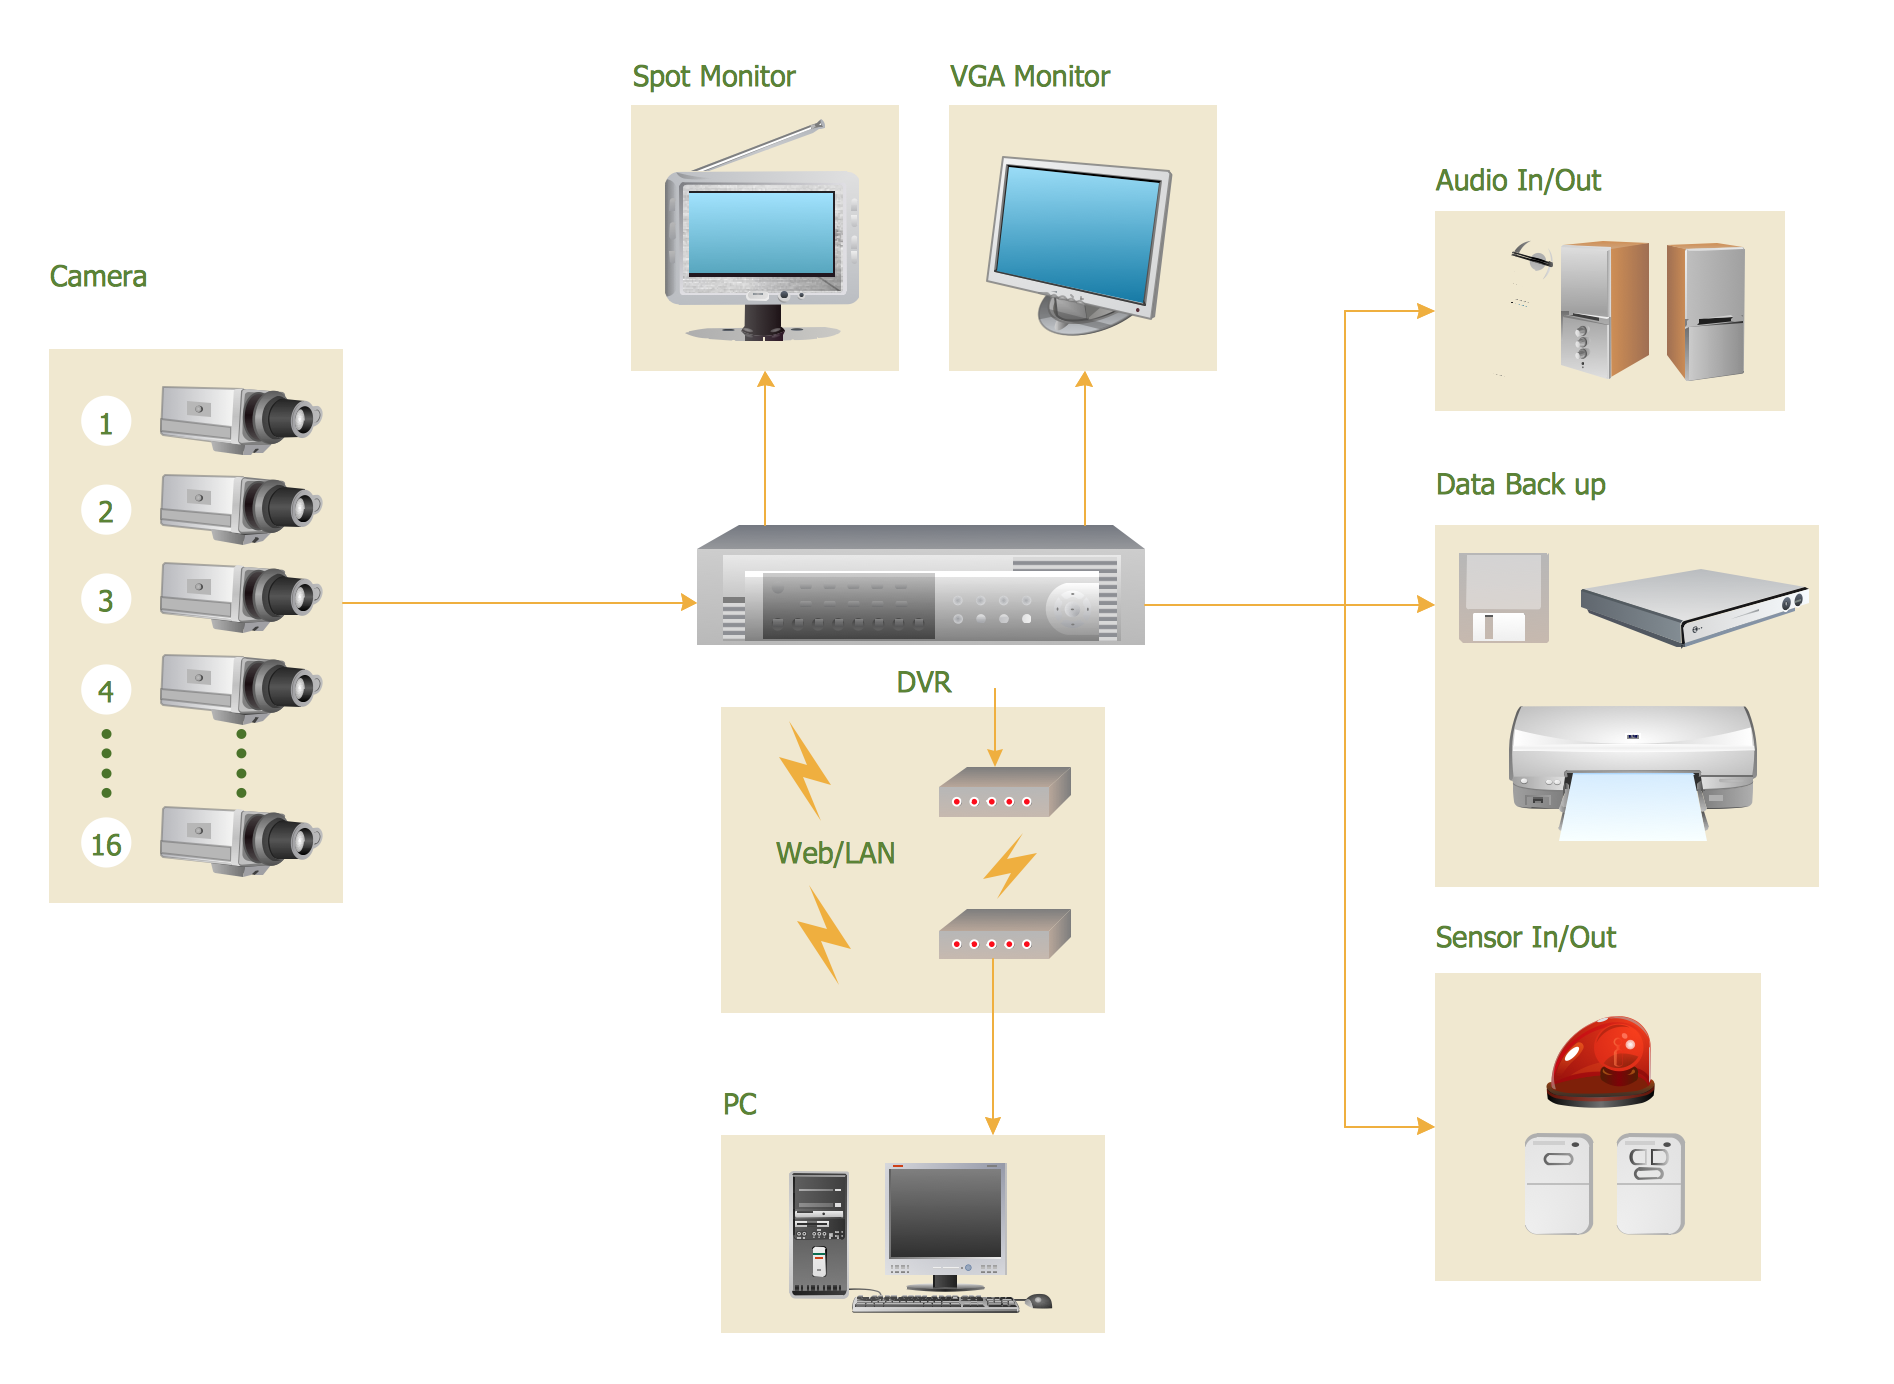
Picture: CCTV Surveillance System Diagram. CCTV Network Diagram Example
Related Solutions:


