Evernote exchange - Personal Productivity
ConceptDraw MINDMAP
Capture What You Think, Do What You Plan
ConceptDraw MINDMAP with the new Note Exchange solution allows to increase personal productivity. Using Mindmap methodology with Evernote exchange is competitive advantage now. Add more creative thoughts to your personal planning using Note Exchange solution.
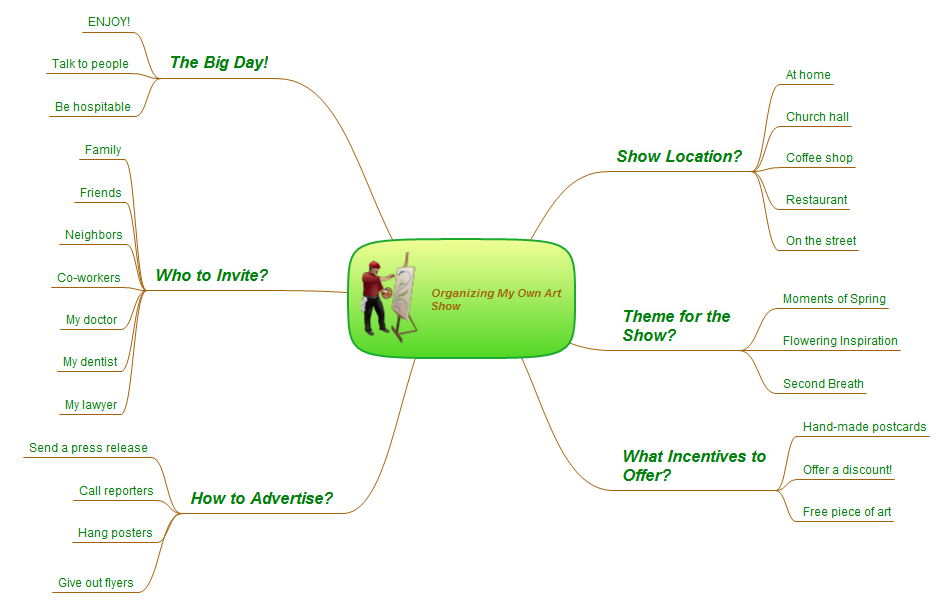
Pic 1. Mindmap - How to organize your own art show.
To plan any event, including your first art exhibit, just organize the details of the plan in ConceptDraw MINDMAP and then send it to Evernote to guide the preparation.
See also Samples of mind maps:
- Mind Maps
- Mind Maps — Marketing
- Mind Maps — Idea Communication
-
Mind Maps — Mind Map Exchange
- Mind Maps — Presentation Exchange
TEN RELATED HOW TO's:
Design efficiently the technical flow charts in ConceptDraw DIAGRAM software for various fields and provide ✔️ clarity, ✔️ accuracy, ✔️ usability, ✔️ simple communication, analysis, and improvement
Picture: Technical Flow Chart Example
Related Solution:
Learning English On-line using Skype. Mind map as a presentation makes it powerful tool for eLearning. E-Learning tools are slideshows, presentations, videos, mind maps.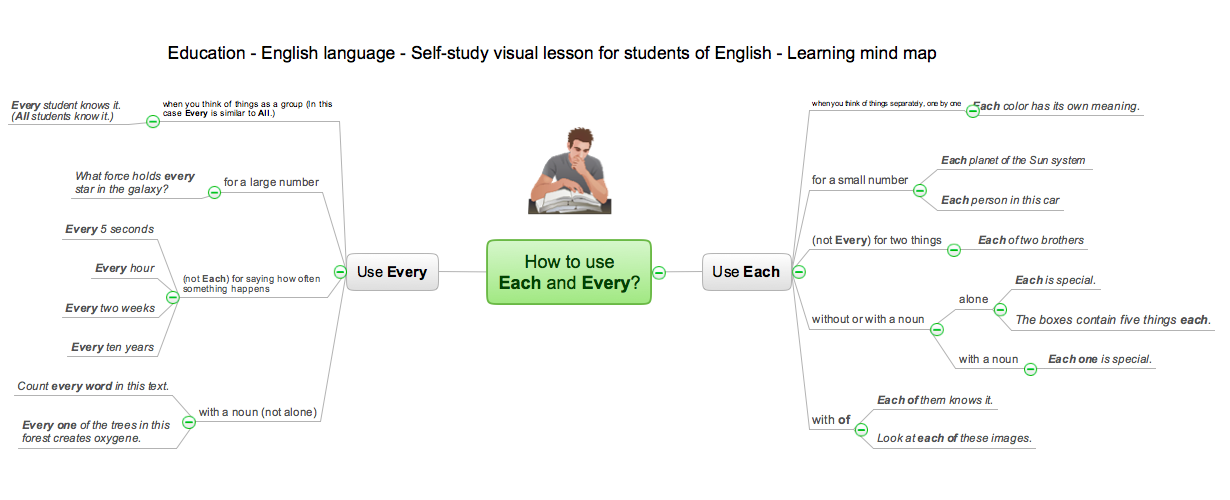
Picture: eLearning - Easy English on Skype
Related Solution:
How to make a Concept Map fast and easy? ConceptDraw DIAGRAM diagramming and vector drawing software extended with Concept Maps Solution from the Diagrams Area is the best choice for those who want design professional looking Concept Map in minutes.
Picture: How To Make a Concept Map
Related Solution:
The SWOT Analysis solution contains easy-to-use mind map templates that help identify Strengths, Weaknesses, Opportunities, and Threats, as well as outputs to ConceptDraw DIAGRAM for presenting analysis results.
Picture: SWOT Analysis
Related Solution:
A detailed mind map about the various elements and stages of project management.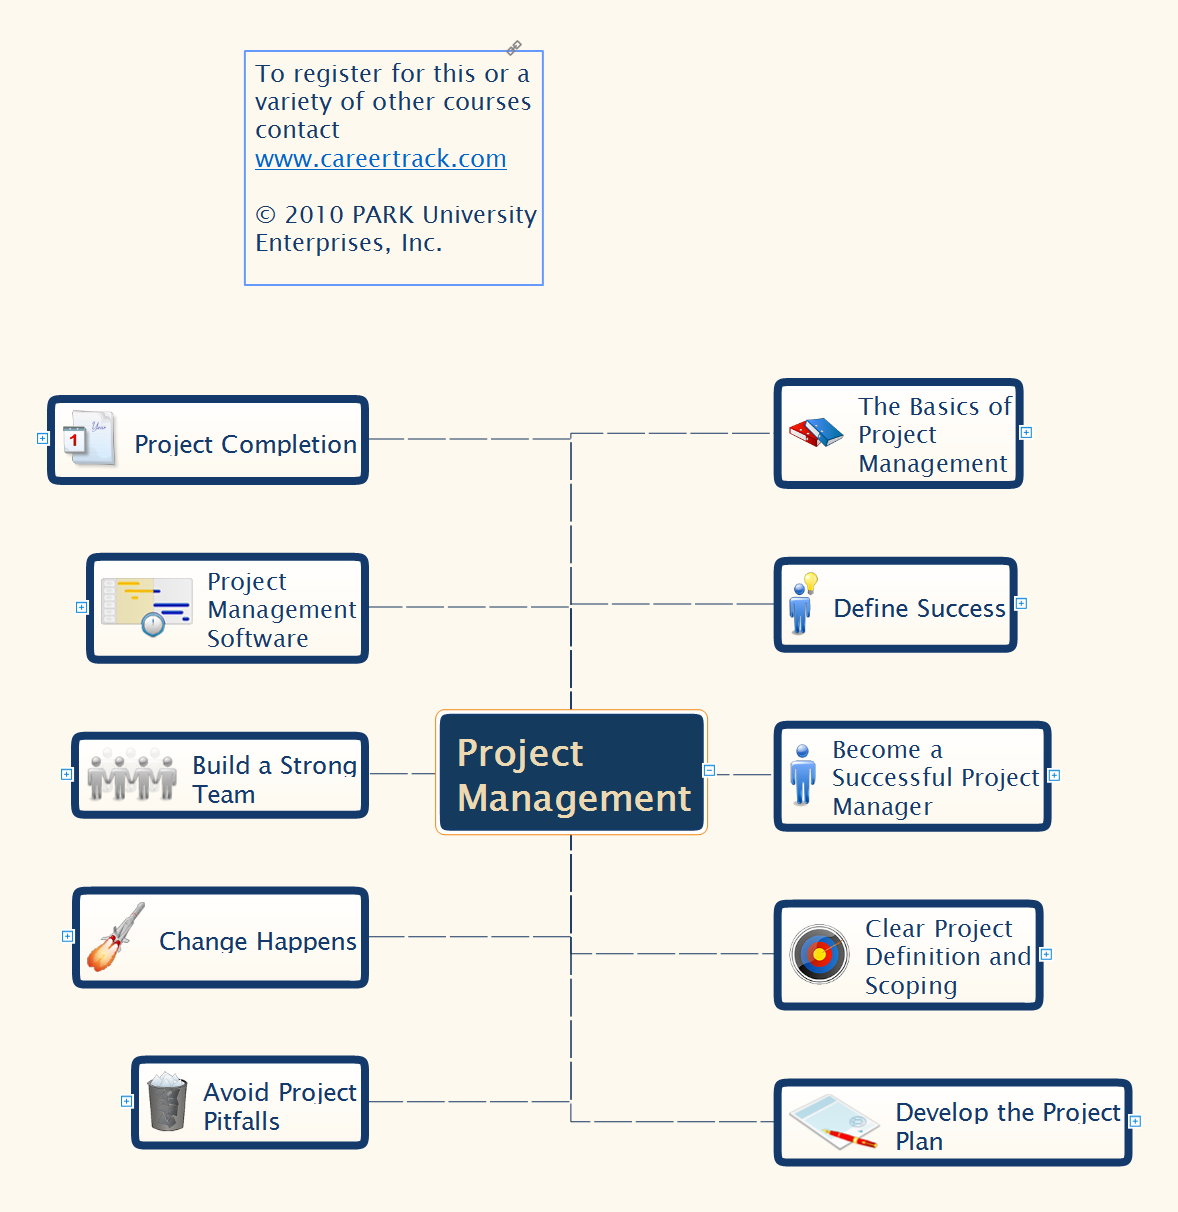
Picture: Project Management
Related Solution:
There are numerous articles about the advantages of flowcharting, creating business graphics and developing different charts. Nevertheless, these articles are almost useless without the main component - the examples of flowcharts, org charts and without a fine example, it is difficult to get all the conveniences of creating diagrams. You can find tons of templates and vivid examples on Solution Park.
This illustration shows a variety of business diagrams that can be created using ConceptDraw DIAGRAM. It comprises a different fields of business activities: management, marketing, networking, software and database development along with design of infographics and business illustrations. ConceptDraw DIAGRAM provides a huge set of sample drawings including business process modeling diagrams,, network diagrams, UML diagrams, orgcharts, DFD, flowcharts, ERD, geographical maps and more.
Picture: Examples of Flowcharts, Org Charts and More
Related Solution:
ConceptDraw MINDMAP supports sending the information from your mind map to your Evernote account.
Picture: Personal Memory Assistant
Related Solution:
Use ConceptDraw MINDMAP for creative thinking, planning, organization, problem solving, presentations, decision making, note taking, team brainstorming and other tasks.
Picture: Applications
A concept map is a way of representing relationships between ideas, images, or words.
How to draw a Concept Map quick, easy and effective? ConceptDraw DIAGRAM offers the unique Concept Maps Solution from the Diagrams Area that will help you!
Picture: Concept Map
Related Solution:
A flowchart is a powerful tool for examining processes. It helps improving processes a lot, as it becomes much easier to communicate between involved people, to identify potential problems and to optimize workflow. There are flowcharts of different shapes, sizes and types of flowchart vary from quite basic process flowcharts to complex program flowcharts. Nevertheless, all these diagrams use the same set of special symbols like arrows to connect blocks, parallelogram to show data receiving or rectangles for showing process steps.
Basic flowcharts are used to represent a simple process algorithm. A basic flowchart notation consists of rectangles (business processes), arrows (the flow of information, documents, etc.). The same notation is used in items such as the "decision", which allow you to do the branching. To indicate the start of the entire business process and its termination can be used the "Terminator" element. The advantages of Basic Flowchart are simplicity and clarity. With it you can quickly describe the business process steps. Creating of Basic Flowchart does not require any special knowledge, as easily understand by employees with different levels of education and IQ.
Picture: Types of Flowchart: Comprehensive Overview
Related Solution:
ConceptDraw
MINDMAP 16