
Pic. 1. Business Process Elements: Swimlanes (BPMN 1.2, BPMN 2.0)
The Swimlanes library design elements provides a visual mechanism of organizing and categorizing activities in BPMN 2.0 diagrams.
Use Pool type Swimlane objects to show major participants in your business process.
Use Lane type Swimlane elements to visually organize and categorize activities in a pool by function or role.

Pic. 2. Business Process Diagram using swimlanes elements
Use the ready objects from the libraries of Business Process Diagram Solution for ConceptDraw DIAGRAM BPM Software and also collection of Business Process Diagram examples, samples and templates to create your own professional looking BPMN Diagrams of any complexity quick, easy and effective.

Pic. 3. Business Process Diagram solution
All source documents are vector graphic documents. They are available for reviewing, modifying, or converting to a variety of formats (PDF file, MS PowerPoint, MS Visio, and many other graphic formats) from the ConceptDraw STORE. The Business Process Diagram Solution is available for all ConceptDraw DIAGRAM or later users.
TEN RELATED HOW TO's:
One of the most popular option helps to draw diagrams faster is pre-designed set of examples related to each kind of diagram. ConceptDraw DIAGRAM software extended with the Workflow Diagrams solution delivers a complete set of workflow process examples helps you to start making your own workflow faster.
Picture: Workflow Process Example
Related Solution:
The most easier way of creating the visually engaging and informative Sales Process Flowchart is to create the new ConceptDraw document and to use the predesigned vector symbols offered in 6 libraries of the Sales Flowchart Solution. There are more than six types of sales process flow diagrams, ConceptDraw DIAGRAM software is flowchart maker which include six collections of extended flowchart symbols for effective diagramming. There are main collections of color coded flowchart symbols: Sales Department, Sales Steps, Sales Workflow, Sales Symbols and special set of Sales Arrows and Sales Flowchart.
Picture: Sales Process Flowchart Symbols
Related Solution:
Design efficiently the technical flow charts in ConceptDraw DIAGRAM software for various fields and provide ✔️ clarity, ✔️ accuracy, ✔️ usability, ✔️ simple communication, analysis, and improvement
Picture: Technical Flow Chart Example
Related Solution:
Computer networks nowadays are spread all across the world. The large number of parameters, such as geographic scale or communication protocols, can divide networks. One of the most common types of networks is called local area network (LAN). It convenient to represent network examples by means of diagrams.
This local area network (LAN) diagram provides an easy way to see the way the devices in a local network are interacted. The diagram uses a library containing specific symbols to represent network equipment , media and the end-user devices such as computers (PC, mac, laptop) , network printer, hubs, server and finally a modem. There are two types of network topologies: physical and logical. The current diagram represents precisely a physical type of LAN topology because it refers to the physical layout of a local network equipment.
Picture:
What is a Local Area Network?
Examples of LAN Diagrams
Related Solution:
ConceptDraw DIAGRAM - workflow software extended with the Workflow Diagram solution provides a complete set of samples, templates and features help you to draw diagrams faster. A workflow software you use for drawing workflow diagrams and business process flow diagrams should provide a wide set of examples allows you get closer with workflow diagrams, learn symbols meaning, find appropriate layout and design, and then start drawing your own workflow diagram masterfully. Workflow diagrams used for orchestrating organizational processes between company departments and humans, so critical process diagrams used to train many people to interact must be clear and professional to convey an idea from a view. Thats a reason we created a lot workflow symbols and workflow icons collected them into special Workflow Diagram solution in ConceptDraw Solution Park.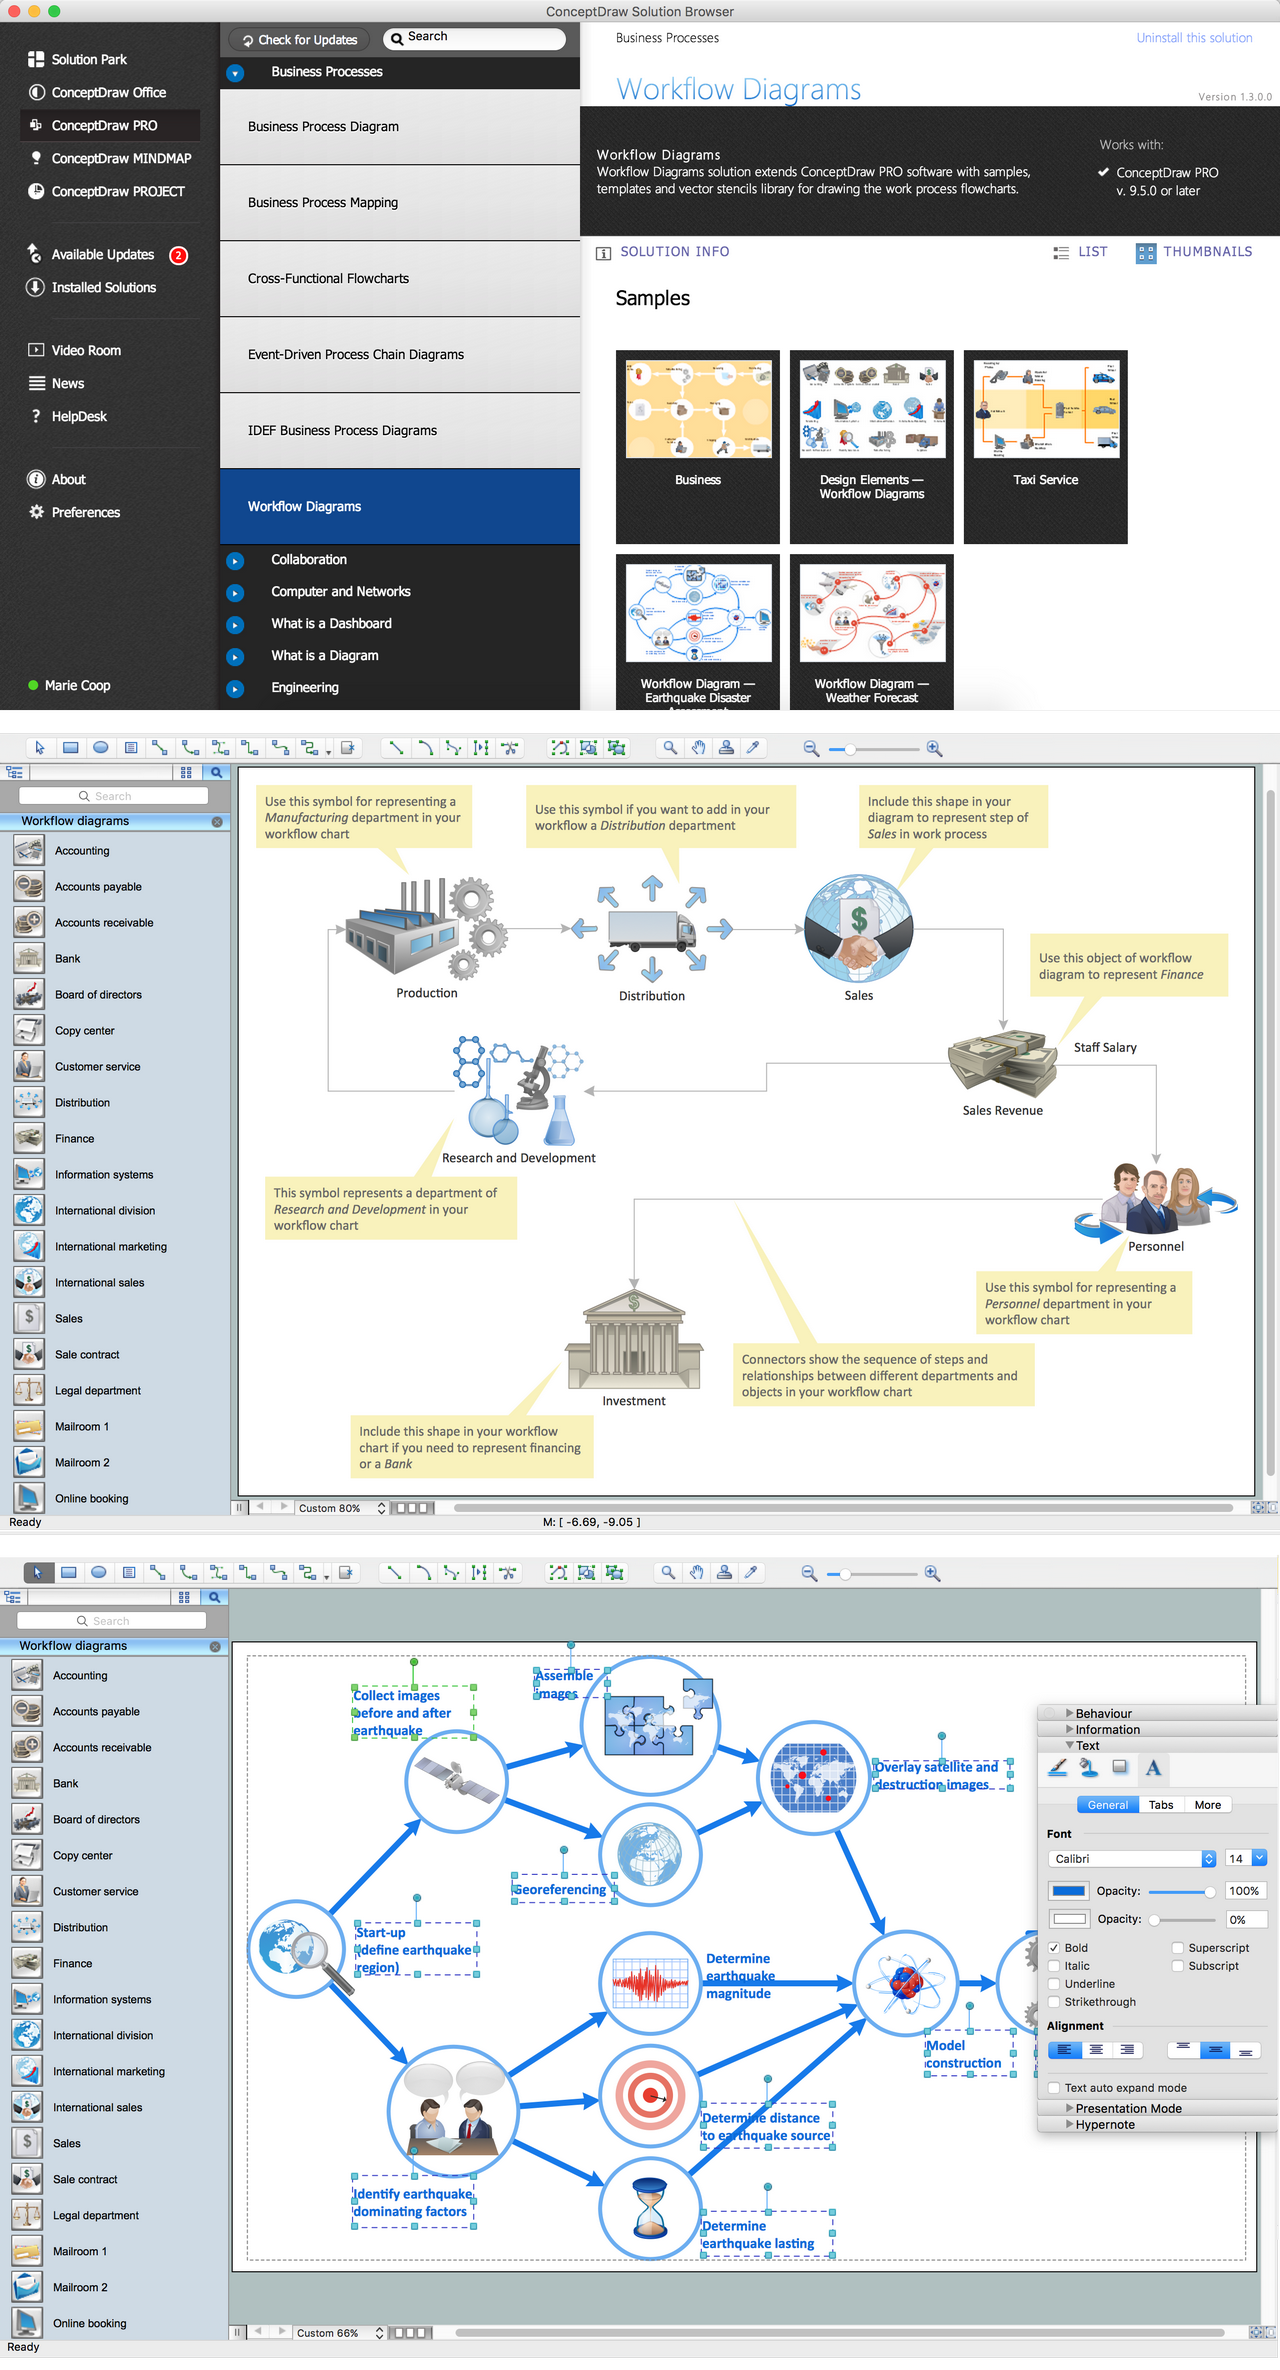
Picture: Workflow Diagram Examples
Related Solution:
This sample shows the Business Process Reengineering Diagram, displays the Continuous Improvement Process (CIP) directed at the permanent improvement of the processes. This sample can be used in business process management, quality management, project management and program management.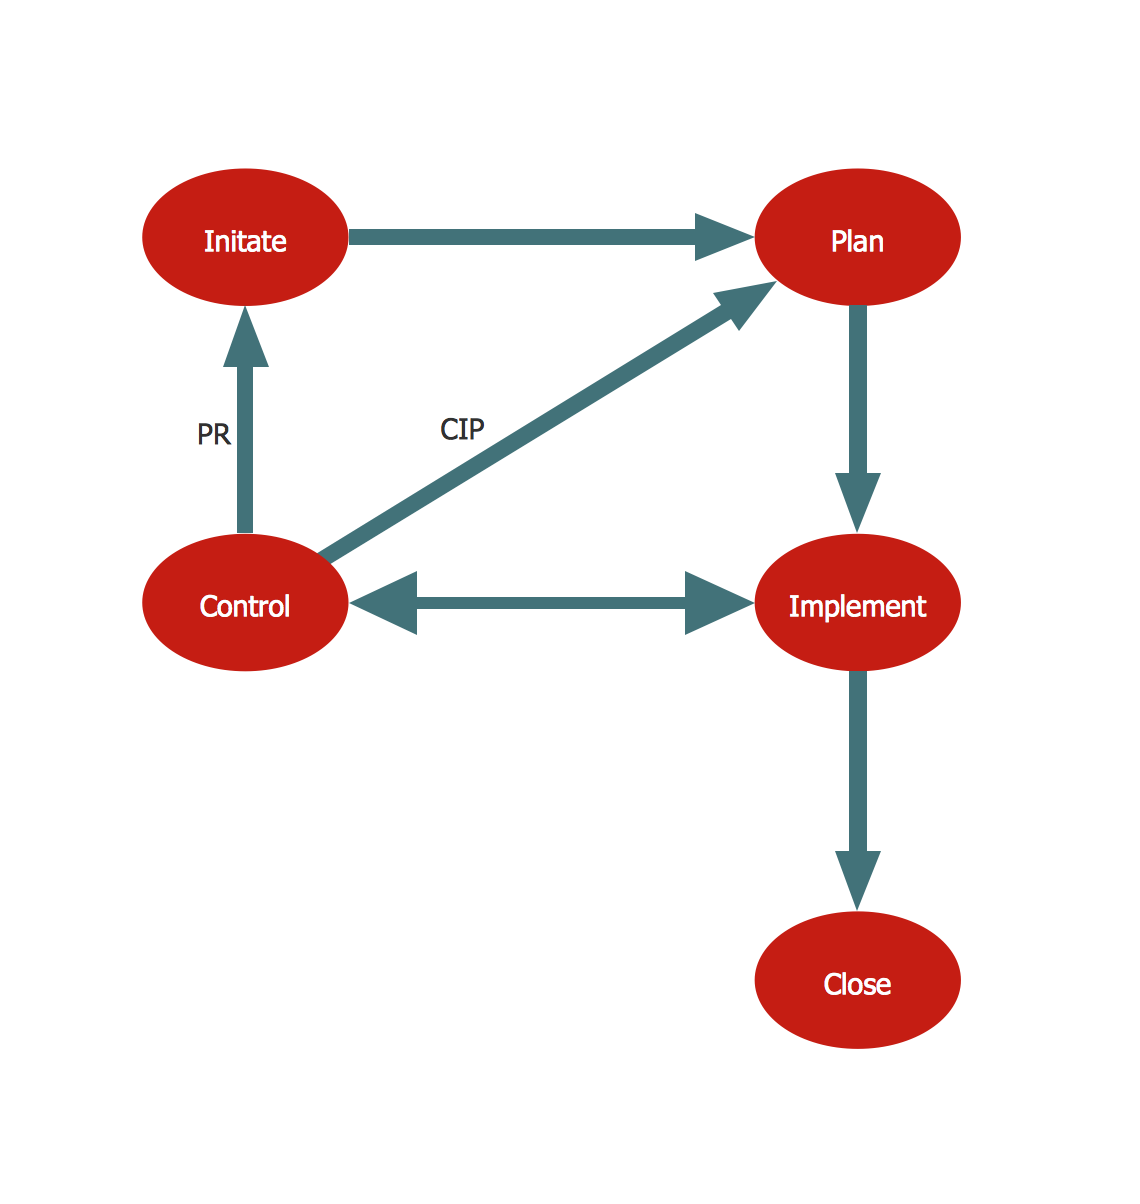
Picture: Business Process Reengineering. Business Process Example
Related Solution:
Cross-functional (deployment) flowcharts visualize what functional units (people, departments or functional areas) are responsible for the business process operations.
The flowcharts are divided into rows/columns of functional units. Blocks of various shapes represent the process steps, and are placed in rows/columns of the responsible functional units.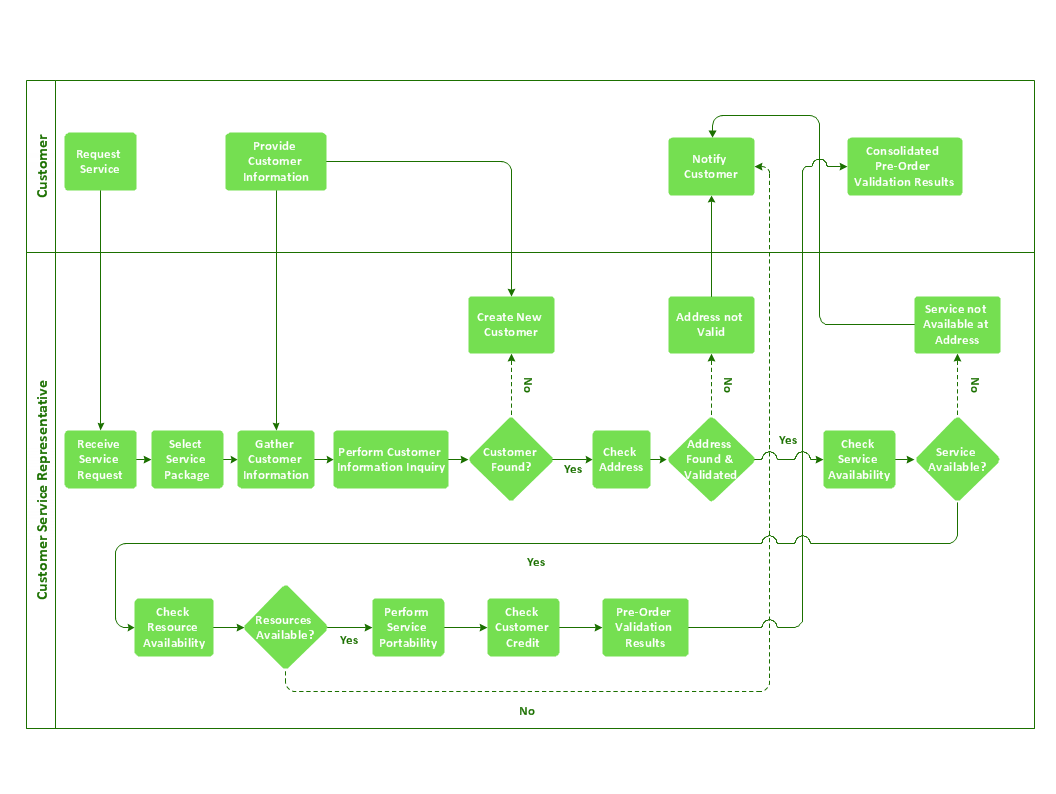
Picture: Business Process Flowchart
Related Solution:
To describe the accounting processing use ConceptDraw Flowchart set of symbold created for Accounting data processing.
Tips, Methods and Symbols on How to Create Flowcharts for an Accounting Information System.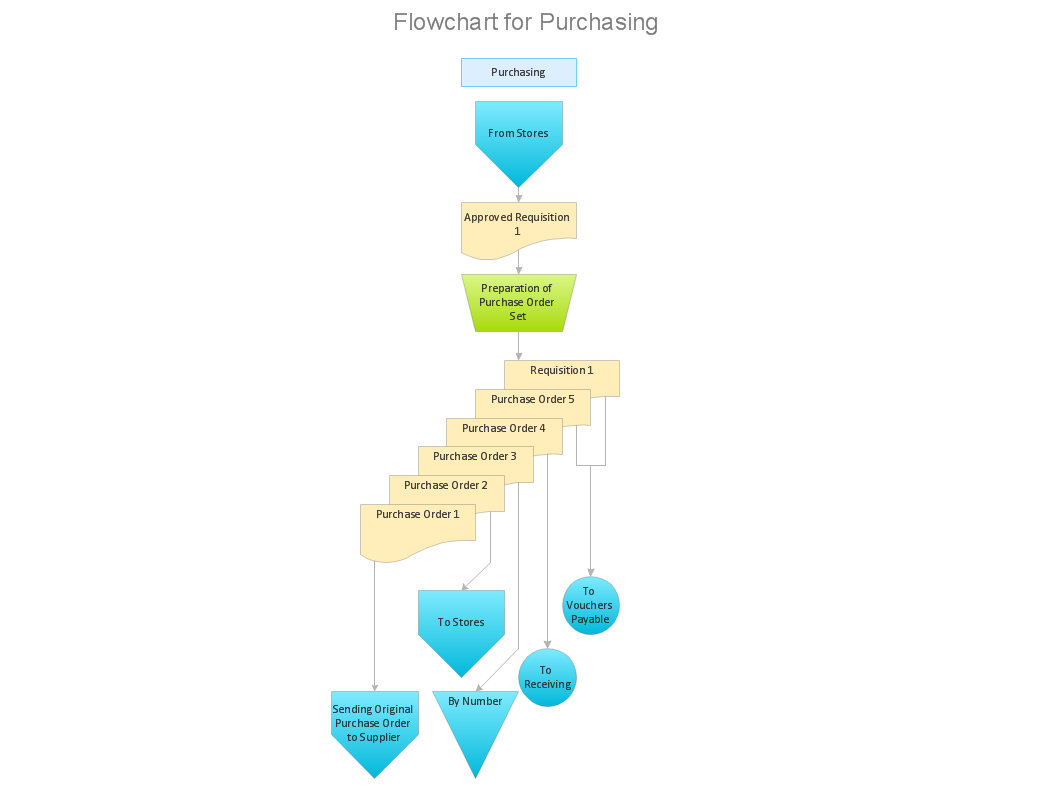
Picture: How Do You Make An Accounting Process Flowchart?
Related Solution:
Designing a workspace or office involves careful consideration of form and function. Conceptdraw offers you all nessesary office design elements in one library. Combine, match, design and create!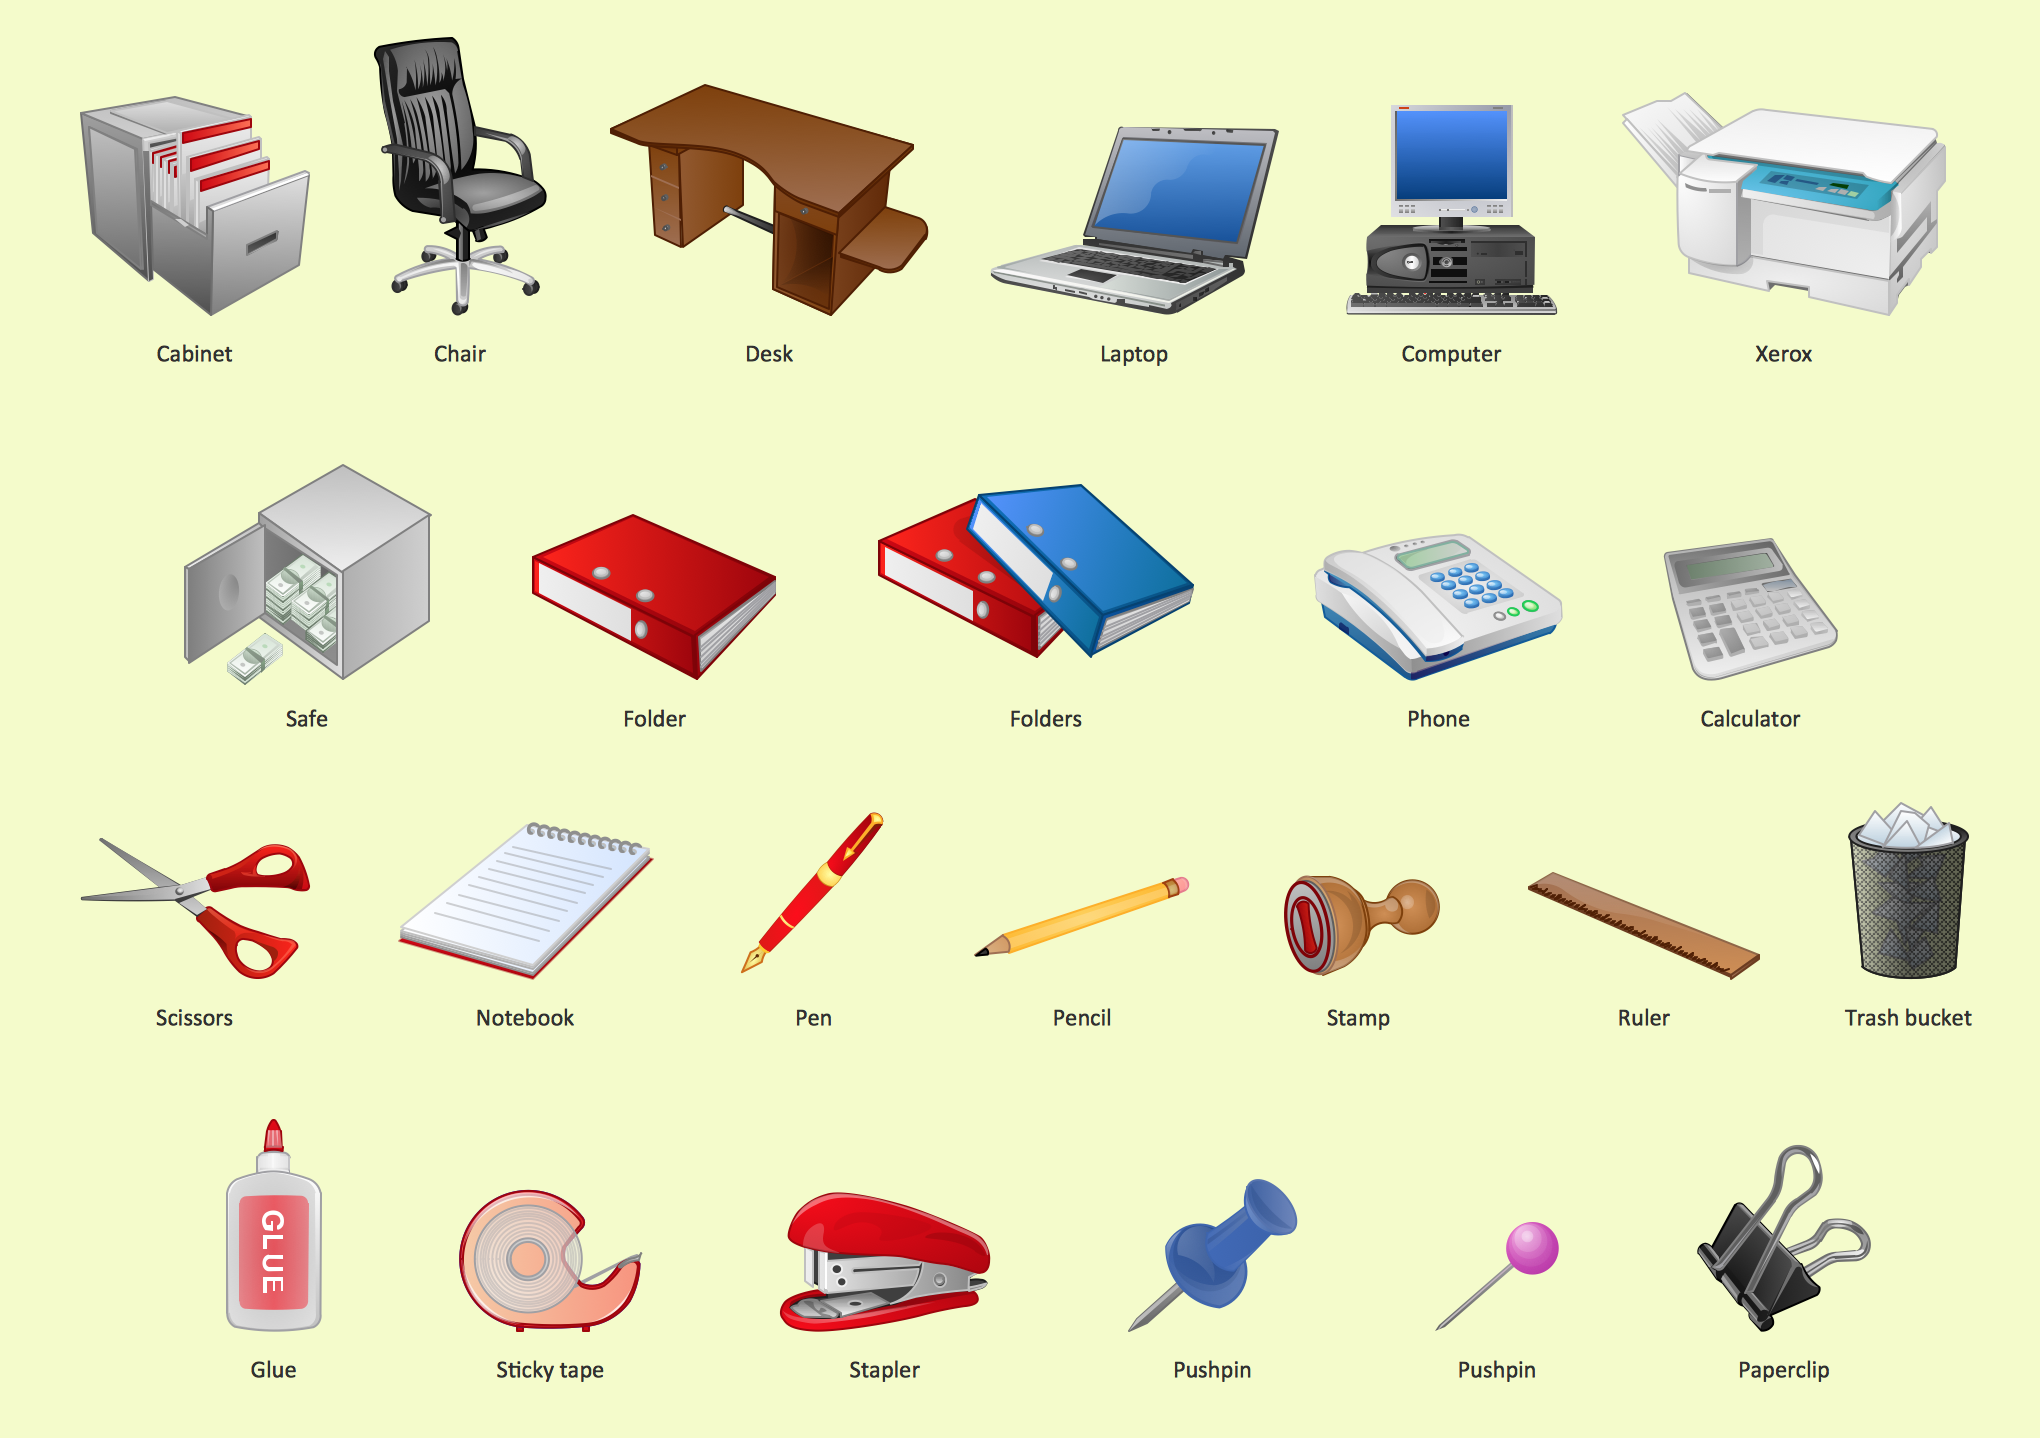
Picture: Office - Design Elements
Related Solution:
Connecting objects manually in ConceptDraw DIAGRAM is a snap:
- points;
- Connecting groups of objects;
- Auto-routing;
- Connectors text;
- Snap to Guides ;
- Quick.
Picture: ConceptDraw Arrows10 Technology

