Examples of Flowchart Diagram
ConceptDraw DIAGRAM
ConceptDraw DIAGRAM is a flowchart software. This software includes flowchart diagram examples set. Libraries contain vector stencils that allow users to use RapidDraw technology.

Users can start draw their own flowchart diagrams from existing examples by clicking on direction arrows.

Sample 1. Flowchart — Synthetic Object Construction
This flow chart example displays planning scheme for the construction of a synthetic object.
TEN RELATED HOW TO's:
Take a look on an example of Cross-Functional-Flowchart, showing the software service cross-function process flowcharts among the different departments. It presents a simple flowchart among the customer, sales, technical support, tester and development.
Try now Flowchart Software and Cross-Functional library with 2 libraries and 45 vector shapes of the Cross-Functional Flowcharts solution. Then you can use built-in templates to create and present your software service cross-function process flowcharts.
Picture: Cross Functional Flowchart Examples
Processing Flow Chart is a simplified sketch used in chemical and process engineering to illustrate general plant streams, major equipment, and key control loops. ConceptDraw DIAGRAM enhanced with Flowcharts Solution is ideal software for designing ✔️ Processing Flow Charts, ✔️ Process Flow Charts, ✔️ Flow Chart Process Maps
Picture: Processing Flow Chart
Related Solution:
Don't let your first glance fool you. ConceptDraw is a lot easier to use than it looks. Use its cross-functional templates and library as basics to get started.
All you need to know are a few basic steps and terms.
ConceptDraw Arrows10 Technology is a new age in drawing software. Use it for process flows and its new rapid draw feature enables to draw an impressive charts in a seconds.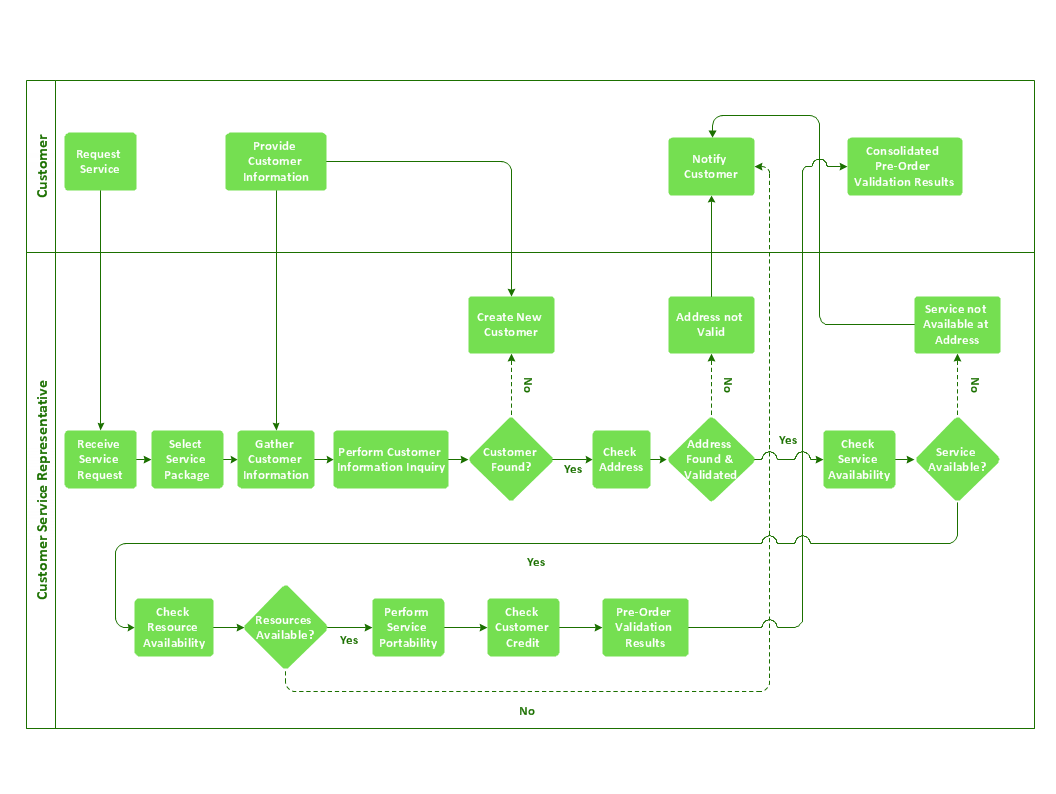
Picture: Cross-Functional Flowchart Basics
A causal model is an abstract concept, that describes the causal mechanisms of a system, by noting certain variables and their influence on each other, in an effort to discover the cause of a certain problem or flaw. This model is presented in diagram form by using a fishbone diagram.
ConceptDraw DIAGRAM diagramming and vector drawing software enhanced with Fishbone Diagrams solution helps you create business productivity diagrams from Fishbone diagram templates and examples, that provide to start using of the graphic method for the analysis of problem causes. Each predesigned Fishbone Diagram template is ready to use and useful for instantly drawing your own Fishbone Diagram.
Picture: Fishbone Diagram Template
Related Solution:
Competitor analysis is a first and obligatory step in elaboration the proper corporate marketing strategy and creating sustainable competitive advantage. Use powerful opportunities of numerous solutions from ConceptDraw Solution Park for designing illustrative diagrams, charts, matrices which are necessary for effective competitor analysis.
Picture: Competitor Analysis
Related Solution:
Use of various charts, diagrams and infographics is the most effective way of visual presenting information about healthy foods, healthy eating and healthy diet. ConceptDraw DIAGRAM diagramming and vector drawing software offers the Health Food solution from the Food and Beverage area of ConceptDraw Solution Park which is overfull of powerful drawing tools, libraries with ready-to-use vector objects and clipart, predesigned samples and examples which will help you easy design healthy foods illustrations.
Picture: Healthy Foods
Related Solution:
In ConceptDraw DIAGRAM it really is sp simple to draw even the most complex cross-functional flowcharts. Use the RapidDraw technology and Cross-Functional libraries in ConceptDraw DIAGRAM for the best results.
Picture: How to Simplify Flow Charting — Cross-functional Flowchart
Related Solution:
ConceptDraw Flowcharts visualize a process or algorithm of program as step/operation blocks of various shapes connected with arrowed lines showed the process flow direction. They are used to visualize business or technical processes and software algorithms.
Picture: Selecting & Creating Flowcharts
Related Solution:
ConceptDraw DIAGRAM diagramming and vector drawing software extended with Sales Flowcharts solution from the Marketing area of ConceptDraw Solution Park offers the set of extensive tools for quick and easy drawing professional looking Sales Process Flowcharts.
Picture: Sales Process Flowcharts
Related Solution:
ConceptDraw has 142 vector stencils in the 8 libraries that helps you to start using software for designing own Business Process Diagrams. Use Swimlanes library with 20 objects from BPMN.
Picture: Business Process Elements: Swimlanes
Related Solution:
ConceptDraw
DIAGRAM 18