How To Share Presentation via Skype
Remote Presentation:
With our presentation software called ConceptDraw MINDMAP you are able to Share Presentation via Skype.
ConceptDraw MINDMAP allows to hold remote learning, remote training, web conferences and webinars to represent any kind of information in a form of mind map.
- Deliver presentation via Skype
- Provide learing session
- Conduct webinar presentation
- Share presentation documents
- Hold team briefing
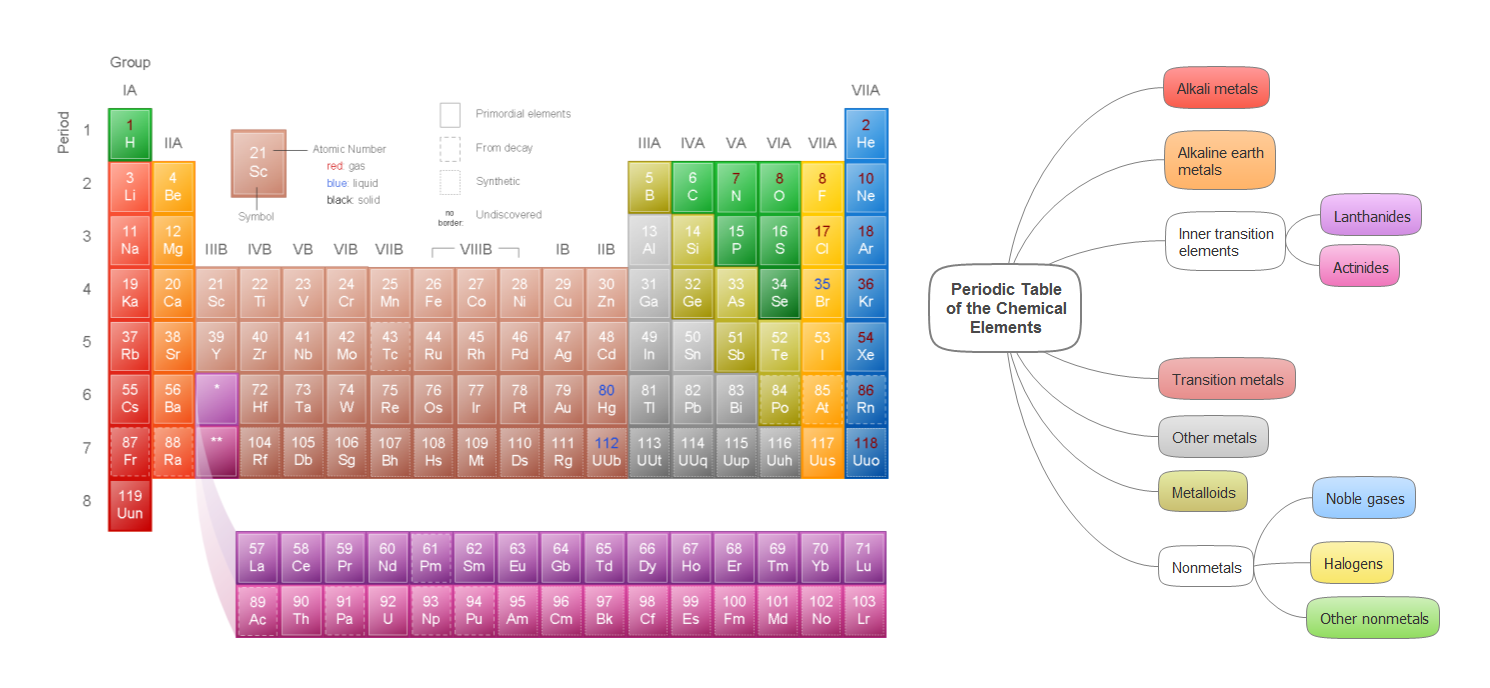
Sample 1. Periodic table of the chemical elements
Periodic table of the chemical elements mind map sample is created using ConceptDraw MINDMAP mind mapping software. This mind map example helps to learn how to share mindmap presentation via Skype.
Use this mindmap example implementing the Remote Presentation for Skype solution from ConceptDraw Solution Park.
See also Samples:
TEN RELATED HOW TO's:
Using mind mapping in education is very popular way to make your lecture materials more structural and clear both for you and for students. At remote learning session your students also can make notes or type questions to the current slides without interrupting slide show.
Picture: Presentations in Educational Process
Related Solution:
What are the favorite educational technology tools and techniques for teachers? Of course these are pictures, images and education infographics! ConceptDraw DIAGRAM software supplied with Education Infographics Solution from the Business Infographics Area provides powerful drawing tools to help design the education infographics of any complexity.
Picture: Educational Technology Tools
Related Solution:
During the planning, discussing and execution of a project you may need to prepare a presentation using project views such as the Gantt Chart, Multiproject Dashboard or Resource Usage View. It’s easy do with ConceptDraw PROJECT!
Picture: How to Create Presentation of Your Project Gantt Chart
Creating and organizing presentations, structuring received presentations, presenting mind maps, and preparing for public presenting.
Picture: How to Deliver Presentations using Mind Maps
Related Solution:
This sample shows the Flowchart of the ACC general account creation. This Flowchart describes the Start point, the process of the handling the user requests and the End point – creating of the account. The shapes represent the subprocesses and the arrows between the shapes shows the sequence of the actions.
This sample was created in ConceptDraw DIAGRAM diagramming and vector drawing software using the Flowcharts solution from the Diagrams area of ConceptDraw Solution Park.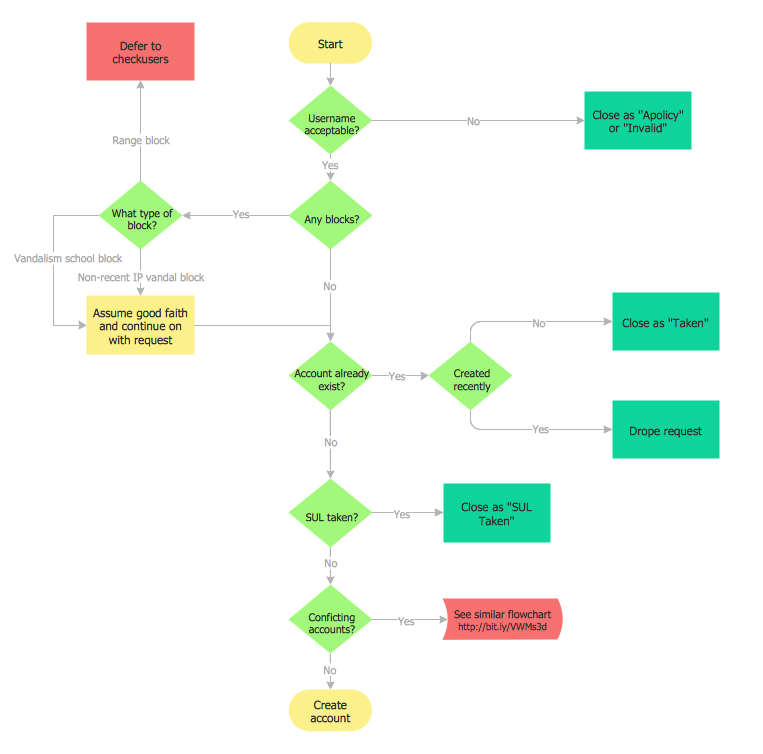
Picture: Examples of Flowchart
Related Solution:
ConceptDraw DIAGRAM extended with Cross-Functional Flowcharts Solution from the Business Processes Area is a powerful software which offers a variety of Cross Functional Flowchart examples. The use of predesigned examples as the base for your own Cross Functional Flowchart Diagrams is a timesaving and useful way.
Picture: Cross Functional Flowchart Examples
Related Solution:
A process flow chart is a sequence diagram on events, actions, tasks and decisions that are visualized in a form of inputs and outputs. Such flow chart involves a defined number of standard symbols and notation keys used to help one understand and pass the information.
Process flow charts have become a day-to-day tool for chemical engineers, technologists and production engineers as well as software developers. However, their use has recently increased in other areas such as business, manufacturing and, especially a service sector.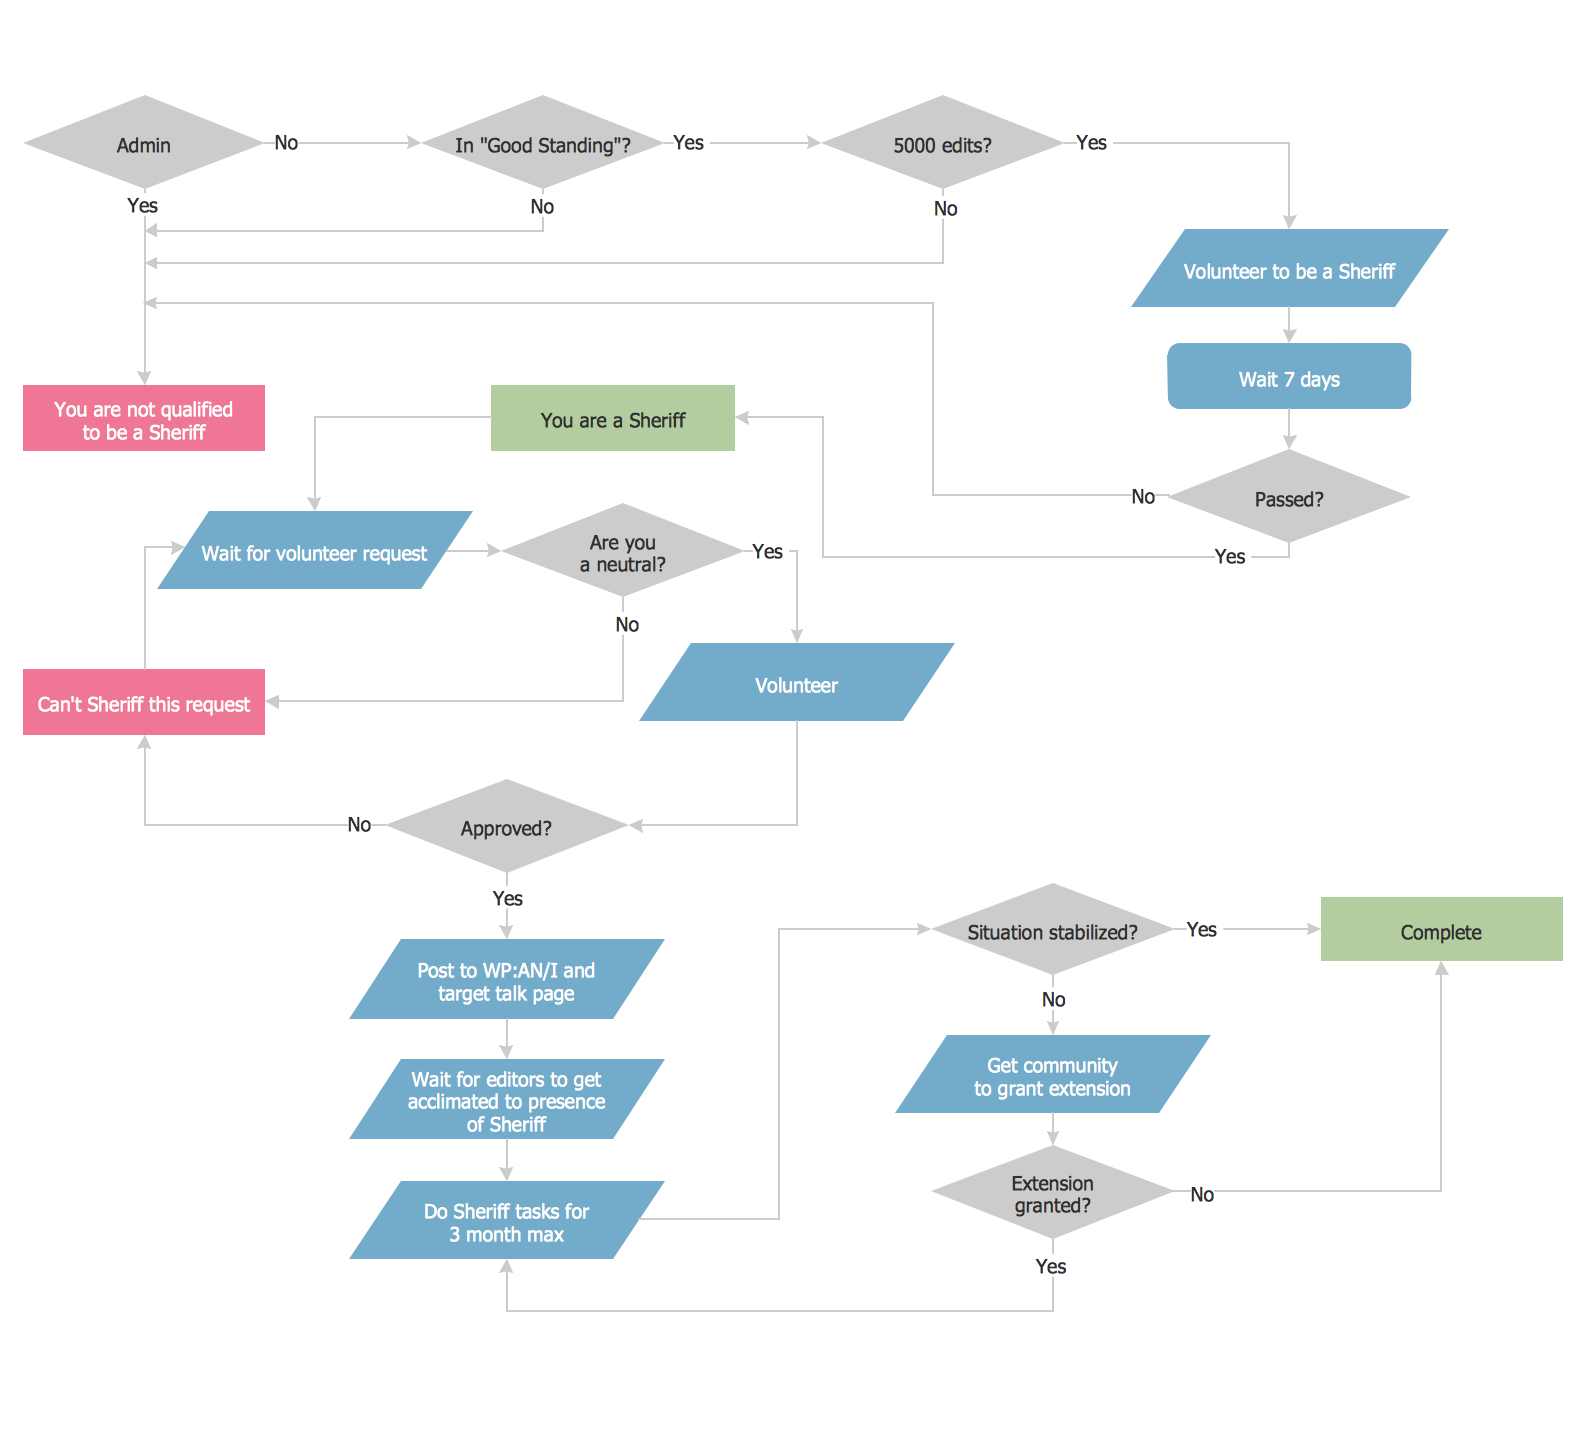
Picture: Example Process Flow Chart
Related Solution:
ConceptDraw MINDMAP can export to MS Project file from a mind map; it can also import a project file from MS Project giving team members who use Macintosh or Windows, a working visual map of a planned project. The ability to import/export MS Project files is made possible because of the Project Exchange solution.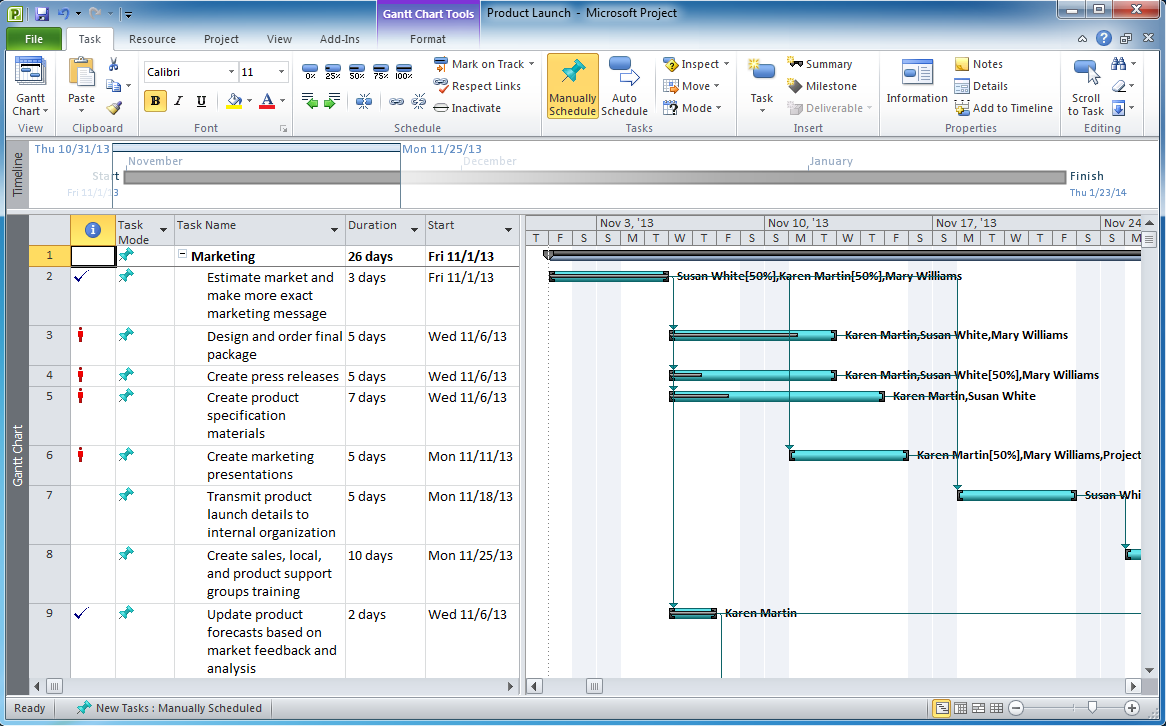
Picture: Export from ConceptDraw MINDMAP to MS Project® XML
Related Solution:
Electrical rotating machines, such as motors and generators, are vital assets for any power plant or large industrial company.
An electric motor is an electrical machine that converts electrical energy into mechanical energy. The reverse of this would be the conversion of mechanical energy into electrical energy and is done by an electric generator.
In normal motoring mode, most electric motors operate through the interaction between an electric motor's magnetic field and winding currents to generate force within the motor. In certain applications, such as in the transportation industry with traction motors, electric motors can operate in both motoring and generating or braking modes to also produce electrical energy from mechanical energy.
26 libraries of the Electrical Engineering Solution of ConceptDraw DIAGRAM make your electrical diagramming simple, efficient, and effective. You can simply and quickly drop the ready-to-use objects from libraries into your document to create the electrical diagram.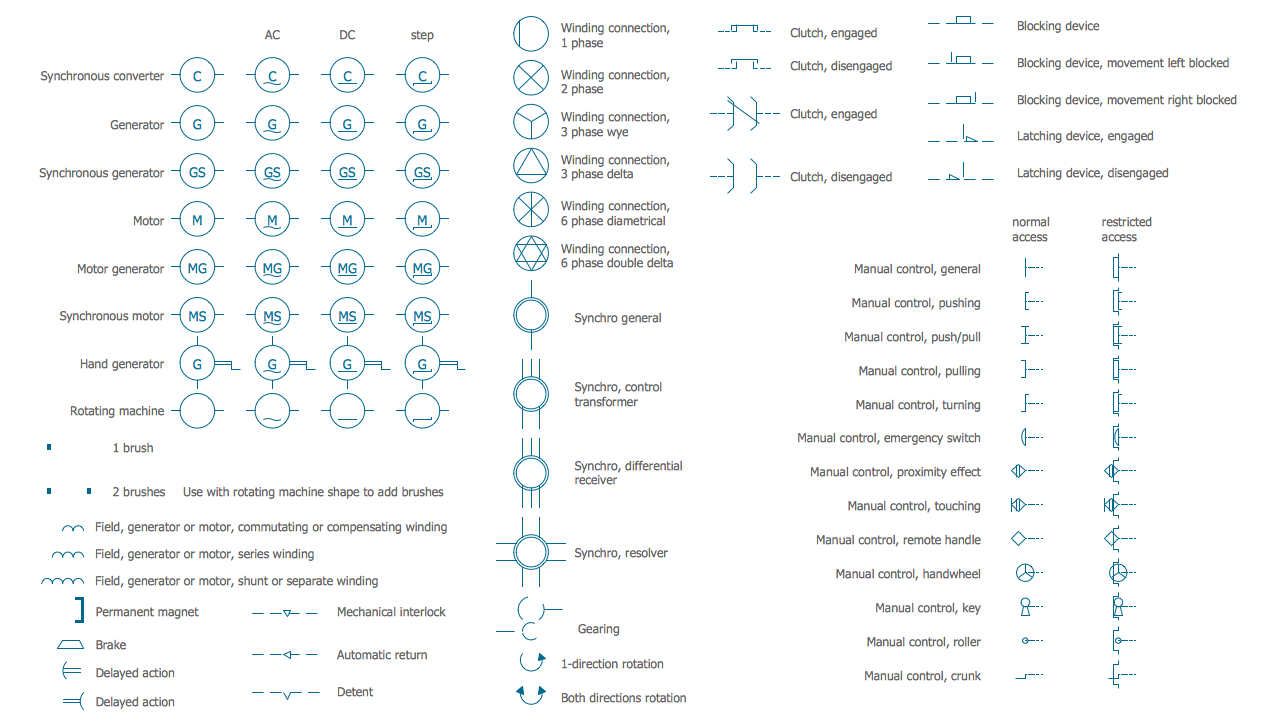
Picture: Electrical Symbols — Rotating Equipment
Related Solution:
ConceptDraw DIAGRAM is a flowchart design software. There are large collections of professional flowchart symbols for process flow diagrams, standard flowchart symbols and colored basic flowchart symbols. Built-in examples and video lessons allow users to get started immediately and do drawing of virtually any type of flowchart or process flow diagrams
Picture: Flow Chart Creator
Related Solution:
ConceptDraw
MINDMAP 16