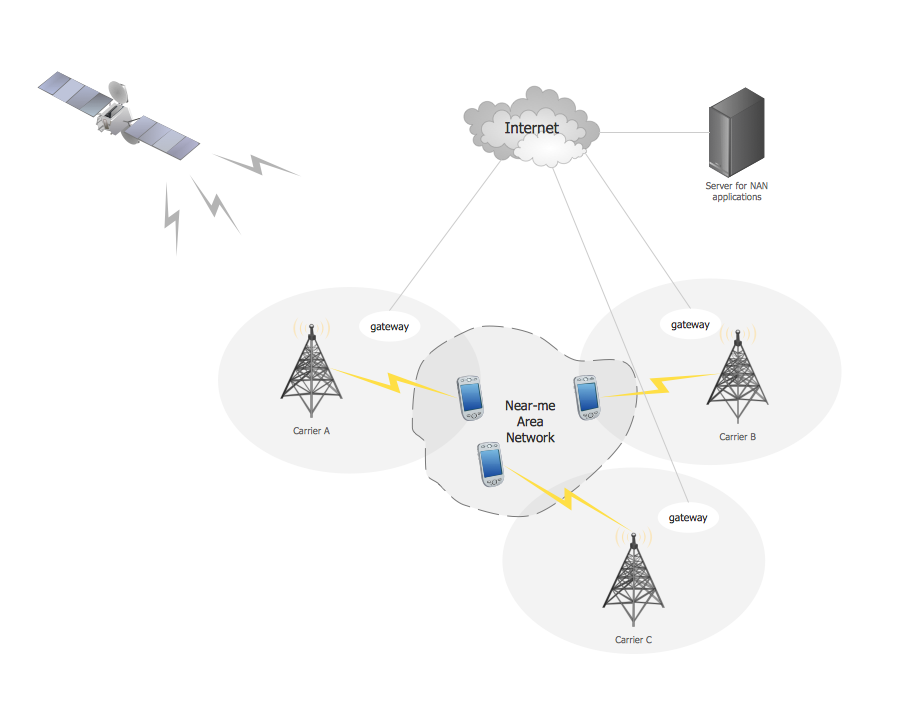
Example 1. Near-me area networks (NAN). Computer and Network Examples
This example was created in ConceptDraw DIAGRAM using the Computer and Networks Area of ConceptDraw Solution Park and shows the Near-me area network.
All networks designed with ConceptDraw DIAGRAM are vector graphic documents and are available for reviewing, modifying, and converting to a variety of formats (image, HTML, PDF file, MS PowerPoint Presentation, Adobe Flash or MS Visio).
See also Samples:
TEN RELATED HOW TO's:
Collaborating with co-workers is very important, not only in order to get things done effectively, but also to keep in touch with the outside world. Great way for business collaboration is Skype.
Picture: Online Collaboration via Skype
Related Solution:
The Enhanced Interior Gateway Routing Protocol (EIGRP) is a progressive distance-vector dynamic routing protocol. It was developed by the Cisco Systems and is available as an open standard from 2013.
EIGRP is used to help automate routing decisions and configuration of the computer network. It allows the routers of the same logical area automatically share route information.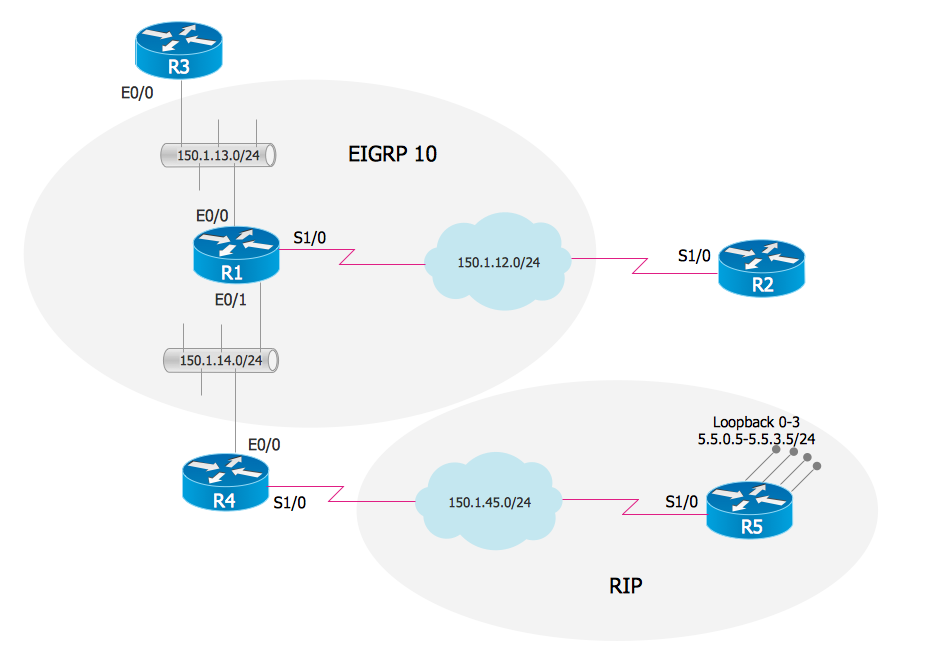
Picture: EIGRP. Computer and Network Examples
Related Solution:
ConceptDraw DIAGRAM is perfect for software designers and software developers who need to draw Network Layout Diagrams._Win_Mac.png)
Picture: Network Diagramming Software for Design Network Layout Diagrams
Related Solution:
Use ConceptDraw DIAGRAM with Accounting Flowcharts solution to document and communicate visually how accounting processes work, and how each operation is done.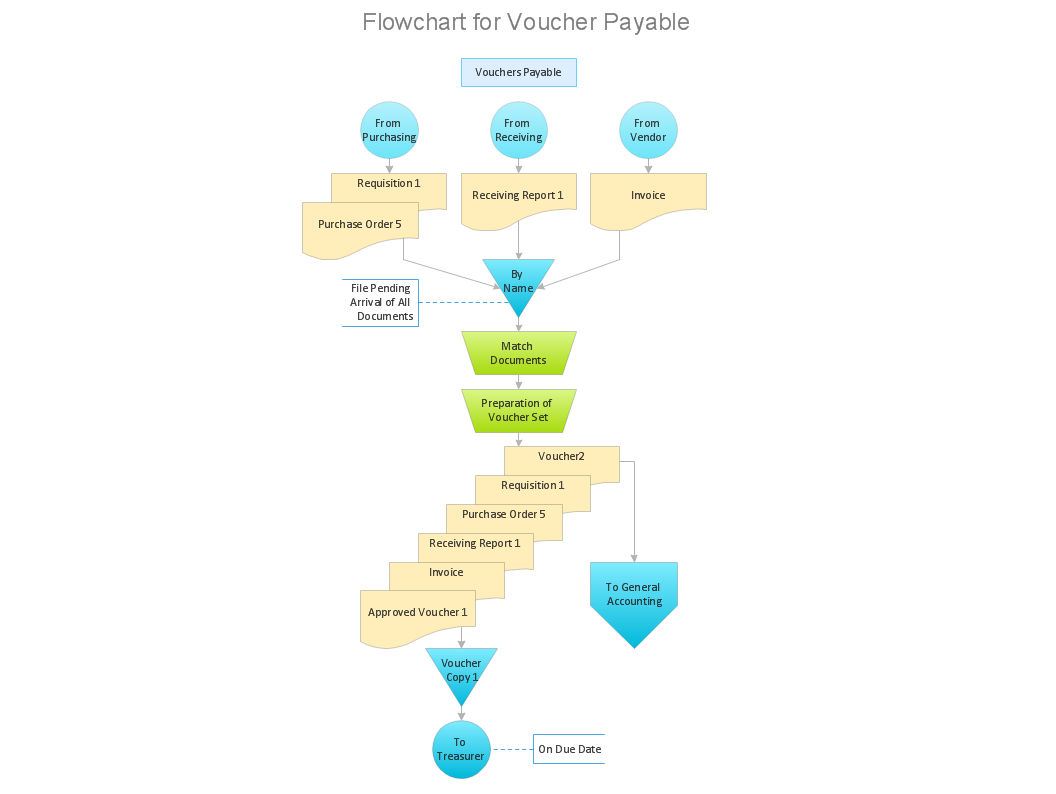
Picture: Accounting Flowchart: Purchasing, Receiving, Payable and Payment
Related Solution:
How To Draw an iPhone? It's very fast and easy to draw an iPhone and design iPhone user interface using the tools of ConceptDraw DIAGRAM extended with iPhone User Interface Solution. iPhone User Interface Solution offers you the incredibly large quantity of predesigned objects that are grouped to 9 libraries: Apps Icons, Bars, Content Views, Controls, iMessage, iPhone 6 Mockup, Tab Bar Icons, Temporary Views, Toolbar and Navigation Bar Buttons.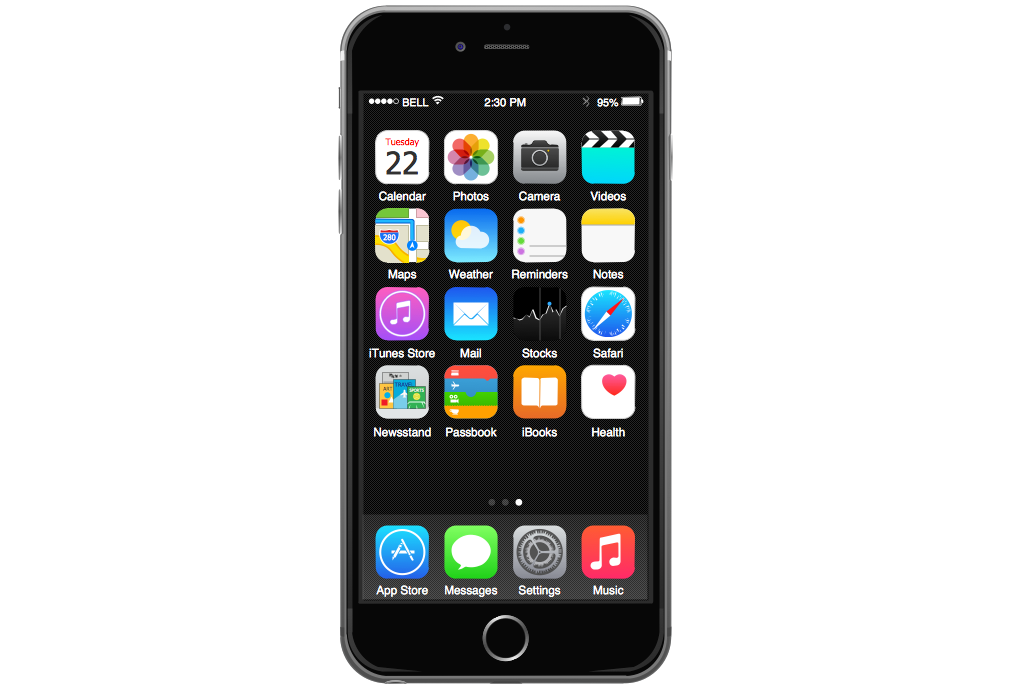
Picture: How To Draw an iPhone?
Related Solution:
ConceptDraw MINDMAP supports sending the information from your mind map to your Evernote account.
Picture: Personal Memory Assistant
Related Solution:
There are plenty of diagramming tools, the question is to choose the most suitable for your needs. For example, you can choose ConceptDraw DIAGRAM as organizational chart software and get fascinating results in a few minutes. An orgchart is useful for any corporation.
This is an example of a hierarchical organization scheme of the company. It has tree-like structure. Each middle manager is subordinated to a few employees, and he is accountable to one of the top managers. Every type of organizational composition of businesses may be presented in the view of an organizational chart that is supported by ConceptDraw Organisational Charts solution. There are number of ways of building a structure of business organization, establishing how it should function.
Picture: ConceptDraw DIAGRAM - Organizational chart software
Related Solution:
How to use mind map for developing scripts. An easy way to arrange information using Evernote and mind map. Making daily plan become more convenient with this integration.
Picture: Develop Scripts Exchanging Mind Maps with Evernote
Related Solution:
Usually the flow chart drawing is a quite complex and labor-intensive process, so it would be nice to have convenient drawing software. ConceptDraw DIAGRAM extended with Flowcharts Solution from the Diagrams Area of ConceptDraw Solution Park is ideal flow chart drawing software for engineers, developers, designers, and more other people.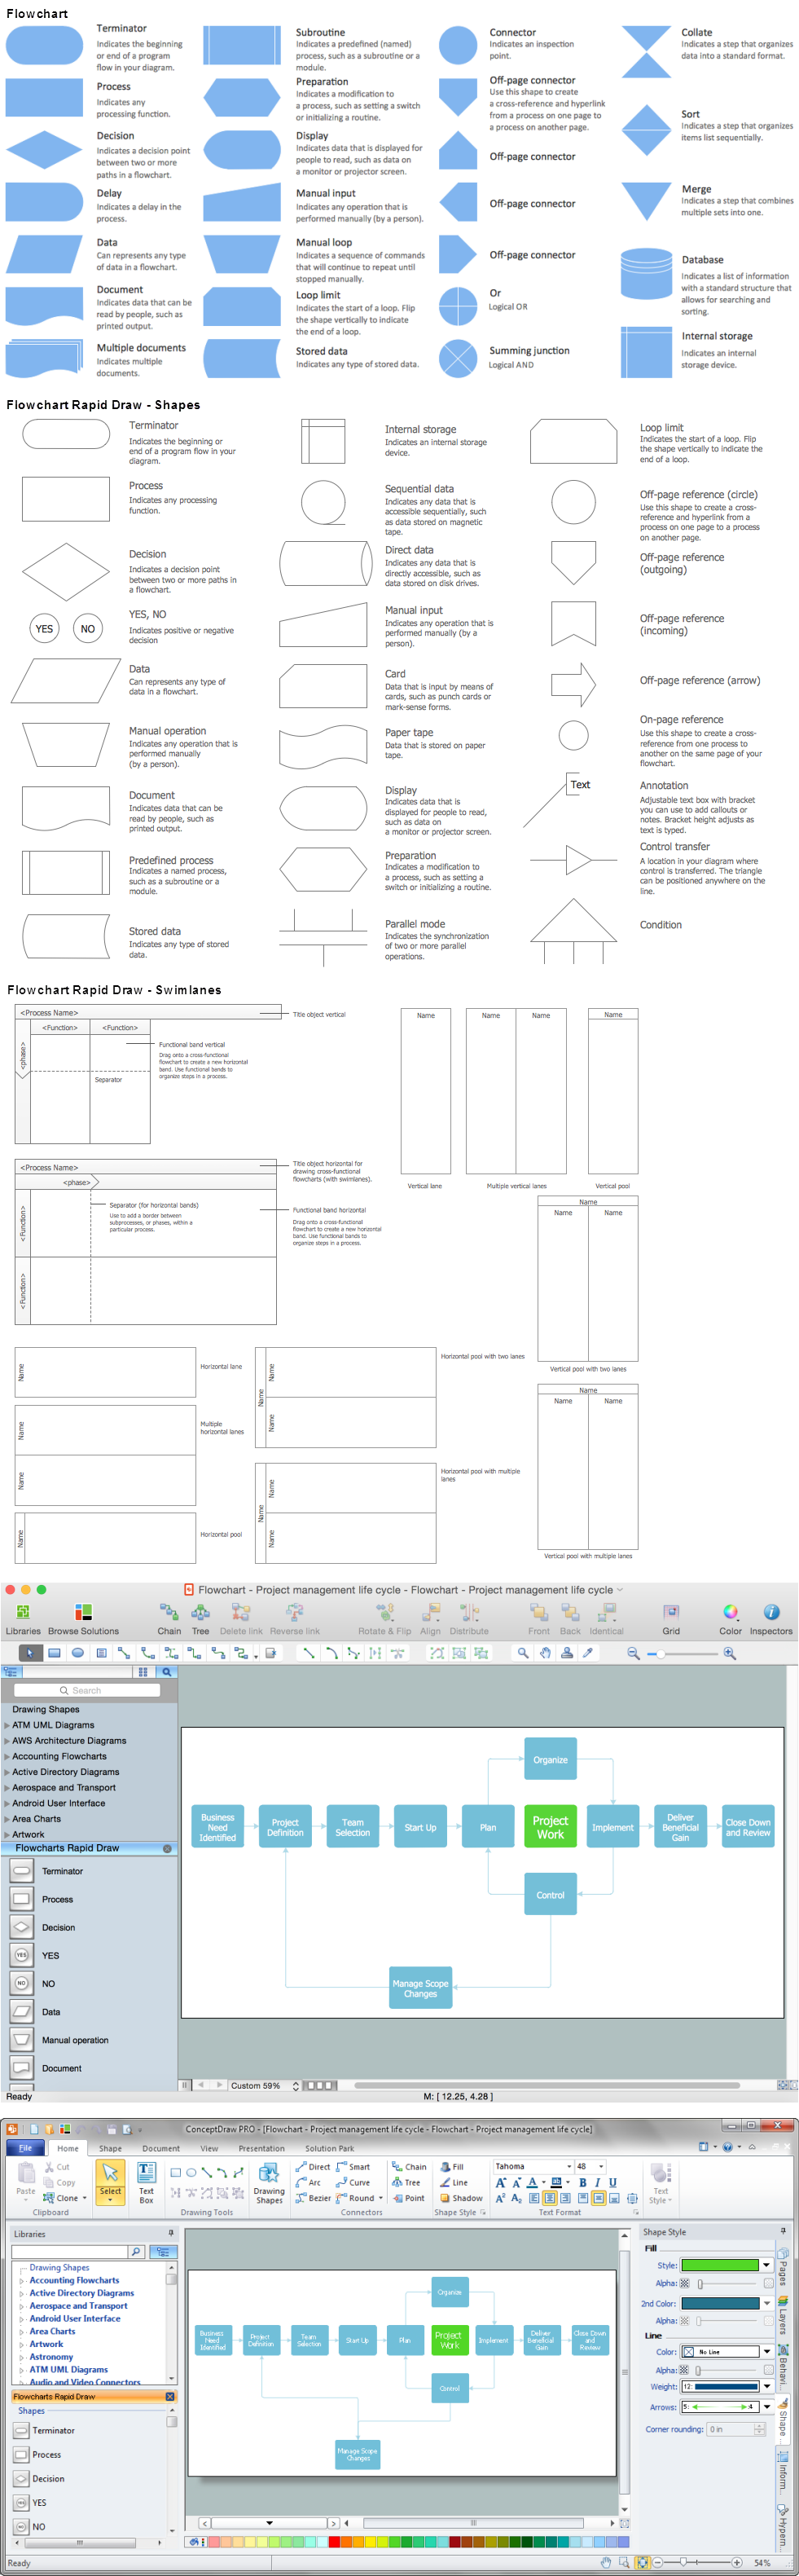
Picture: Flow Chart Drawing
Related Solution:
Easy charting software comes with beautiful chart templates and examples. This makes it easy to create professional charts without prior experience.
Picture: Chart Maker for Presentations
Related Solution: