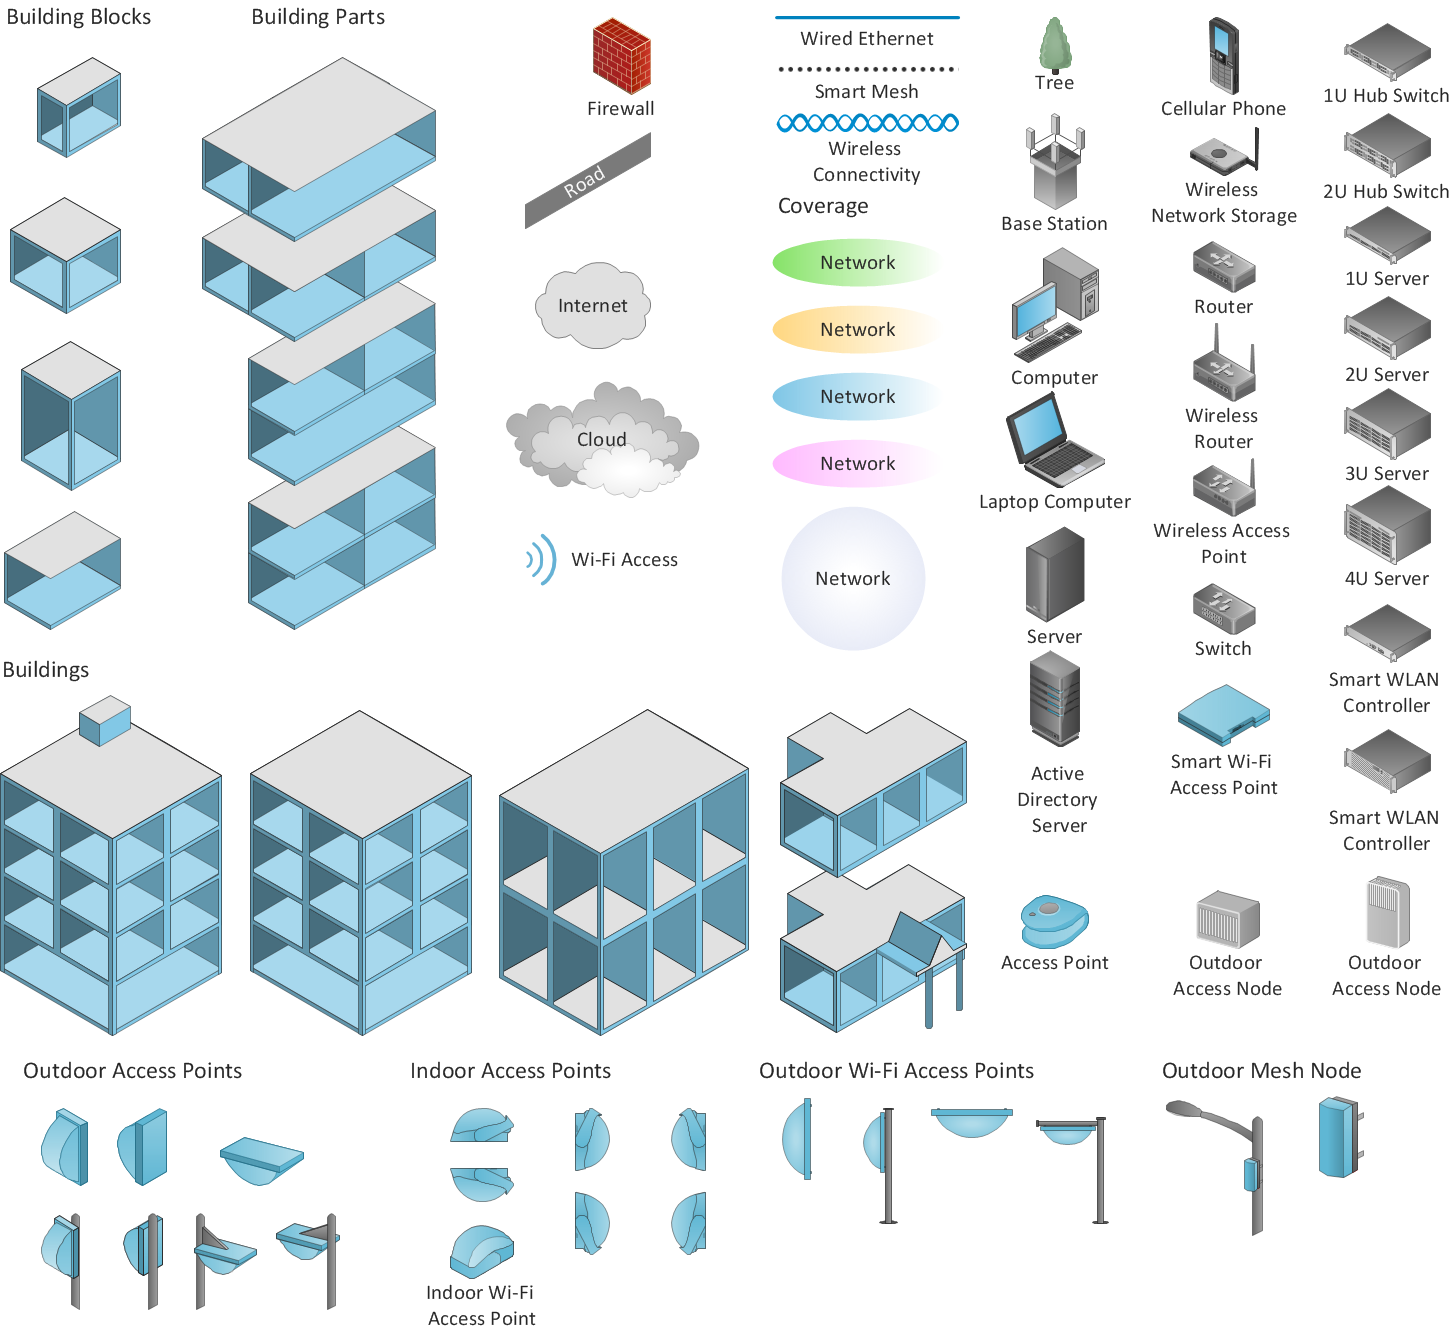
Wireless Networks solution is a bundle of the vector stencils, examples, and templates for drawing different types of wireless network diagrams. Wireless Network solution includes 81 of professional-looking stencils and several samples that you can modify and make your own diagram.
Wireless Networks solution from ConceptDraw Solution Park extends ConceptDraw DIAGRAM diagramming software to help network engineers and designers efficiently design, create and illustrate wireless network diagrams.
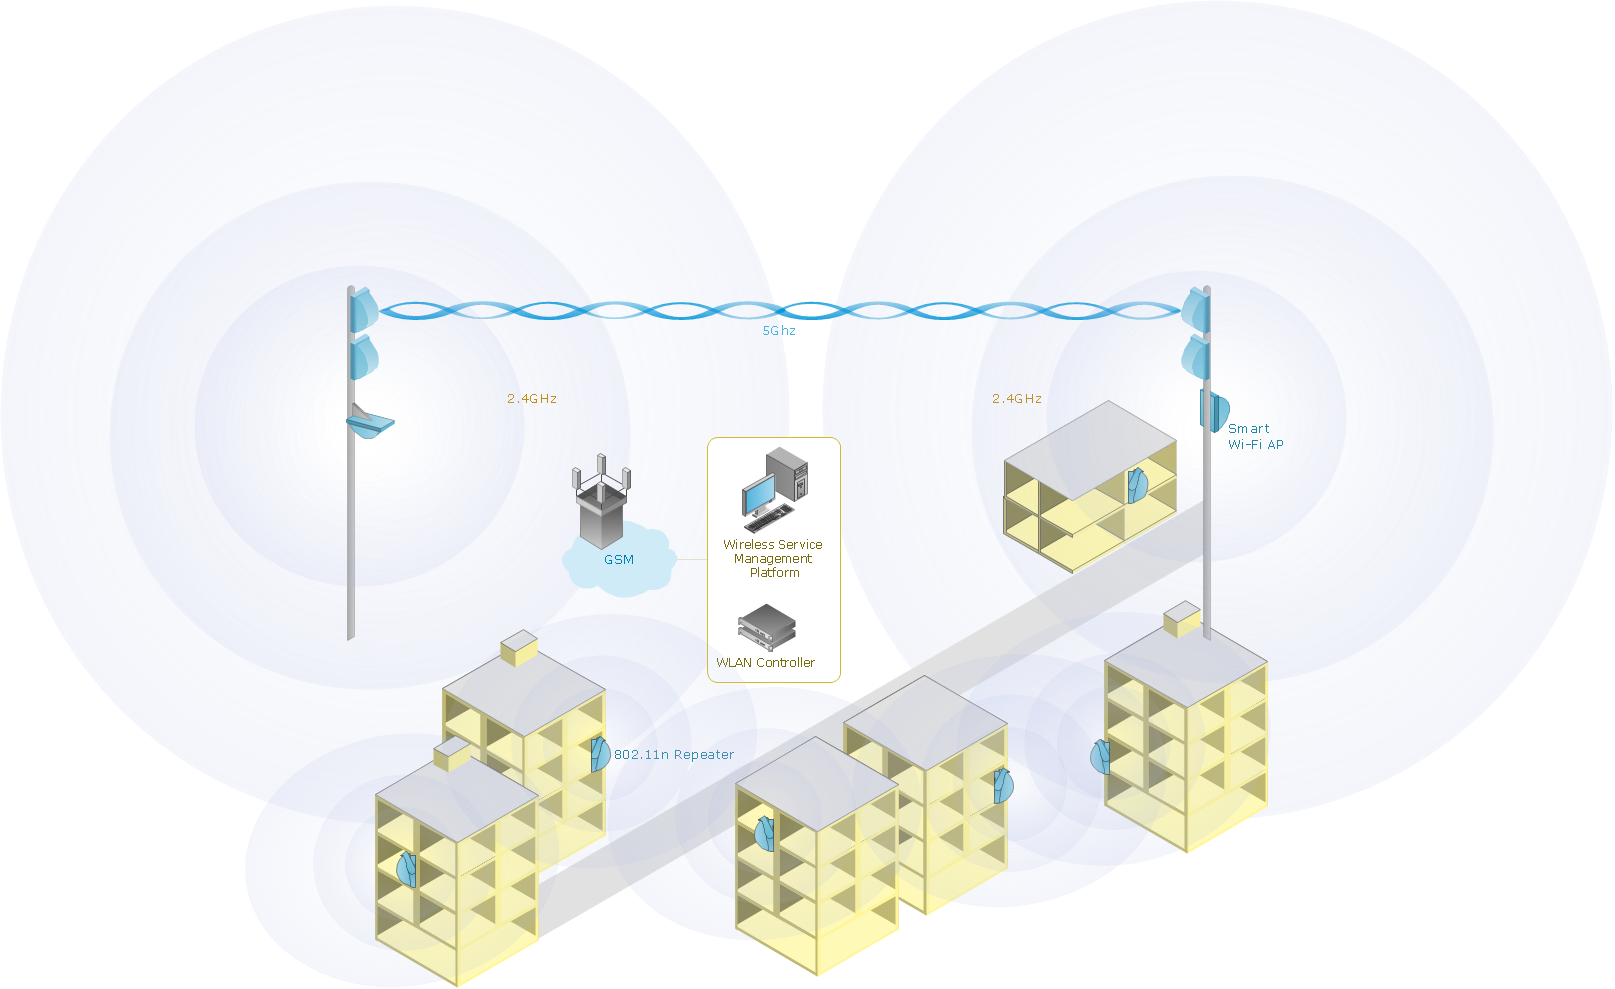
Sample 1. Mobile data offloading - Wireless computer network diagram.
This diagram was created in ConceptDraw DIAGRAM diagramming software using the Wireless Networks solution from ConceptDraw Solution Park.
Use the Wireless Networks solution to design a model of the mobile data offloading process.
How to Draw a Computer Network Diagrams
ConceptDraw Solution Park has a new drawing solution for ConceptDraw DIAGRAM which helps IT Professionals draft and present computer and network installations.
The following features make ConceptDraw DIAGRAM the best Wireless Network Diagram Software:
You don't need to be an artist to draw professional looking diagrams in a few minutes.
Large quantity of ready-to-use vector objects makes your drawing diagrams quick and easy.
Great number of predesigned templates and samples give you the good start for your own diagrams.
ConceptDraw DIAGRAM provides you the possibility to use the grid, rules and guides. You can easily rotate, group, align, arrange the objects, use different fonts and colors to make
your diagram exceptionally looking.
All ConceptDraw DIAGRAM documents are vector graphic files and are available for reviewing, modifying, and converting to a variety of formats: image, HTML, PDF file, MS
PowerPoint Presentation, Adobe Flash, MS Visio.
Using ConceptDraw STORE you can navigate through ConceptDraw Solution Park, managing downloads and updates. You can access libraries, templates and
samples directly from the ConceptDraw STORE.
If you have any questions, our free of charge support is always ready to come to your aid.
ConceptDraw DIAGRAM extended with IDEF0 Diagrams solution from the Software Development area of ConceptDraw Solution Park is a powerful diagramming and vector drawing IDEF0 software. All IDEF0 diagrams created in ConceptDraw DIAGRAM are vector graphic documents and can be reviewed, modified and converted to MS Visio XML format. To obtain the IDEF0 Visio documents from ConceptDraw DIAGRAM documents use the wide export possibilities of ConceptDraw DIAGRAM.
ConceptDraw offers you a number of ready-made organizational chart templates which you can use in your drawing. They are grouped in topical sets as organizational chart template files.
Use the Organizational Charts Solution for ConceptDraw DIAGRAM to create your own Organizational Charts of any complexity quick, easy and effective.
The Organizational Charts designed with ConceptDraw DIAGRAM are vector graphic documents and are available for reviewing, modifying, converting to a variety of formats (image, HTML, PDF file, MS PowerPoint Presentation, Adobe Flash or MS Visio XML), printing and send via e-mail in one moment.
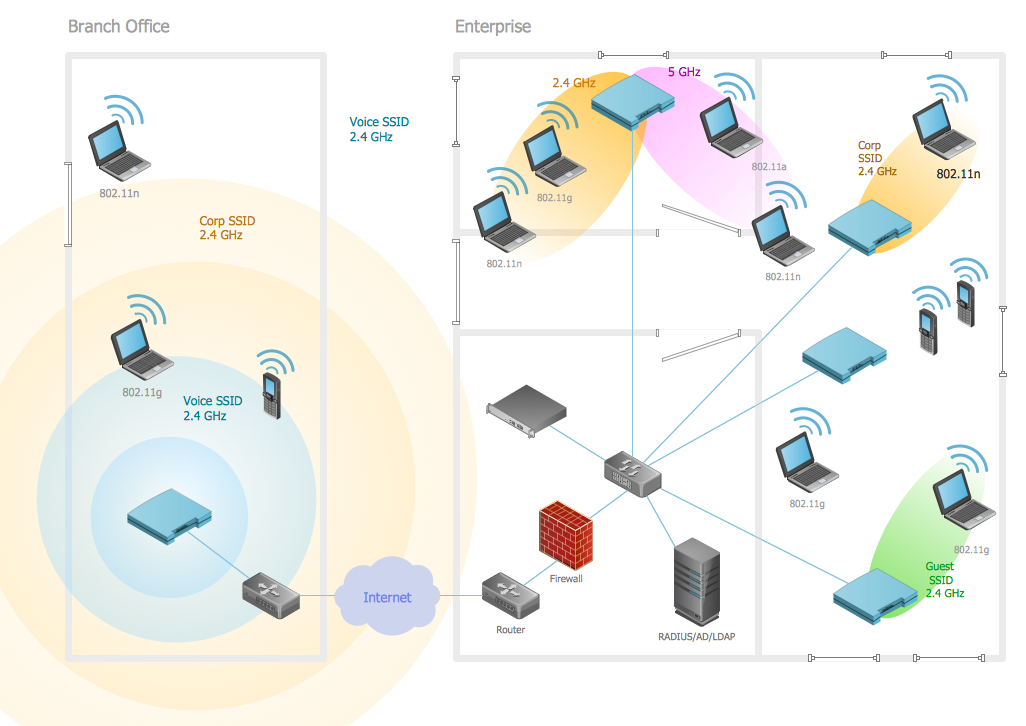
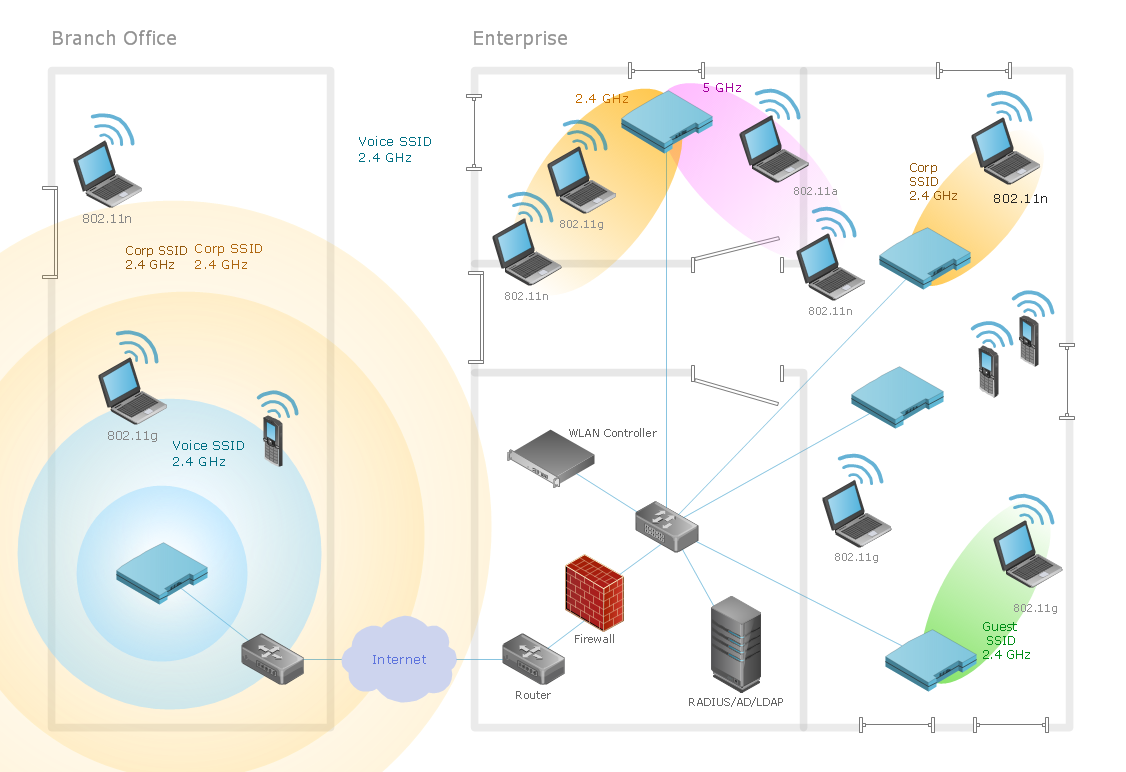
Wireless networking is useful visual tool for identification of all required equipment, and calculation the cost of creating or updating wireless computer networks. ConceptDraw DIAGRAM extended with Wireless Networks Solution from the Computer and Networks Area is the best wireless network diagramming software.
Wireless computer network diagrams help system administrators and network engineers to find out amount and type of equipment needed for each office WLAN.
Picture: Find out what amount and type of equipment is needed for your office network
Working with information can be quite tedious, furthermore, some data can be quite difficult to perceive without any graphic representation. So, to facilitate your work, you can use business diagrams, such as simple flowcharts or Gantt charts for project management and orgcharts for clarifying your company structure. You can use a proper software, like ConceptDraw Pro, draw them on paper, or use whiteboards, but it is more convenient to use a digital tool.
This diagram shows a cross-functional flowchart that was made fore telecom service provider. A workflow of a common telecommunication service provider has a rather branched structure. Thus, it is useful to have a flow chart to visualize the sequences and interrelations of the work flow steps. Business process flowchart contains 17 processes and 4 decision points,that are distributed through 2 lines depicting the participants involved. Also there are connectors that show the data flow within processes. This flowchart displays a detailed model of the telecom service trading process, as well as all participants in the process and how they interact with each other.
Picture: Business diagrams & Org Charts with ConceptDraw DIAGRAM
When studying computer science, it is important to have good training manuals. To understand how the networks and data links work, you will probably need a set of network diagram examples depicting all the possible interconnections between network devices. You can find them on Internet or try to create your own.
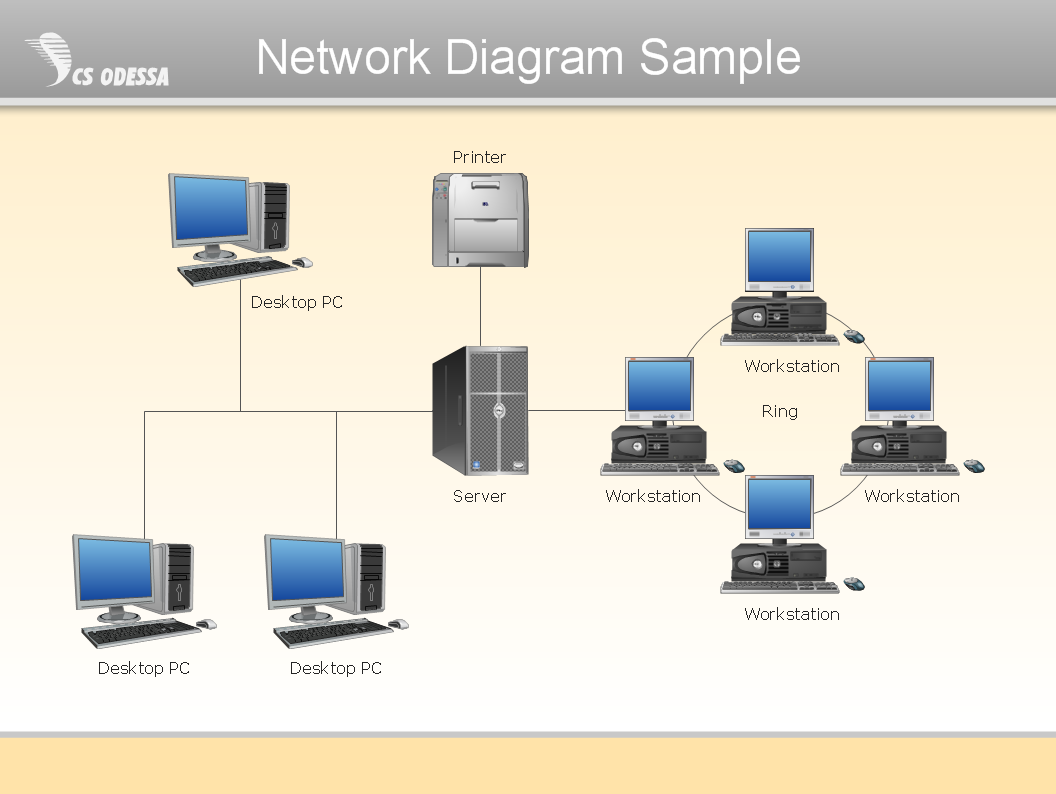
This example of a network topology diagram was made using ConceptDraw Computer and Network Diagrams solution. It represents a bus topology network diagram. A bus topology means that computers and peripherals in the network are connected to a mutual cable (backbone). This topology is often used for small networks. This diagram was designed using vector libraries of network equipment symbols. They also can be applied while creating various LAN and WAN diagrams.
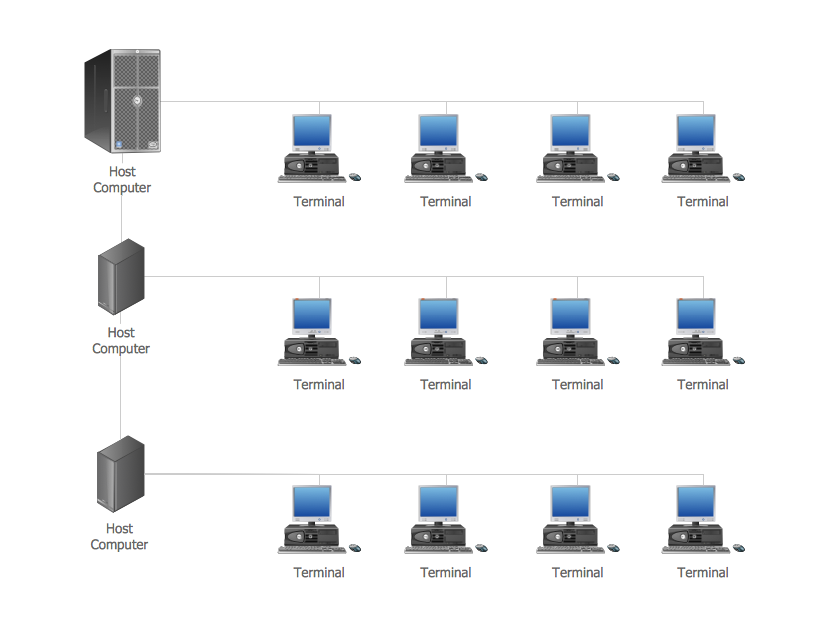
Today, we can’t imagine our lives without daily data exchange. To call a set of devices that can be connected with each other a computer network, we must be sure that these devices support appropriate protocols to transfer data. A network consisting of personal devices is private, and global computer networks, for example, Internet, connects network nodes worldwide.
This diagram represents a computer telecommunication network. The network depicted on the current diagram is featured with networked communication devices that provide data exchange through Internet. The network interconnections and connections between Internet nodes are settled using the cable media and wireless media. The nodes are the network workstations (terminals). and host computers. This network diagram was drawn with ConceptDraw DIAGRAM and its Computer and Networks Diagrams solution.
Picture: Computer Network. Computer and Network Examples