How To create Value Stream Map (VSM)
The new Value Stream Mapping solution found in the ConceptDraw Solution Park continues to extend the range of ConceptDraw DIAGRAM into a business graphics tool that can be used to document processes in any organization. Simply put timeline objects from library and continue to create diagram. After that put it to specific place object that illustrates processes of the production. Many organizations use value stream mapping as a key portion of their lean efforts.

Pic.1 Value Stream Map template.
This Value Stream Map template explains the meanings of the VSM design elements.
This template is contained in the Value Stream Mapping solution from the ConceptDraw Solution Park. It helps you to create VSM diagrams using ConceptDraw DIAGRAM software.
See also Samples:
NINE RELATED HOW TO's:
Use the set of special professionally developed swim lane flowchart symbols - single, multiple, vertical and horizontal lanes from the Swimlanes and Swimlanes BPMN 1.2 libraries from the Business Process Diagram solution, the Swim Lanes library from the Business Process Mapping solution as the perfect basis for your Swim Lane Flowcharts of processes, algorithms and procedures.
Picture: Swim Lane Flowchart Symbols
Related Solution:
Value Stream Mapping solution extends ConceptDraw DIAGRAM software with tools for drawing Value Stream Maps (VSM): templates, samples and library of vector stencils.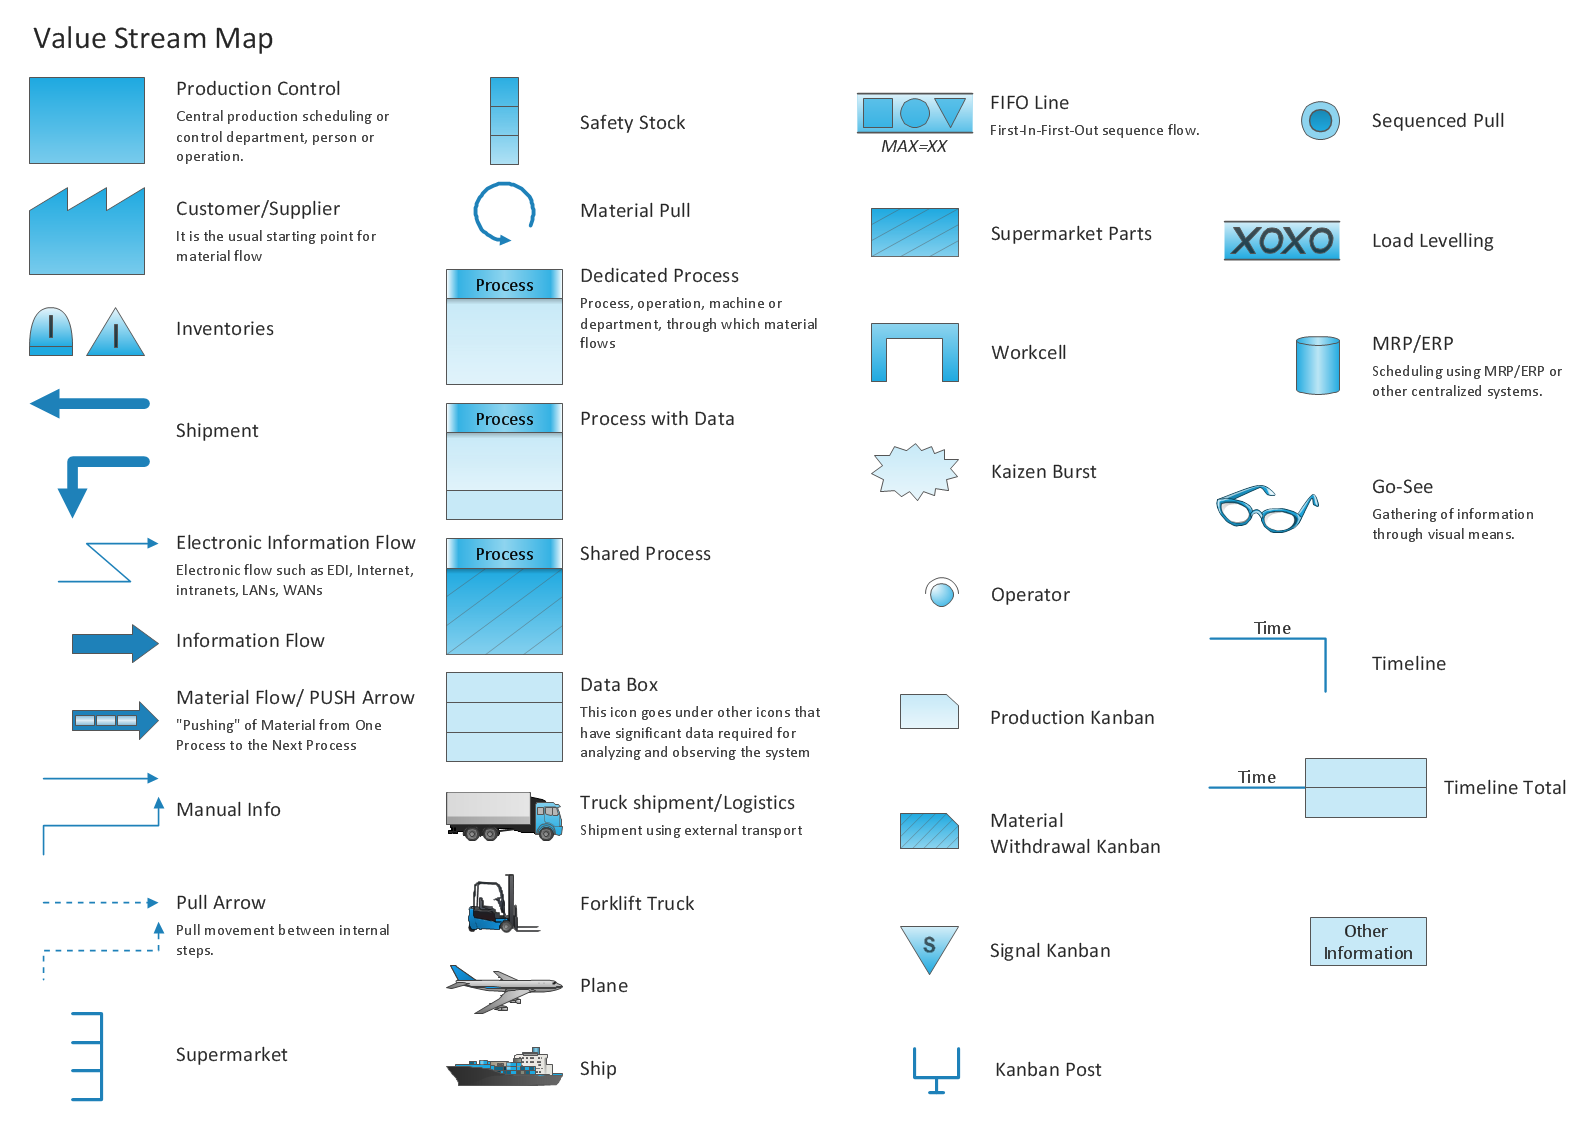
Picture: Value Stream Mapping Tool
Related Solution:
Use ConceptDraw Value Stream Maps (VSM) visualization for a manufacturing plant the material and information flow required to deliver a product or service to customers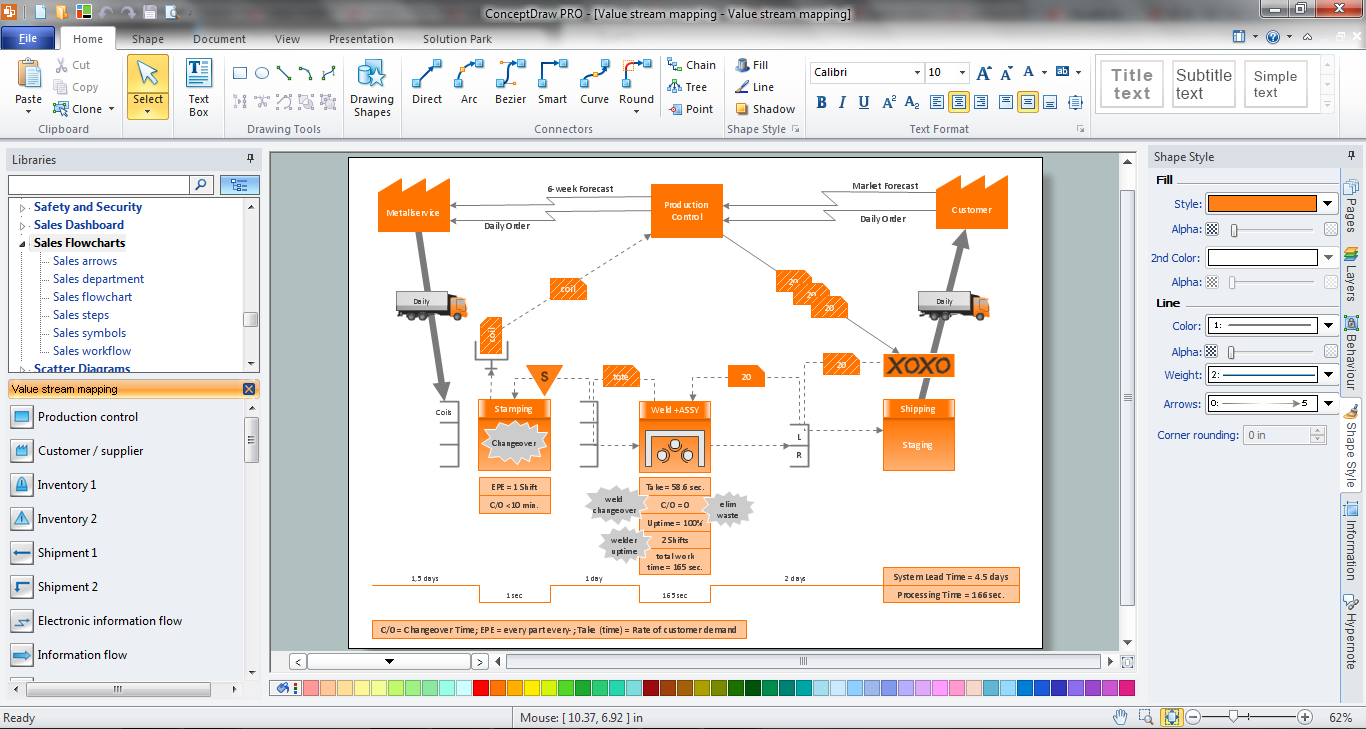
Picture: Value Stream Mapping
Related Solution:
ConceptDraw PROJECT’s powerful reporting engine lets you generate a set of tabular reports with just one click, or visualize your project as Radial Tasks Structures, Work Breakdown Structures and Resource Calendars. It also provides you with dynamic Project Dashboards.
Picture: How to Report Task's Execution with Gantt Chart
ConceptDraw Value Stream Maps visualize for a manufacturing plant the material and information flow.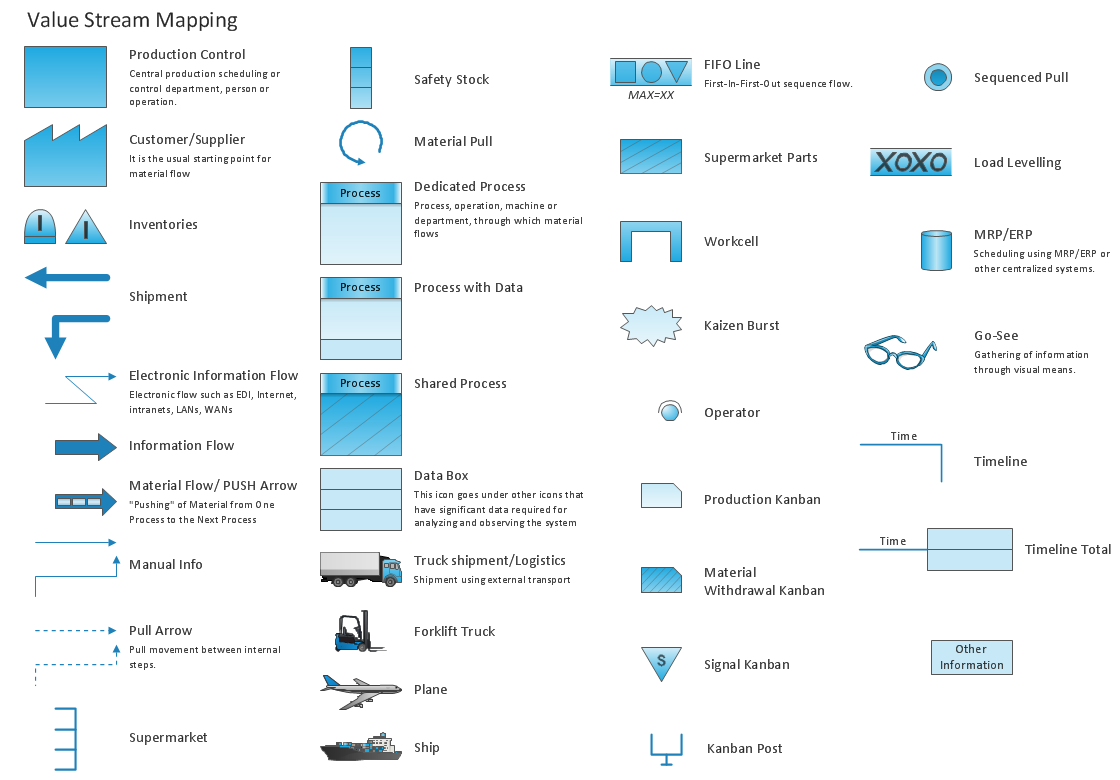
Picture: Value Stream Maps Visualize
Related Solution:
If we divide computer networks by scale, we get several main categories. The smallest network is PAN, as it connects personal devices themselves, and as the number of users grows, a local area network can be recognized, and campus area networks (CAN) connects several local networks located within some area like a university or a corporation. Computers connected to CAN share public educational materials and list of CAN network examples includes such prestigious universities like Stanford and Carnegie Mellon.
This is an example of a computer network diagram created for a campus area network. It was created using using ConceptDraw solution for the Computer and Network diagramming. The specific of this sample campus network is its distribution. It is rather broad to embrace a big campus territory. This diagram can be applied as a template for designing custom area network topology diagram for a particular educational institution.
Picture: Campus Area Networks (CAN). Computer and Network Examples
Related Solution:
The Building Plans are very useful and even necessary for architects, builders, designers and simple for those who want to build the home, office, flat or anyone other building. They are also convenient for those who want to design or redesign the home, flat, room, etc.
Picture: Building Plan Software. Building Plan Examples
Related Solution:
ConceptDraw DIAGRAM diagramming and vector drawing software offers the Timeline Diagrams solution from the Management area which is rich for the timeline examples, samples, templates and ready-to-use vector shapes.
Picture: Timeline Examples
Related Solution:
ConceptDraw MINDMAP Mac OS X version enables you to export your mind map into the iCal calendar and generate tasks from mind map topics.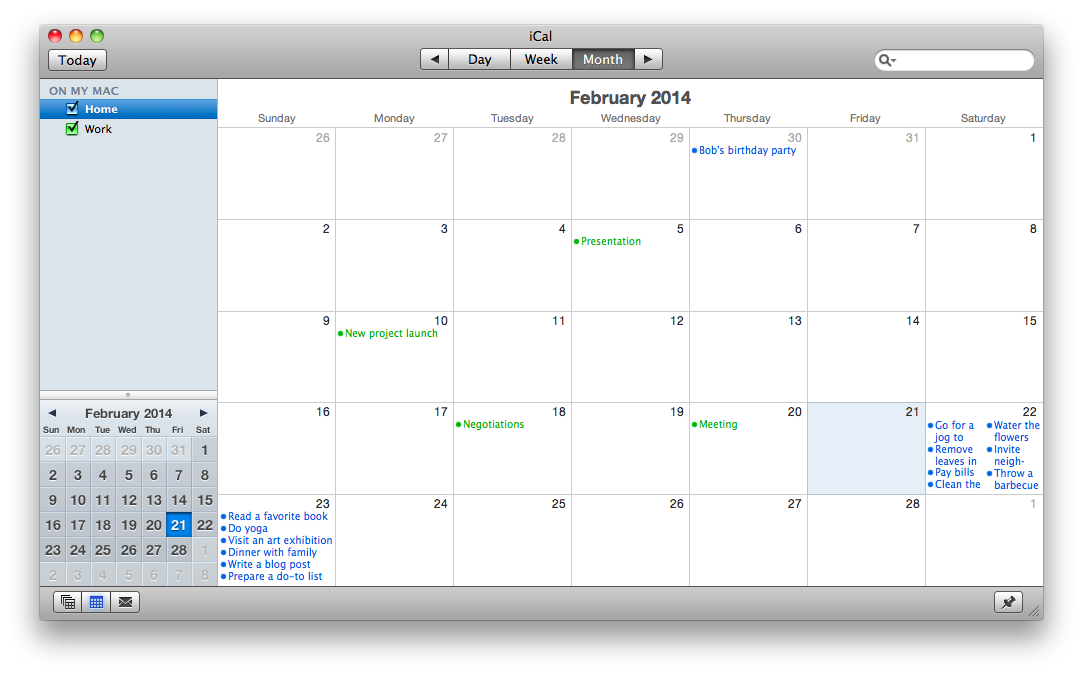
Picture: Export from ConceptDraw MINDMAP to Apple iCal
Related Solution:
ConceptDraw
MINDMAP 16