Learn how to create a current
state value stream map
Value Stream Mapping is a Lean Manufacturing tool that through the flow diagram can provide documenting every step of a manufacturing process. For the start simply put timeline objects from library and continue to create diagram. After that put it to specific place object that illustrate processes of the production. Many lean practitioners use Value Stream Mapping as a fundamental tool to identify waste, cut process cycle times, and implement process improvement.

Pic.1 Value stream mapping (VSM) diagram vector design elements.
Value Stream Mapping solution extends ConceptDraw DIAGRAM software with templates, samples and vector shapes for drawing the current state value stream maps.
See also Samples:
TEN RELATED HOW TO's:
The Value Stream Map is one of the key tools of lean practitioners. It helps aptly describe the manufacturing processes both complex and simple. It supports process improvement, allows identifying waste, and reducing process cycle times. Use ConceptDraw DIAGRAM extended with Value Stream Mapping solution to document processes starting with a professionally designed Value Stream Mapping template.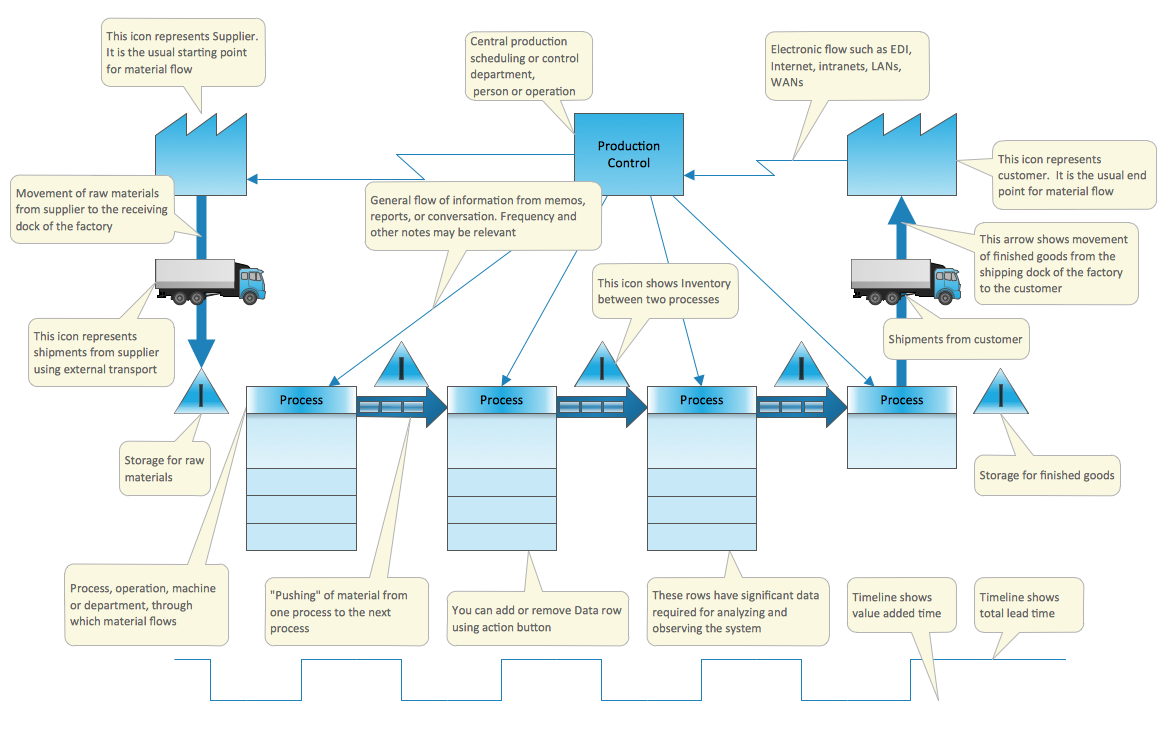
Picture: Value Stream Mapping Template
Related Solution:
Any business process consists from a number of tasks carrying out the certain business goal. It is useful to diagram business processes to ensure that they are as foolproof, logical and sequential as possible. This business process diagram describes a typical booking process flow by the example of a cab booking process. It can be used as a roadmap for any booking system implementation. Diagramming a business process allows you to look at the entire project and take into account all types of possible scenarios. Business process diagram helps you investigate and clarify the process thoroughly so that you can find out how it can be improved. Business process diagram supports team communications by ensuring that each process element is clear and everyone in the team is on the same page.
Sometimes your company brings you less profit than you expect it to be, and it’s difficult to reveal the causes. Maybe it’s time to learn new technologies, because business diagram are easily developed by means of special software, so you won’t make any extra effort. In return, you will increase your productivity and get more done in a less time.
Picture: Business Diagram Software
Related Solutions:
Maine is a state in the New England region of the northeastern United States, bordered by the Atlantic Ocean to the east and south; New Hampshire to the west; the Canadian provinces of Quebec to the northwest; and New Brunswick to the northeast.
The vector stencils library Maine contains contours for ConceptDraw DIAGRAM diagramming and vector drawing software. This library is contained in the Continent Maps solution from Maps area of ConceptDraw Solution Park.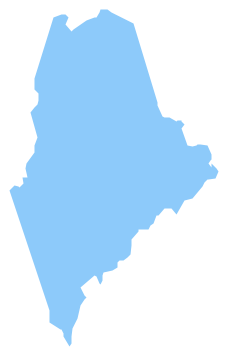
Picture: Geo Map — USA — Maine
Related Solution:
ConceptDraw Value Stream Mapping is a Lean Manufacturing tool that uses a flow diagram to document in great detail every step of a manufacturing process.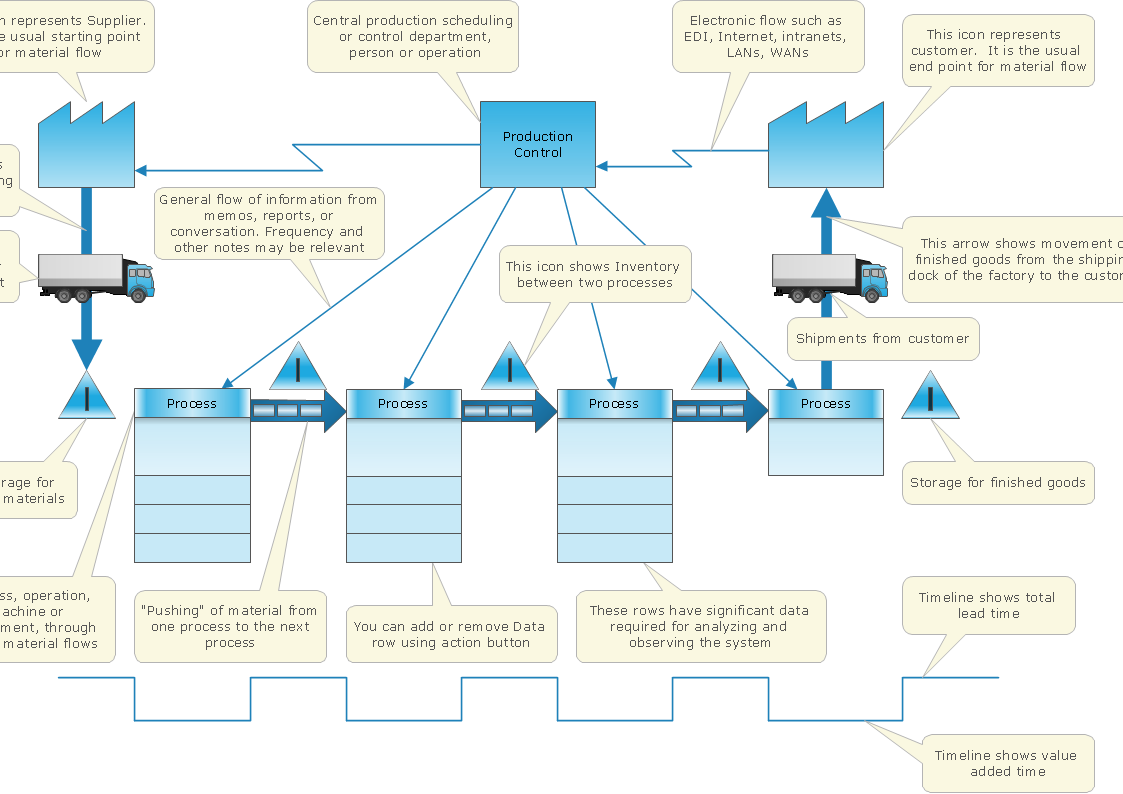
Picture: Lean Value Stream
Related Solution:
Mexico, officially the United Mexican States, is a federal republic in North America.
The vector stencils library Mexico contains contours for ConceptDraw DIAGRAM diagramming and vector drawing software. This library is contained in the Continent Maps solution from Maps area of ConceptDraw Solution Park.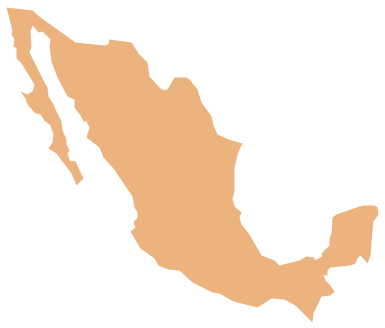
Picture: Geo Map - South America - Mexico
Related Solution:
In pedagogy and theoretical syntax, a sentence diagram or parse tree is a pictorial representation of the grammatical structure of a sentence. The term sentence diagram is used more in pedagogy, where sentences are diagrammed.
ConceptDraw DIAGRAM diagramming and vector drawing software extended with Language Learning solution from the Science and Education area is ideal for quick and easy drawing sentence diagrams of any complexity.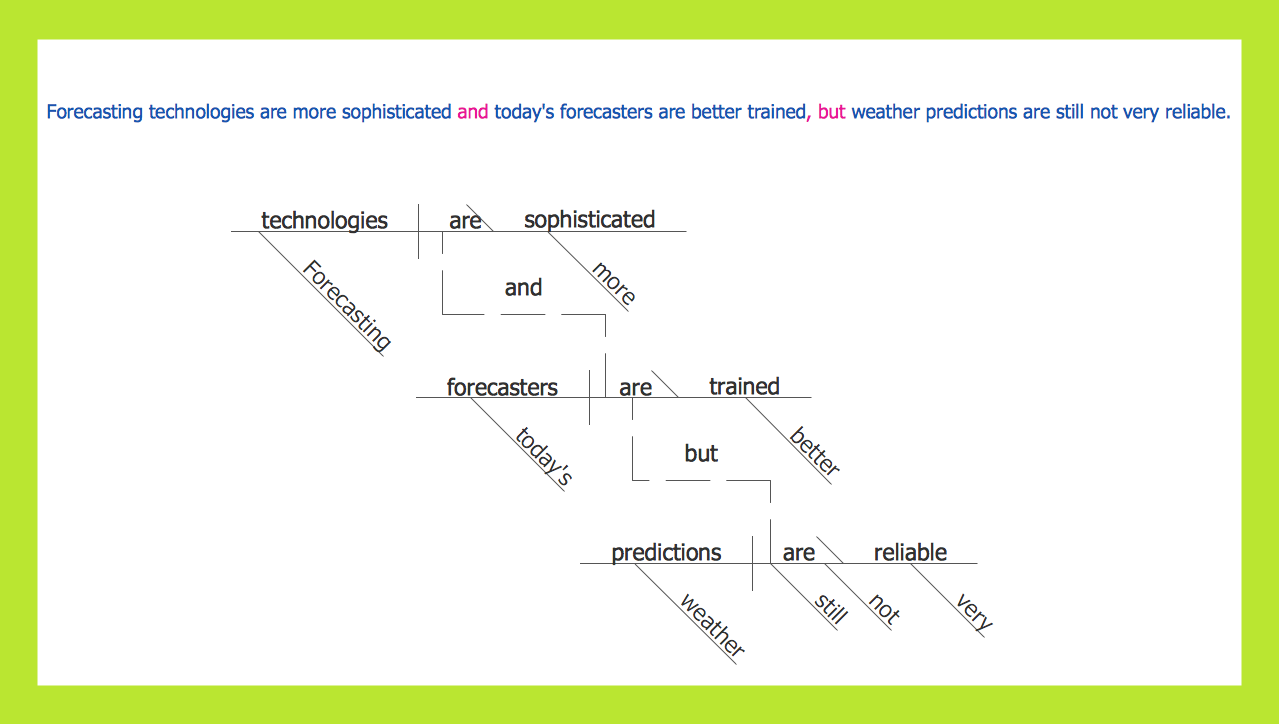
Picture: Sentence Diagram
Related Solution:
Alaska is a U.S. state situated in the northwest extremity of the North American continent.
The vector stencils library Alaska contains contours for ConceptDraw DIAGRAM diagramming and vector drawing software. This library is contained in the Continent Maps solution from Maps area of ConceptDraw Solution Park.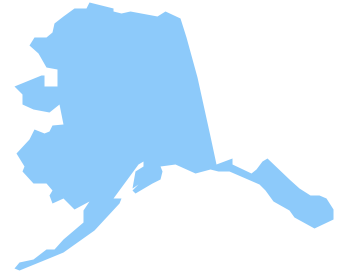
Picture: Geo Map — USA — Alaska
Related Solution:
The United Arab Emirates, sometimes simply called the Emirates or the UAE, is a country located in the southeast end of the Arabian Peninsula on the Persian Gulf, bordering Oman to the east and Saudi Arabia to the south, as well as sharing sea borders with Qatar, Iran and Pakistan.
The vector stencils library United Arab Emirates contains contours for ConceptDraw DIAGRAM diagramming and vector drawing software. This library is contained in the Continent Maps solution from Maps area of ConceptDraw Solution Park.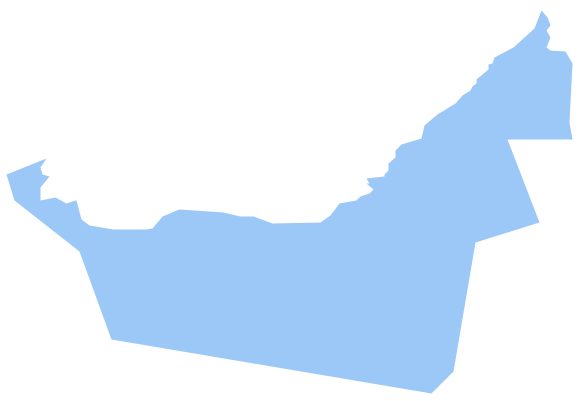
Picture: Geo Map - Asia - United Arab Emirates
Related Solution:
Create bar charts for visualizing problem solving in manufacturing and economics using the ConceptDraw DIAGRAM diagramming and vector drawing software extended with the Bar Graphs Solution from the Graphs and Charts area of ConceptDraw Solition Park.
Picture: Bar Diagrams for Problem Solving. Create manufacturing and economics bar charts with Bar Graphs Solution
Related Solution:
The Value stream is a totality of all actions on the projection, order composition and production: starting from creation a product project to launching this product, from order to delivery, from extraction of raw materials to ready product manufacturing. Value stream mapping is a process of visualization of these actions and creation of a detailed and graphical map.
Picture: Value stream with ConceptDraw DIAGRAM
Related Solution:
ConceptDraw
MINDMAP 16