
Example 1. Sales Process Map - Visual Shopping Scheme
Sales Flowcharts Solution is incredibly useful in the field of sales process management, first of all thanks to the 6 libraries:
- Sales Arrows
- Sales Department
- Sales Flowchart
- Sales Steps
- Sales Symbols
- Sales Workflows
which contain 285 ready-to-use vector objects, sales symbols, flowchart icons.

Example 2. Sales Process Map - Lead to Opportunity Sales Flow
These objects can effectively help you to design the Sales Process Map or Flowchart of any complexity, which will visually display the sales processes, the actual status of workflows, the sales process results to analyze and timely identify the problems within the workflow.

Example 3. Sales Process Map - E Filing General Workflow
The Sales Process Map samples you see on this page were created in ConceptDraw DIAGRAM using the predesigned objects from the libraries of the Sales Flowcharts Solution for ConceptDraw Solution Park. An experienced user spent 10-15 minutes creating each of these samples.
Use the Sales Flowcharts Solution for ConceptDraw DIAGRAM software to create your own Sales Process Map or Sales Flowchart fast, easy and effective.
All source documents are vector graphic documents. They are available for reviewing, modifying, or converting to a variety of formats (PDF file, MS PowerPoint, MS Visio, and many other graphic formats) from the ConceptDraw STORE. The Sales Flowcharts Solution is available for all ConceptDraw DIAGRAM
TEN RELATED HOW TO's:
This sample was created in ConceptDraw DIAGRAM diagramming and vector drawing software using the UML Class Diagram library of the Rapid UML Solution from the Software Development area of ConceptDraw Solution Park.
This sample shows the structure of the building and can be used by building companies, real estate agencies, at the buying / selling of the realty.
Picture: UML Class Diagram Example - Buildings and Rooms
Related Solution:
Data base diagrams describes inter-related data and tables. It describes roles and relationships, internal and external dependencies, data exchange conventions and structures of knowledge domain.
ConceptDraw Software provides number of data-base chart libraries including major 49 vector symbols. Use these DFD flowchart symbol libraries to design data-base structure and models, use it to design data base process-oriented models, or simple data-oriented models. The are special drawing tools for making data flowcharts, data process diagrams, structured analysis diagrams, and information flow diagrams.
Picture: Database Flowchart Symbols
Related Solution:
This sample was created in ConceptDraw DIAGRAM diagramming and vector drawing software using the Flowcharts solution from the Diagrams area of ConceptDraw Solution Park.
This sample shows the Flowchart that displays the procedures of 2PP (two-party preferred) voting and counting the voters. The two-party-preferred vote is the result of the elections that was distributed to the final two parties.
Picture: Basic Flowchart Images. Flowchart Examples
Related Solution:
A model of a system is defined as a set of hierarchical diagrams representing the asynchronous process of data transformation from the moment it is input to the system to the moment it is output to the user. To demonstrate how a process transforms the initial data, you should design a data flow diagram using a DFD Library included in ConceptDraw DIAGRAM Solution Park. Start your diagramming experience now!
You can use this library of symbols related to data flow diagrams (DFD) to design data-oriented or process-oriented models along with data process diagrams. This vector objects library It is a part of ConceptDraw solution designed for data flow diagramming, along with corresponding samples and templates. A data flow diagram is a 2D flowchart that depicts the sequence of particular activities and operations operations and activities which is accompanied by the dynamic flow of some data.
Picture: Design Data Flow. DFD Library
Related Solution:
Using mind mapping in education is very popular way to make your lecture materials more structural and clear both for you and for students. At remote learning session your students also can make notes or type questions to the current slides without interrupting slide show.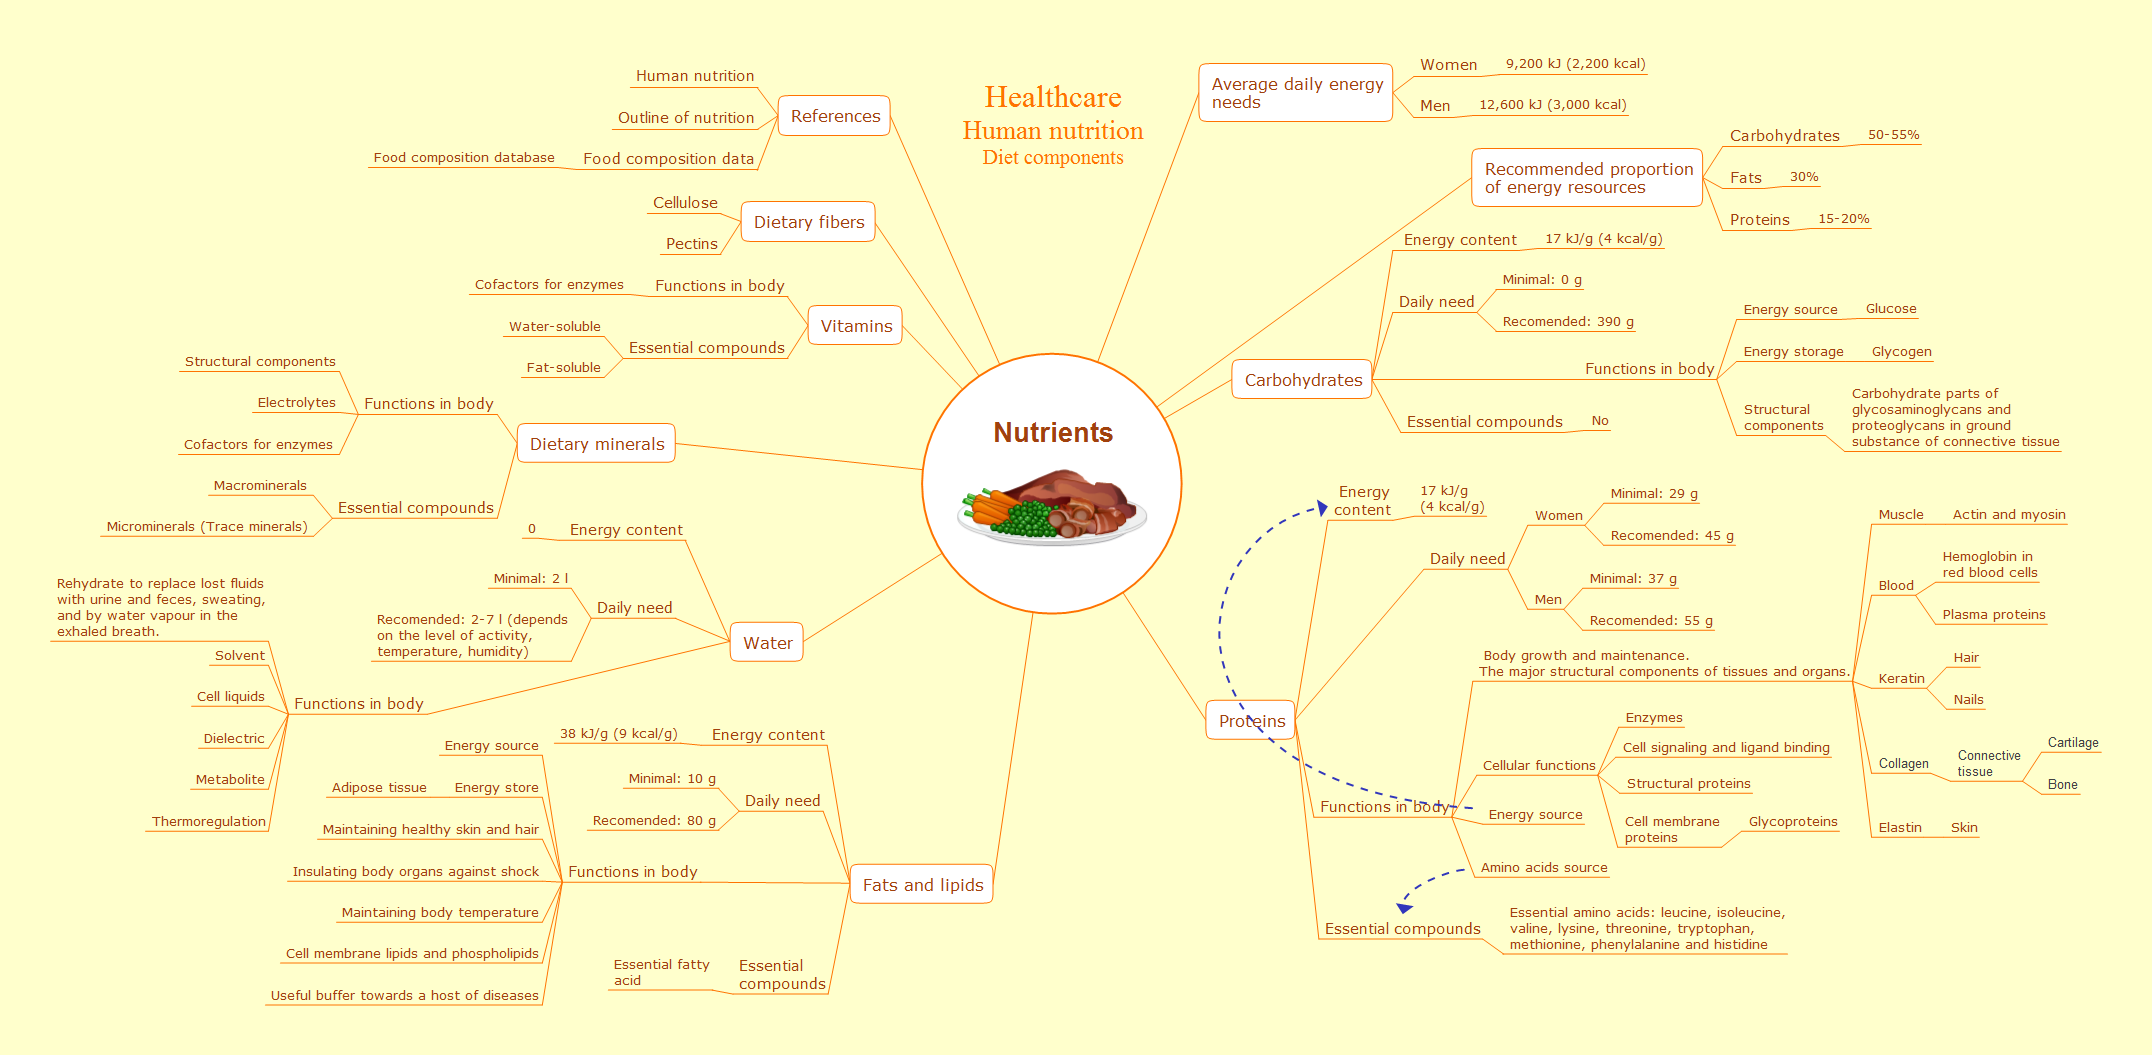
Picture: Presentations in Educational Process
Related Solution:
ConceptDraw DIAGRAM software is powerful in the application of the Kanban method. 🔸 Create visual Kanban boards to ✔️ manage projects efficiently, ✔️ optimize the workflow, ✔️ enhance productivity, ✔️ improve collaboration and communication of team members, ✔️ prevent overwhelming of teams, ✔️ reduce bottlenecks and other inefficiencies, ✔️ track progress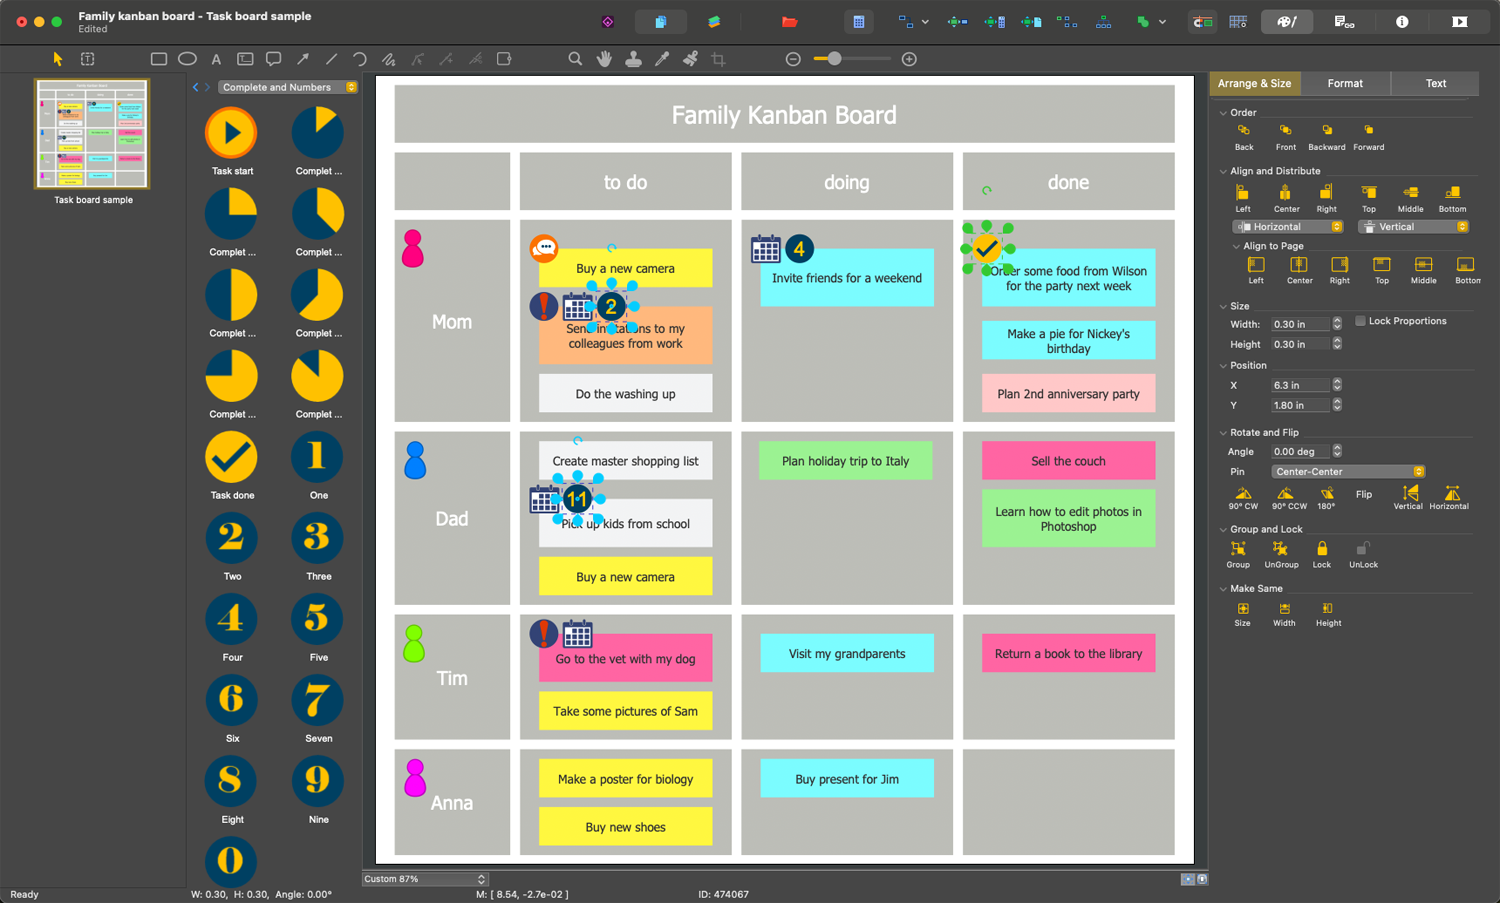
Picture: Kanban Board Software: A Comprehensive Overview
Related Solution:
The behavior of worker in organization is influences organizational effectiveness. A simple block diagram made with ConceptDraw Block diagrams solution can improve the understanding of expectations of workers regarding what they l contribute to organization and what they wait to obtain. Making block diagram depicting the individual behavior in organization is used in HR management to obtain an optimal and positive overall contribution to the organization.
The behavior of worker in organization is influences organizational effectiveness. A simple block diagram made with ConceptDraw Block diagrams solution can improve the understanding of expectations of workers regarding what they l contribute to organization and what they wait to obtain. Making block diagram depicting the individual behavior in organization is used in HR management to obtain an optimal and positive overall contribution to the organization.
Picture: Basic Diagramming
Related Solution:
The use case diagram (behavior scenarios, precedents) is the initial conceptual representation of the system during its design and development. This diagram consists of actors, use cases and relationships between them. When constructing a diagram, common notation elements can also be used: notes and extension mechanisms.
This sample was created in ConceptDraw DIAGRAM diagramming and vector drawing software using the UML Use Case Diagram library of the Rapid UML Solution from the Software Development area of ConceptDraw Solution Park.
This sample shows the types of user’s interactions with the system and is used at the registration and working with the database system.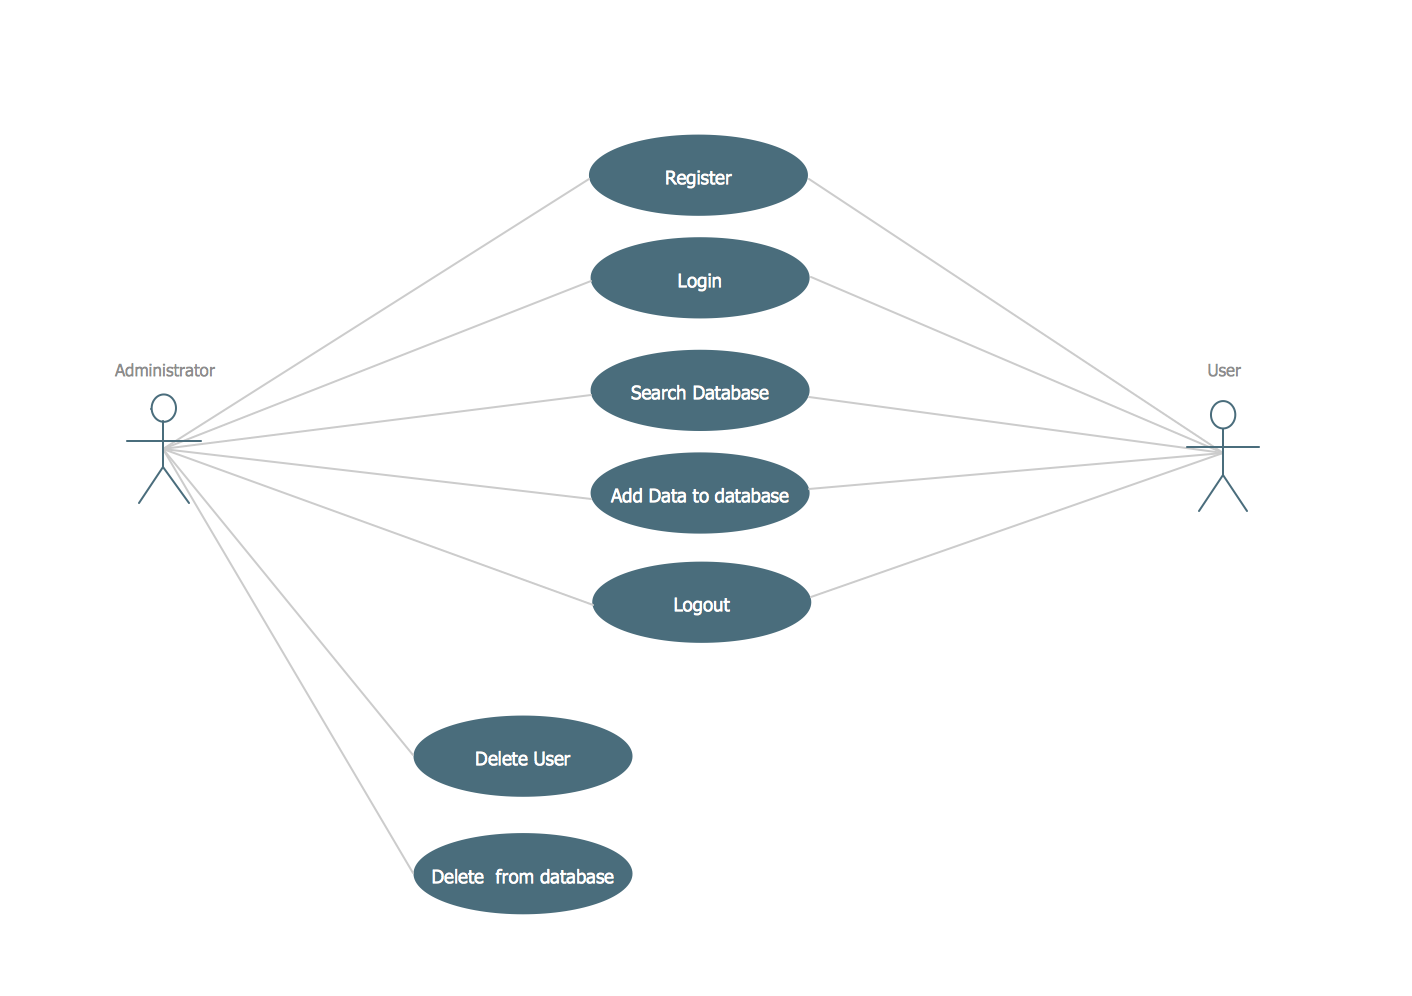
Picture: UML Use Case Diagram Example. Registration System
Related Solution:
Helps to create professionally looking and detailed Sales Flowcharts with all sales steps visually represented on them.
Use the Sales Flowcharts Solution for ConceptDraw DIAGRAM software to create your own Sales Flowcharts of any complexity quickly, easily and effectively to use them successfully in your work activity.
ConceptDraw DIAGRAM diagramming and vector drawing software supplied with unique Sales Flowcharts solution from the Marketing area of ConceptDraw Solution Park allows fast and easy visualize all sales steps of the sales process on a sales process Map or sales process flowchart, and then realize them easily.
Picture: Sales Steps
Related Solution:
Excellent ideas are the foundation of successful design of cafe, restaurant, bar, and any other premise for working or relax. Sometimes when you need to illustrate your Cafe Design Ideas on the paper or on the computer screen, you may require convenient software. ConceptDraw DIAGRAM extended with Cafe and Restaurant Floor Plan Solution from the Building Plans area is exactly what you need.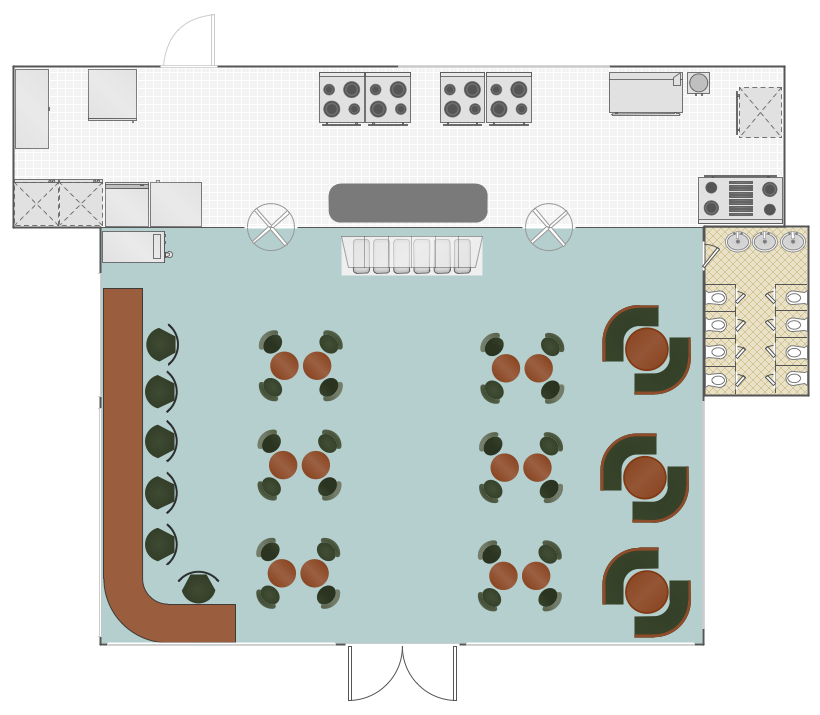
Picture: Cafe Design Ideas
Related Solution:

