Money - Design Elements
Money - Vector clipart libraryThe vector stencils library Money is included in the Business and Finance solution from Illustration area of ConceptDraw Solution Park. Use it to quick draw illustrations, diagrams and infographics for your business and financial documents, presentations and websites. The clipart library Money includes 19 icons:
|
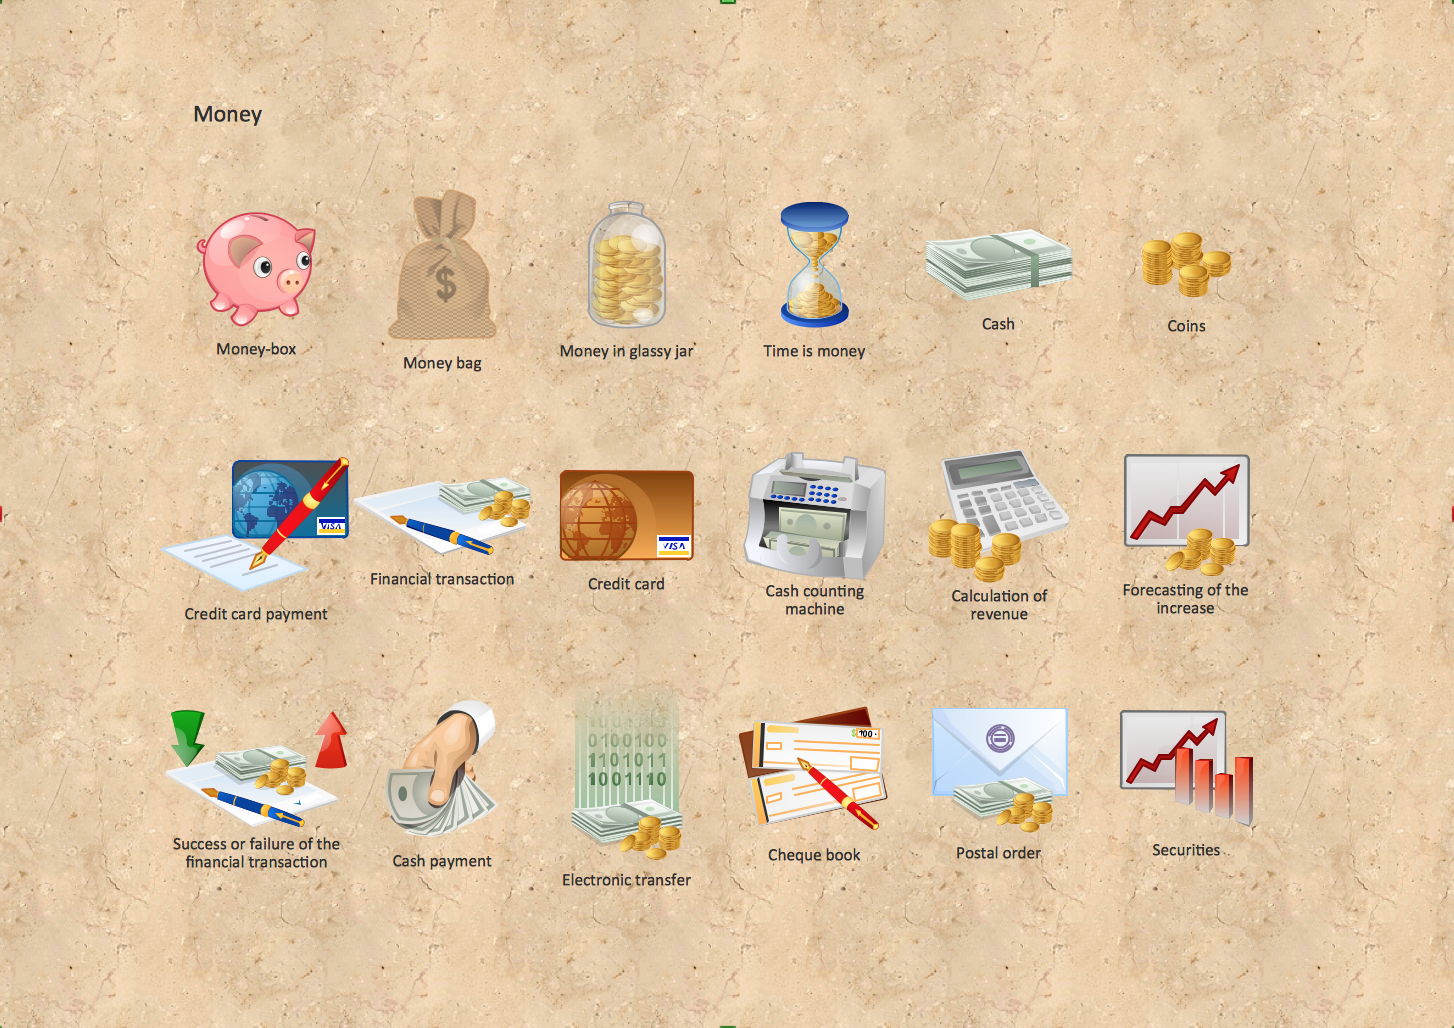
Pic.1 Money - Design Elements
See also Samples:
- Illustration - Aerospace and Transport
- Illustration - Artwork
- Illustration - Audio, video, media
- Illustration - Business and finance
- Illustration - Computers and communications
- Illustration - Manufacturing
- Illustration - Nature
- Illustration - People
- Illustration - Presentation clipart
- Illustration - Safety and security
- Science & Education — illustrations
NINE RELATED HOW TO's:
ConceptDraw Pyramid Diagram software allows drawing column charts using predesigned objects or drawing tools.
Picture: Pyramid Diagram
Related Solutions:
ConceptDraw Mind maps can be used to depict a quality process.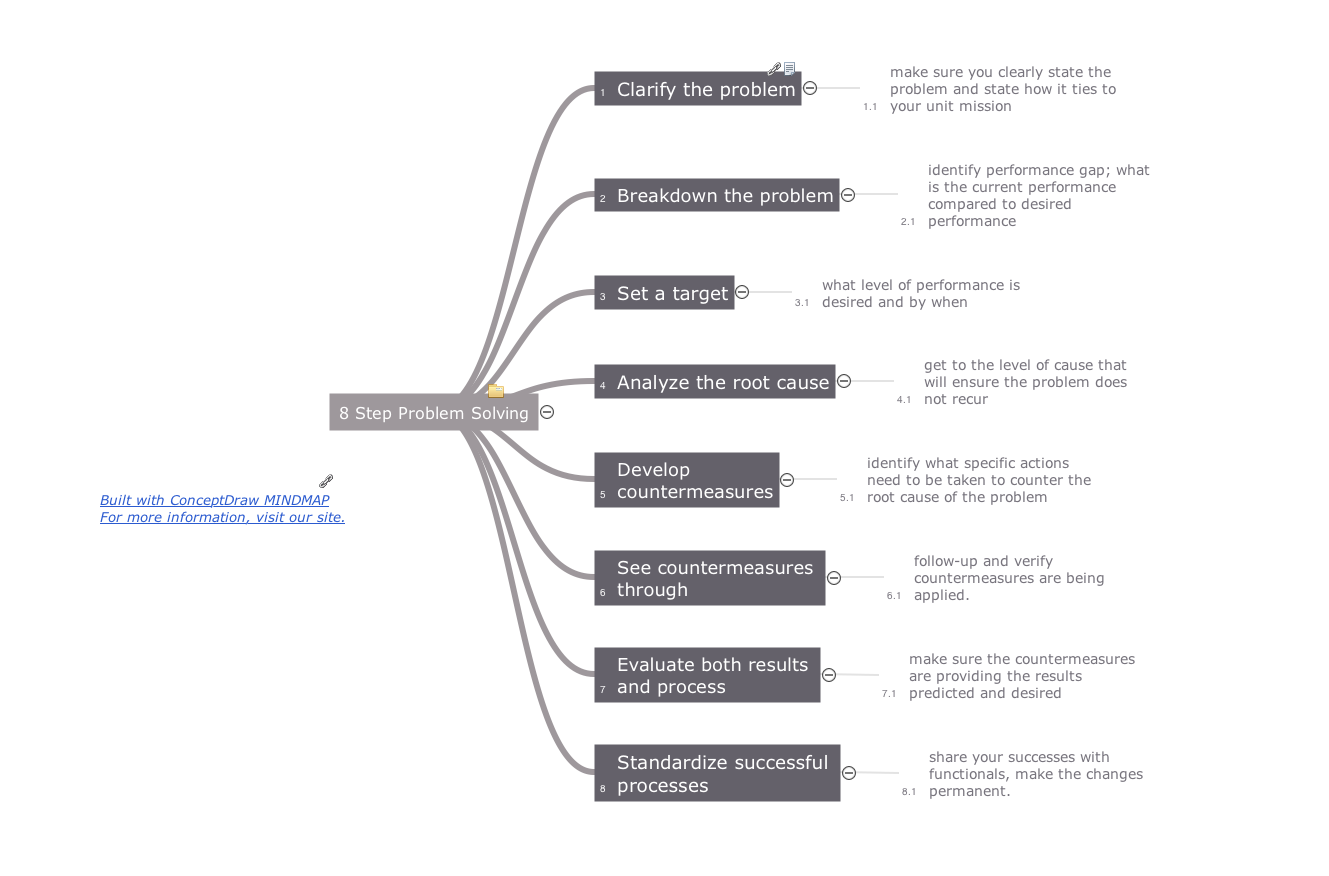
Picture: Helpful in all stages of quality management
Related Solution:
ConceptDraw DIAGRAM is a software for producing flow charts. The software delivers built-in object libraries with vector stencils that allows you to use RapidDraw technology. By clicking on direction arrows one can add a new object to flowchart. Users can start drawing their own flowchart diagrams in fast and simple way.
Picture: Diagram Flow Chart
Related Solution:
The solution handles designs of any complexity, and the comprehensive library covers all key aspects of a transportation system. To further enhance your map design, there is the option to embed links, that can display station images or other relevant, important information. We have also included a set of samples in the solution, that show the possible real-world application — complex tube systems including the London Tube and New York City Subway show the level of detail possible when using the Metro Map Solution.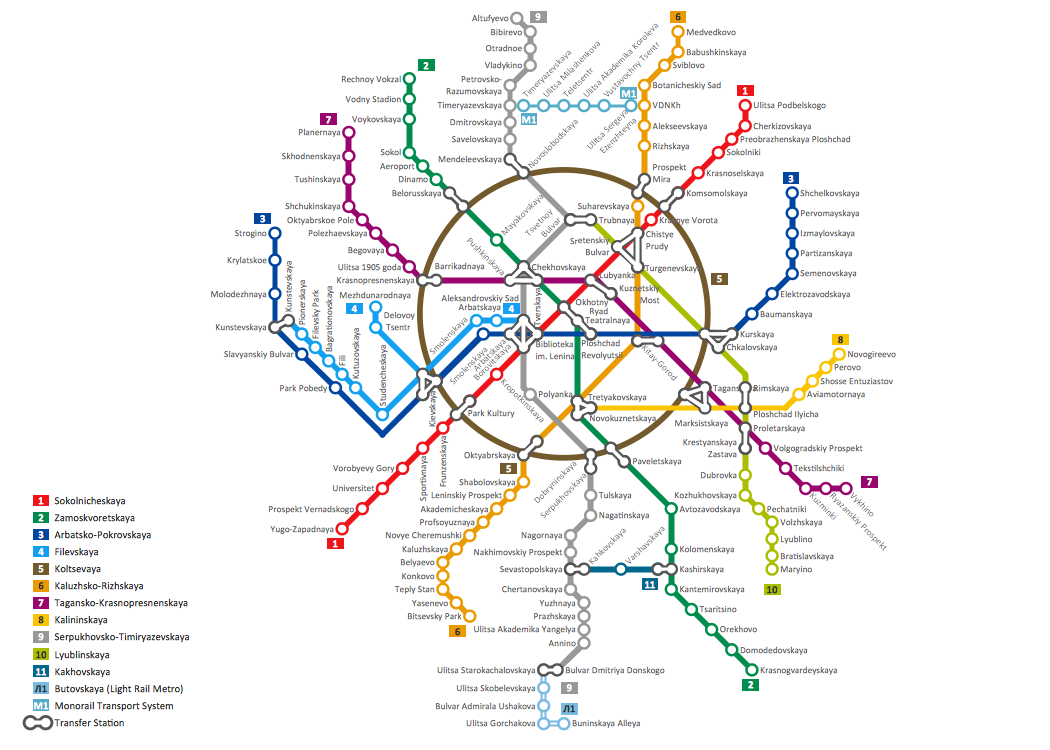
Picture: How to Draw Metro Map style infographics? Moscow, New York, Los Angeles, London
Related Solution:
Use it to make professional looking documents, presentations, and websites illustrated with color scalable vector clipart for geography, weather, and animals.
Picture: Clipart School Example
Related Solution:
This sample shows the Radar Chart that compares the internet dimensions in the four countries. The Radar Chart represents the multivariate data as a two-dimensional chart with three or more variables displayed on the axes that start in one point. The Radar Charts are used in the quality management, business, analytics and sport.
Picture: Radar Chart
Data flow diagrams are the graphical tool, used in the visualization of data flow of some data processing systems. It is the valuable process modeling tool. Also designing DFD is the important component of the initial part of any information system development project. The standard symbols are used to represent the interaction of a system components and how various kinds of components influence on data flow. The ConceptDraw Data Flow Diagrams solution is design to assist professional software engineers in making DFDs according to Gane and Sarson, and Yourdon and Coad notations.
Do you imagine yourself as a successful IT specialist? To your mind, they all use data flow diagram examples to learn and to get inspired. Aren’t you still with us?
Picture: Data Flow Diagram Examples
Related Solution:
Describing a workflow or approval process can take hours and be too complicated, especially since there are options to do it quickly and vividly. Diagrams called flowcharts replace long paragraphs of boring text and represent information in a graphic way. You can draw one on paper or you can use flowchart software to do it quickly and scalable. This kind of software is easy to use and you don’t need any special skills to start using it. In addition, there are a lot examples and predesigned templates on the Internet.
Flowcharts are a best tool for staking out a huge and complex process into some small readable parts. Surely, flowcharts can be drawn manually but the use of standard symbols that make it clear for a wide audience makes a software tool preferred for this task. The core for a successful flowchart is its simplicity. That is why often before beginning making flowchart through software, people draw the sketch on a piece of paper. Designing an effective flowchart means the combination of the data needed to be shown and the simplicity with which you depict it.
Picture: Flowchart Software: A Comprehensive Guide
Related Solution:
Fruits are unique products, they are beautiful and delicious, and look amazing in the compositions. Fruits are perfect for decorating various dishes, desserts and beverage. Each composition of fruits is a real fruit art!
ConceptDraw DIAGRAM diagramming and vector drawing software extended with Food Court solution from the Food and Beverage area of ConceptDraw Solution Park perfectly suits for fruit art design and easy drawing attractive food and beverage illustrations.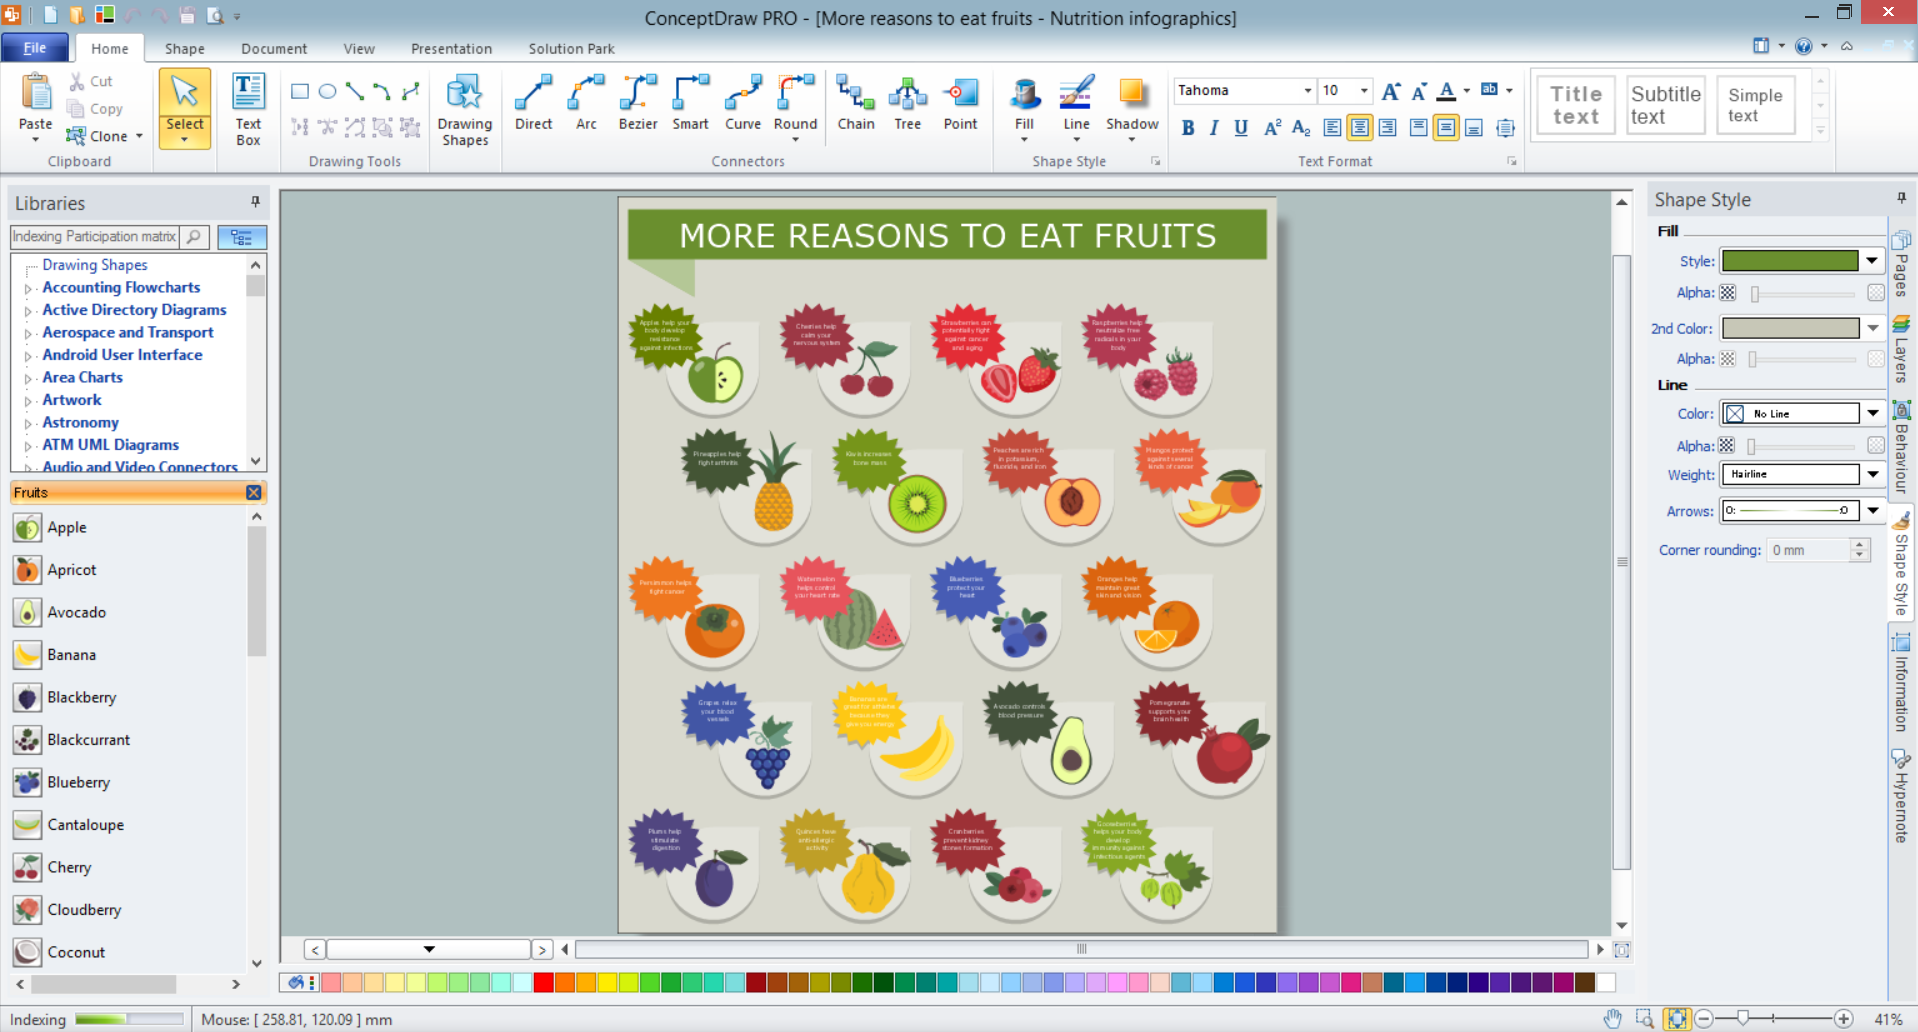
Picture: Fruit Art
Related Solution:
ConceptDraw
DIAGRAM 18