Diagramming Software for Business Process
Design Elements: Activities
For graphical representation of a business process flow use the business process diagrams consist of a sequence of activity elements and flow controls elements.
ConceptDraw has 142 vector stencils in the 8 libraries that helps you to start using software for designing your own Business Process Diagrams.
Use Activities library with 34 objects from BPMN. Comments from notation:
- Activity: It is represented with a rounded-corner rectangle and describes the kind of work which must be done.
- Task: Represents a single unit of work that can or cannot be broken down to a further level of business process detail without diagramming the steps in a procedure
- Sub-process: Used to hide or reveal additional levels of business process details. When collapsed, a sub-process is indicated by a plus sign against the bottom line of the rectangle; when expanded, the rounded rectangle expands to show all flow objects, connecting objects, and artifacts.
- Transaction: A form of sub-process in which all contained activities must be treated as a whole, this means that they must all be completed to meet an objective, and if any one of them fails, they must all be compensated (undone). Transactions are differentiated from expanded sub-processes by being surrounded by a double border.
- Call Activity: A point in the process where a global process or a global Task is reused. A call activity is differentiated from other activity types by a bolded border around the activity area.
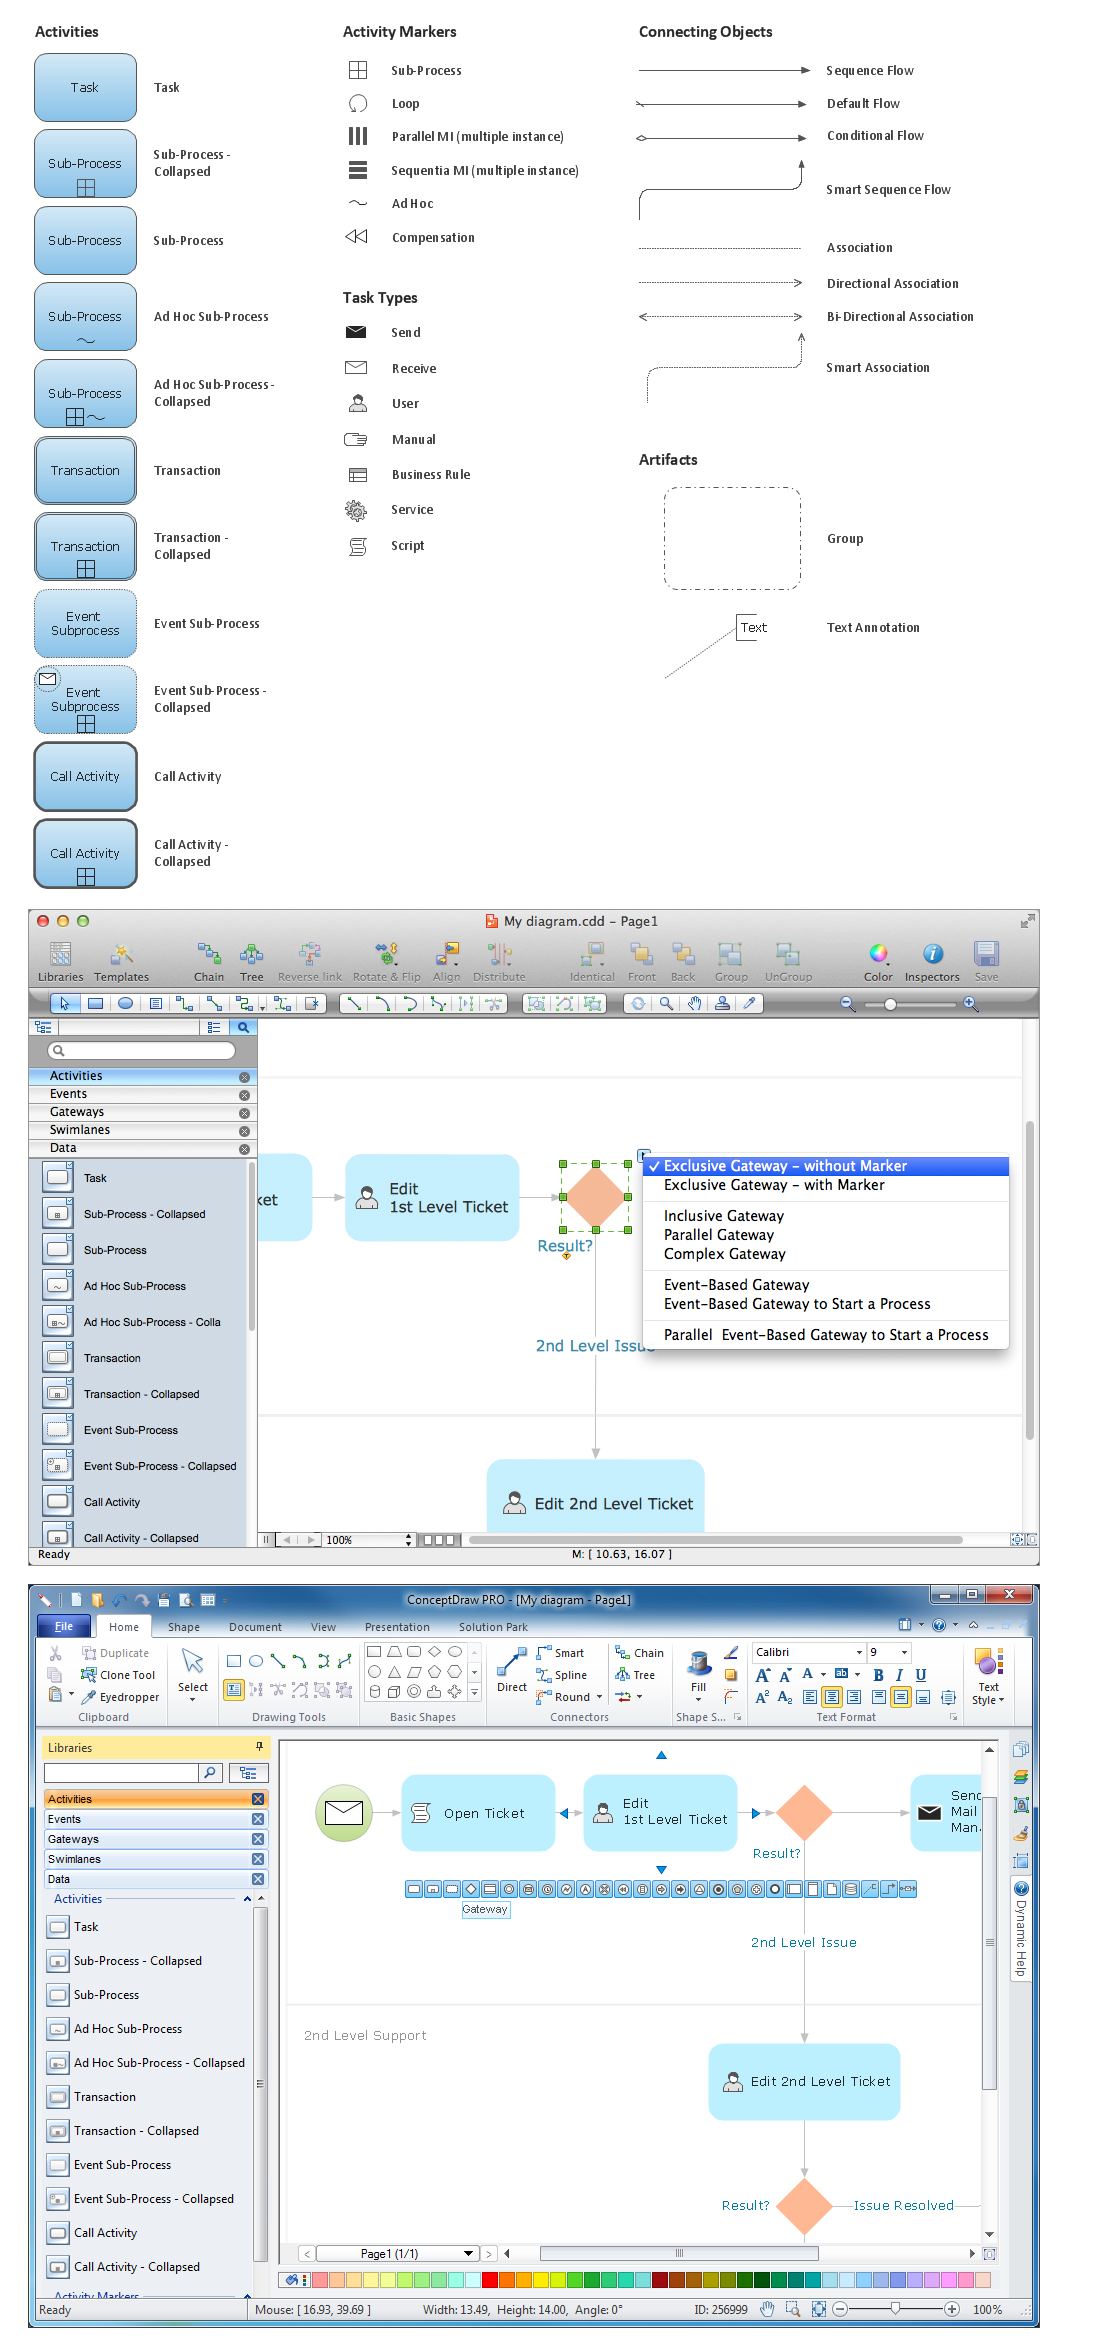
Activities library from Business Process Diagram solution provides 34 vector stencils for activity elements and flow controls elements: Activity, Task, Sub-process, Transaction, Call Activity, etc.
Use the Activities library for drawing the business process flow diagrams consisting of a sequence of activity and flow controls elements according to BPMN 2.0 notation.
EIGHT RELATED HOW TO's:
When used in different areas, flowcharts use specific symbols to depict different elements. ConceptDraw DIAGRAM offers libraries of symbols for many areas. One of such libraries is flowchart symbols accounting, which provides symbols for accounting diagrams. Activity-based costing calculates the costs of all products and services based on activities in an organization. A type of accounting flowchart that shows how costs are assigned to products with resources and activities is called Activity-based costing (ABC) flowchart. It can be designed in a digital drawing software such as ConceptDraw DIAGRAM.
Here is an accounting flowchart template and symbols. These flowchart symbols are applied for making accounting flow charts in ConceptDraw DIAGRAM and with its Accounting Flowcharts solution. An accounting flowchart is a specific type of a flow diagram. Practically a number of flowchart-type diagrams commonly utilized to clarify many parts of an accounting department working process. Accounting flowchart assists a process of preparing accounting documentation. It shows who responsible for implementation of each step in the workflow of accounting department.
Picture:
Flowchart Symbols Accounting
Activity-based costing (ABC) flowchartRelated Solution:
Use ConceptDraw DIAGRAM software with Flowcharts Solution to create Process Flow Charts, Flow Chart Process Maps, and High-Level Process Flow Charts to illustrate ✔️ high-level processes in industrial, chemical, and process engineering, ✔️ major plant processes, ✔️ minor details
Picture: Process Flow Chart
Related Solution:
UML Activity Diagram illustrates the business and operational step-by-step workflows of components in a system and shows the overall flow of control. You can use the appropriate stencils of UML notation from UML Activity library with 37 objects. ConceptDraw is ideal for software designers and software developers who need to draw UML Activity Diagrams.
Use ConceptDraw DIAGRAM diagramming and vector drawing software enhanced with Rapid UML solution from ConceptDraw Solution Park to create your own UML activity diagrams that show the business and operational workflows of components and overall flow of control in your systems. Such software provides coloring UML diagrams for various purposes and simplifying work of the engineers.
Picture: UML Activity Diagram
Related Solution:
UML Activity Diagram illustrate the business and operational step-by-step workflow of components in a system and shows the overall flow of control.
Picture: UML Activity Diagram. Design Elements
ConceptDraw has 142 vector stencils in the 8 libraries that helps you to start using software for designing own Business Process Diagrams. Use Swimlanes library with 20 objects from BPMN.
Picture: Business Process Elements: Swimlanes
Related Solution:
The vector stencils library SSADM from the solution Systems engineering contains specific symbols of SSADM diagrams for ConceptDraw DIAGRAM software.
Picture: SSADM Diagram
If you are just a beginner in drawing flowcharts, it may seem that a sheet of paper and a pen are just enough. However, at the time you would want to share your results, diagramming applications would suite you better. it’s very easy to create diagrams that way and to discover new kinds of flowcharts.
The huge collection of sample ConceptDraw diagrams, charts, illustrations and other types of business drawings includes a wide range of business themes. A huge number of graphic images of ConceptDraw documents is divides on business application areas according to business-oriented solutions for which they were made.Here is a short visual list of samples of flowcharts, process diagrams, UML models, management charts, computer network diagrams, maps, infographics, illustrations, etc. In short, each ConceptDraw solution is accompanied with at least ten samples representing some particular examples of the application of the given chart.
Picture: Applications
When trying to figure out the nature of the problems occurring within a project, there are many ways to develop such understanding. One of the most common ways to document processes for further improvement is to draw a process flowchart, which depicts the activities of the process arranged in sequential order — this is business process management. ConceptDraw DIAGRAM is business process mapping software with impressive range of productivity features for business process management and classic project management. This business process management software is helpful for many purposes from different payment processes, or manufacturing processes to chemical processes. Business process mapping flowcharts helps clarify the actual workflow of different people engaged in the same process. This samples were made with ConceptDraw DIAGRAM — business process mapping software for flowcharting and used as classic visio alternative because its briefly named "visio for mac" and for windows, this sort of software named the business process management tools.
This flowchart diagram shows a process flow of project management. The diagram that is presented here depicts the project life cycle that is basic for the most of project management methods. Breaking a project into phases allows to track it in the proper manner. Through separation on phases, the total workflow of a project is divided into some foreseeable components, thus making it easier to follow the project status. A project life cycle commonly includes: initiation, definition, design, development and implementation phases. Distinguished method to show parallel and interdependent processes, as well as project life cycle relationships. A flowchart diagram is often used as visual guide to project. For instance, it used by marketing project management software for visualizing stages of marketing activities or as project management workflow tools. Created with ConceptDraw DIAGRAM — business process mapping software which is flowcharting visio alternative or shortly its visio for mac, this sort of software platform often named the business process management tools.
Picture: Process Flowchart: A Step-by-Step Comprehensive Guide
Related Solution:
ConceptDraw
DIAGRAM 18