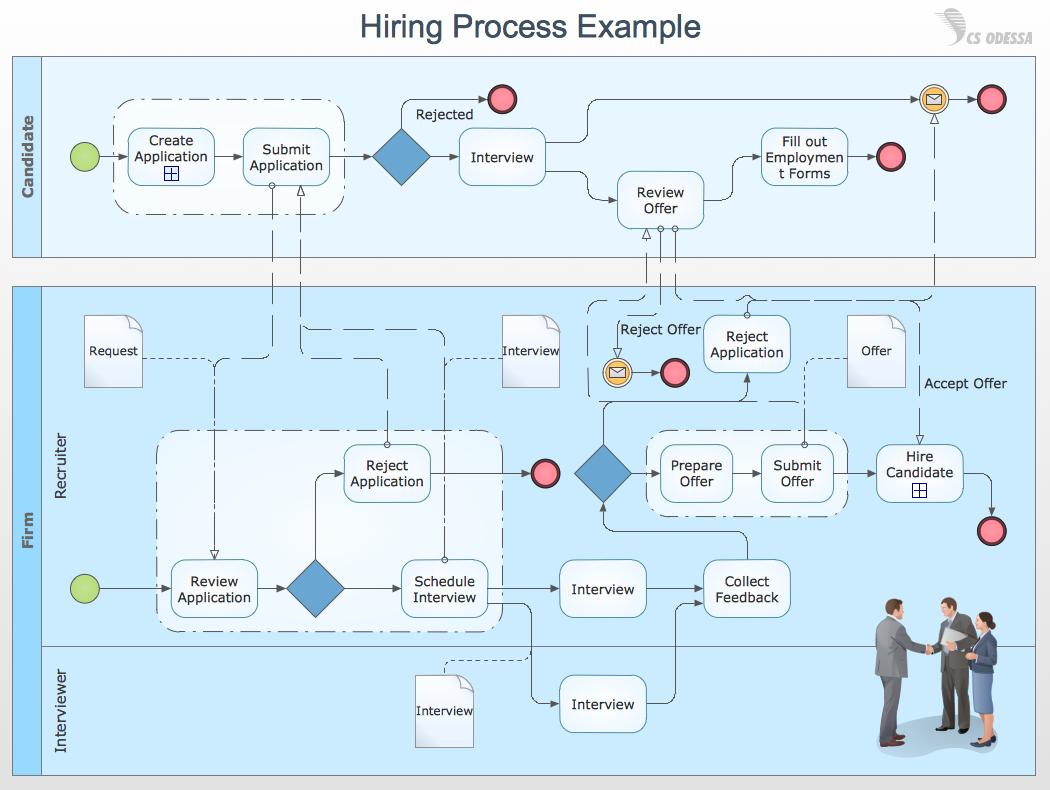
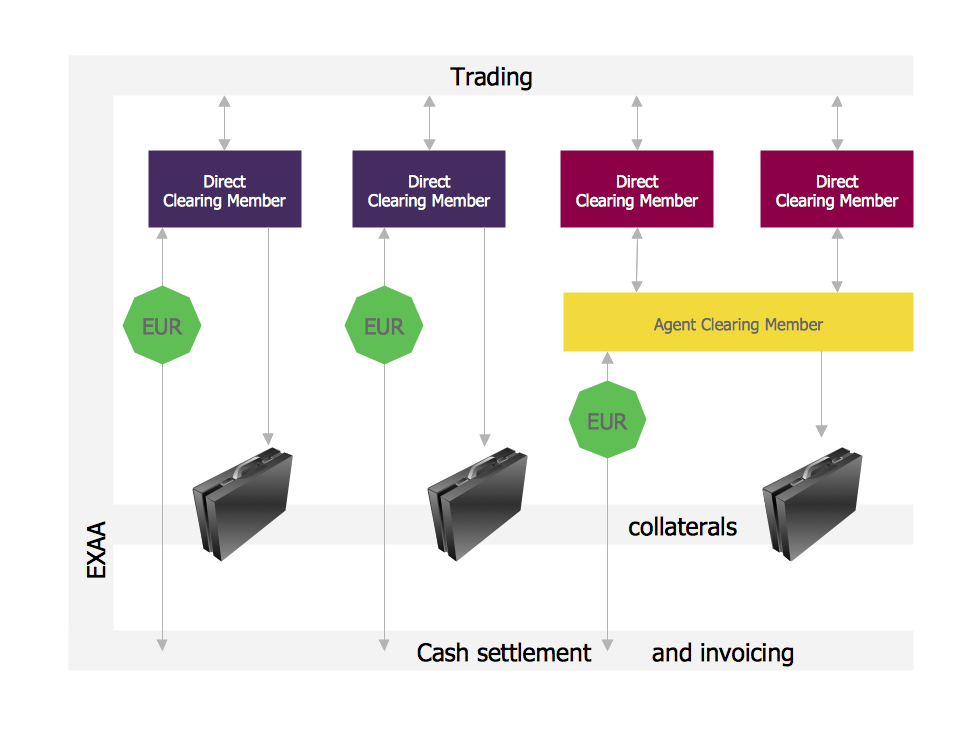
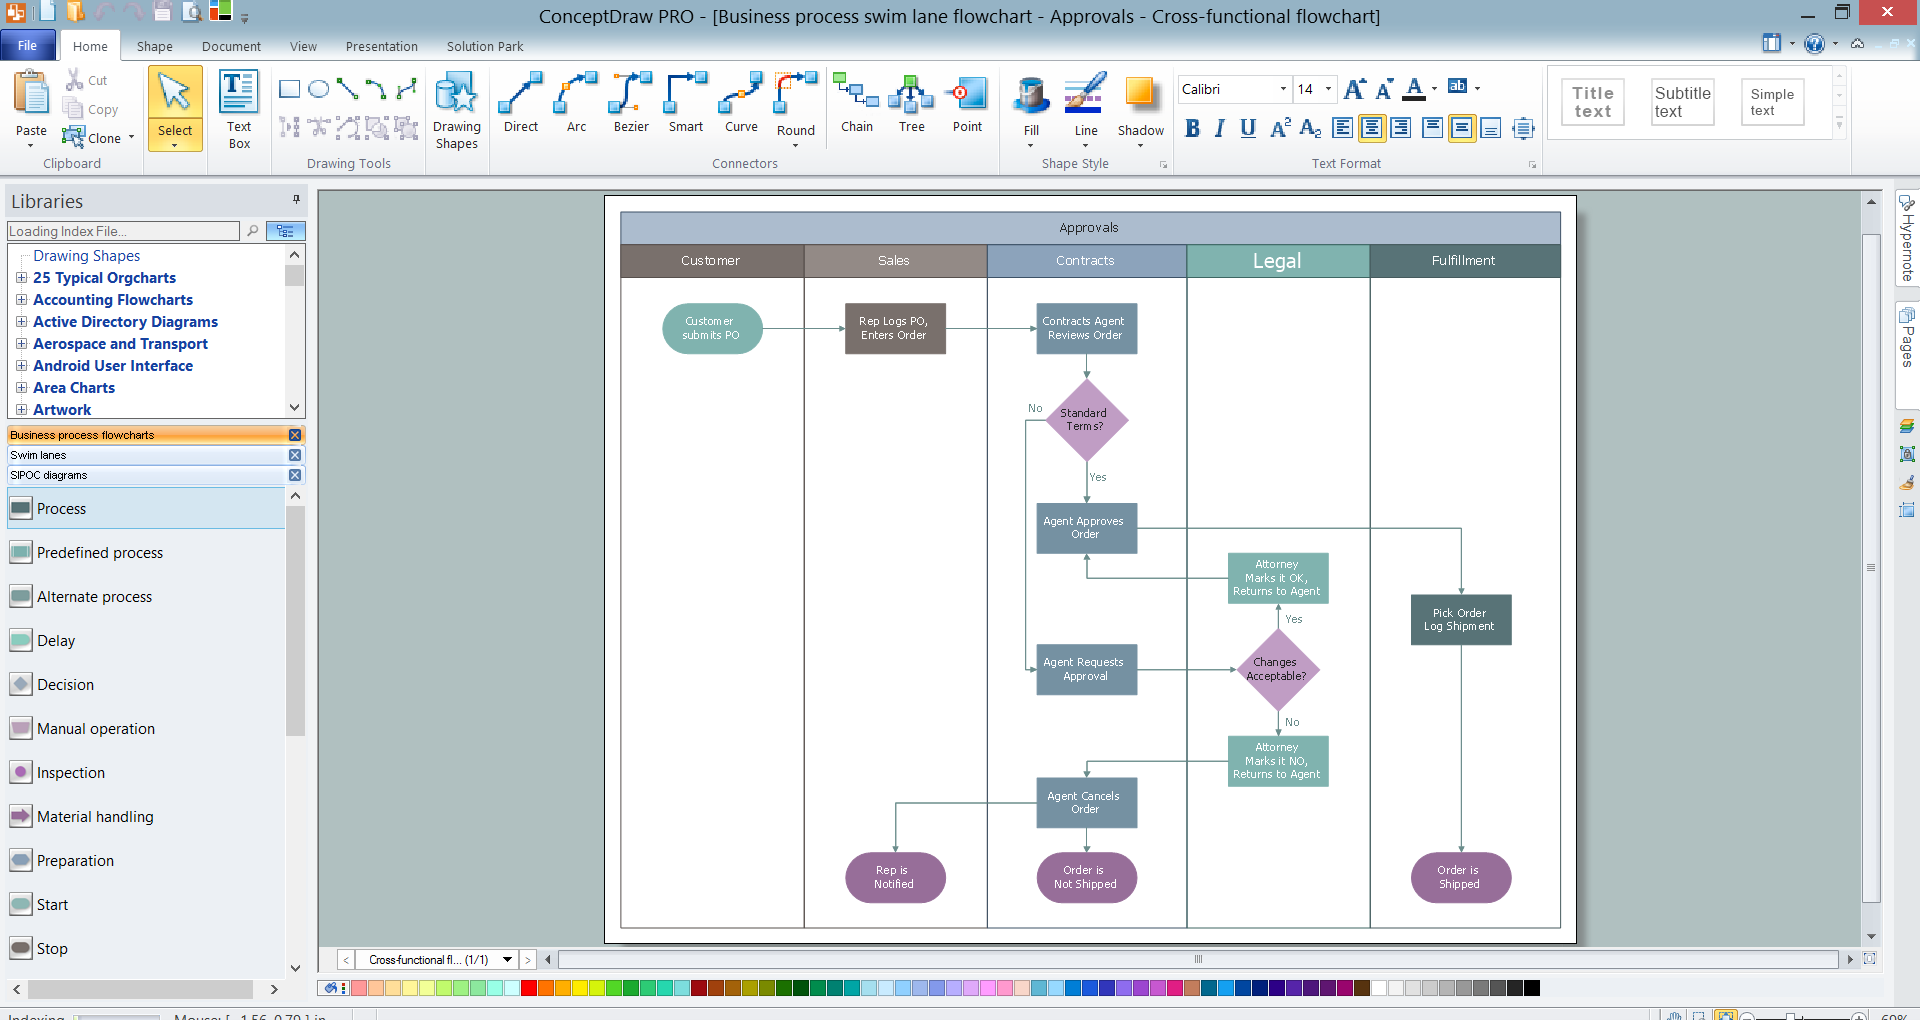
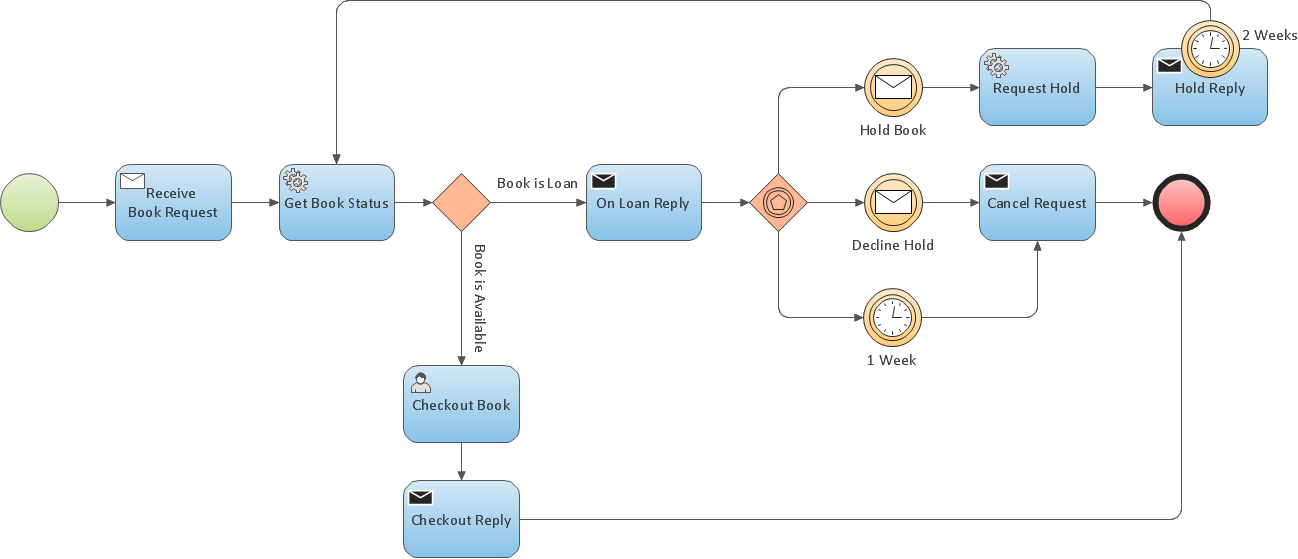
Business Process Model and Notation Elements: Activities
For graphical representation of a business process flow use the business process diagrams consist of a sequence of activity elements and flow controls elements.
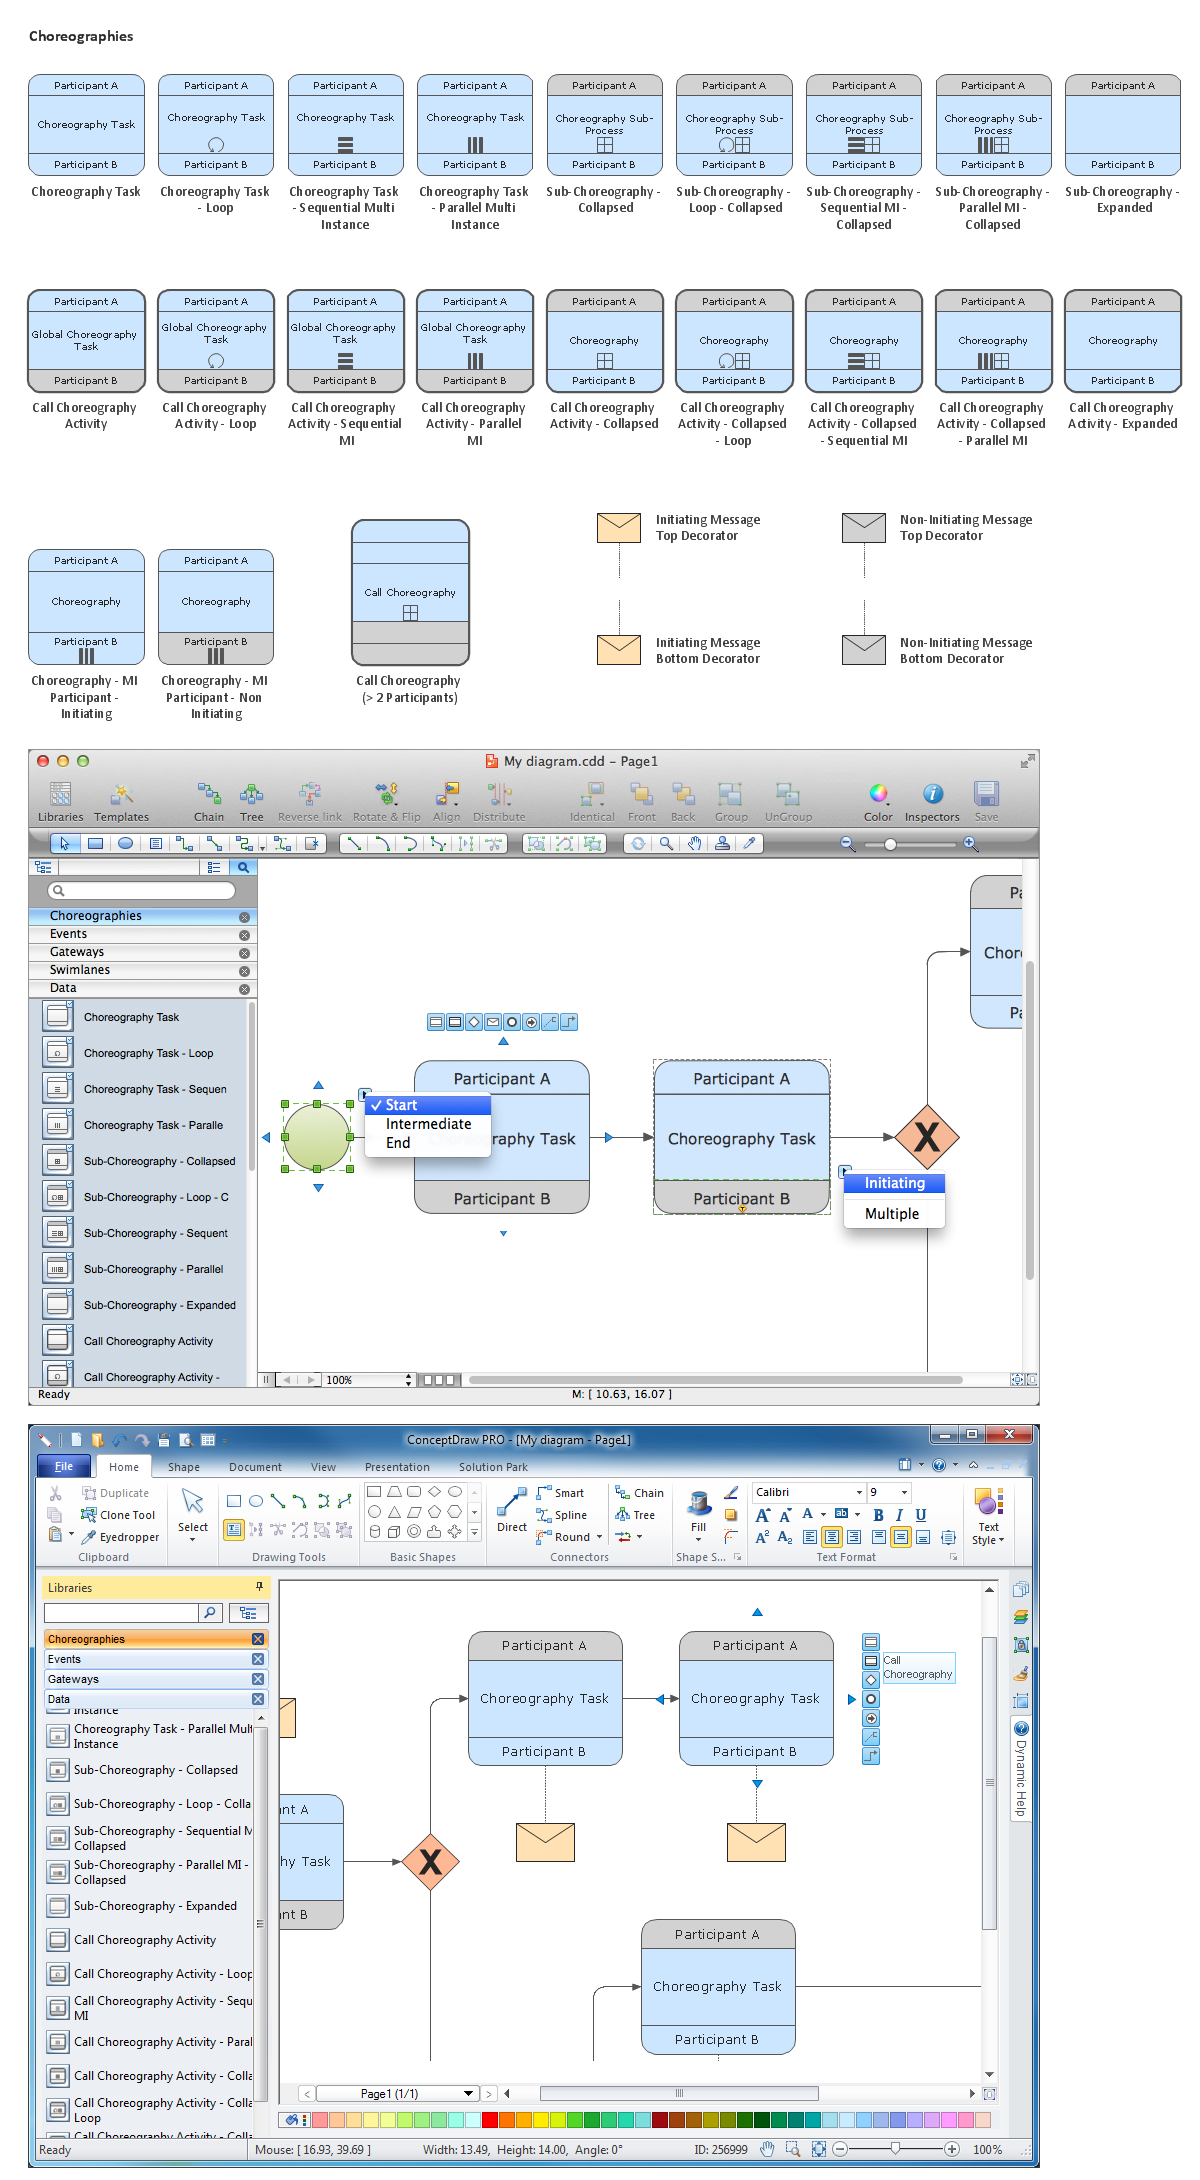
ConceptDraw DIAGRAM has 142 vector stencils in the 8 libraries that helps you to start using software for designing own Business Process Diagrams.
Use Activities library with 34 objects from Business Process Model and Notation. Comments from notation:
- Activity: It is represented with a rounded-corner rectangle and describes the kind of work which must be done.
- Task: Represents a single unit of work that can or cannot be broken down to a further level of business process detail without diagramming the steps in a procedure
- Sub-process: Used to hide or reveal additional levels of business process detail. When collapsed, a sub-process is indicated by a plus sign against the bottom line of the rectangle; when expanded, the rounded rectangle expands to show all flow objects, connecting objects, and artifacts.
- Transaction: A form of sub-process in which all contained activities must be treated as a whole, this means that they must all be completed to meet an objective, and if any one of them fails, they must all be compensated (undone). Transactions are differentiated from expanded sub-processes by being surrounded by a double border.
- Call Activity: A point in the process where a global process or a global Task is reused. A call activity is differentiated from other activity types by a bolded border around the activity area.
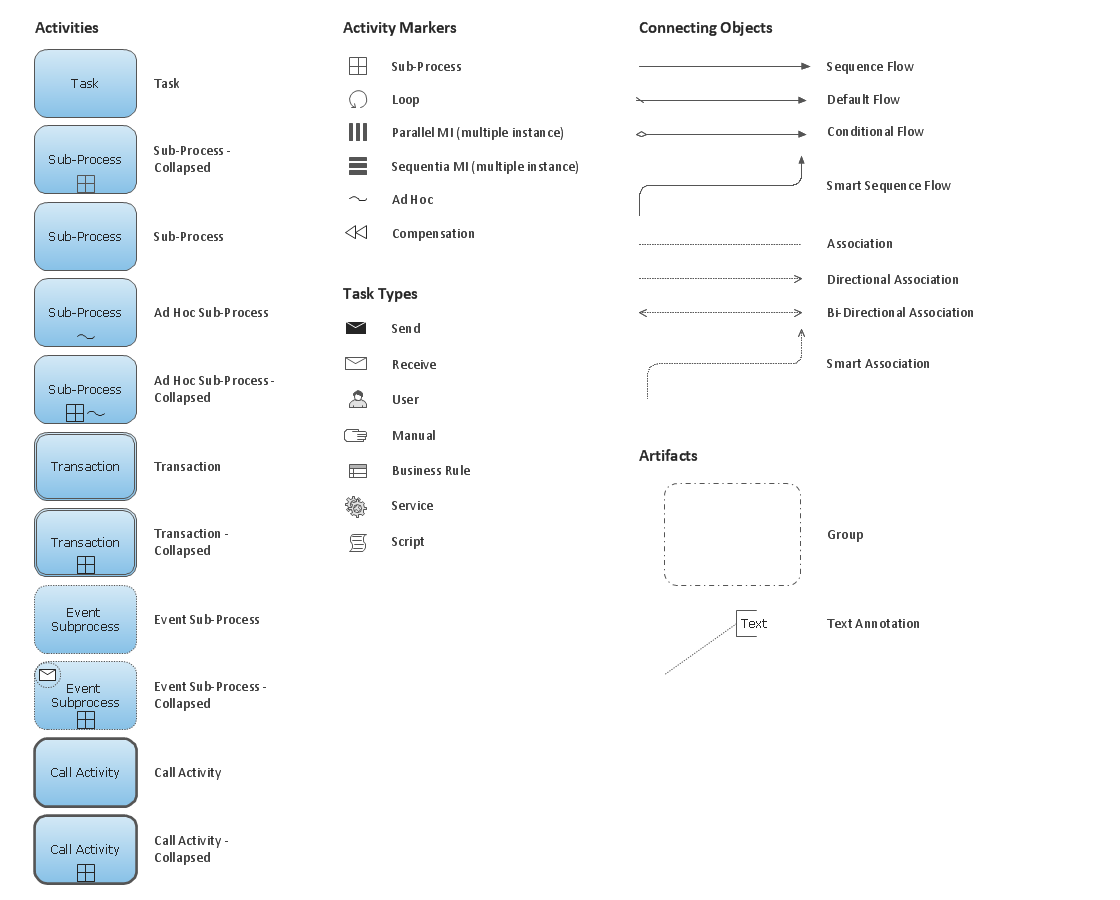
Activities library from Business Process Diagram solution provides 34 vector stencils for activity elements and flow controls elements: Activity, Task, Sub-process, Transaction, Call Activity, etc.
Use the Activities library for drawing the business process flow diagrams consisting of a sequence of activity and flow controls elements according to BPMN 2.0 notation.
TEN RELATED HOW TO's:
Data flow diagrams are the graphical tool, used in the visualization of data flow of some data processing systems. It is the valuable process modeling tool. Also designing DFD is the important component of the initial part of any information system development project. The standard symbols are used to represent the interaction of a system components and how various kinds of components influence on data flow. The ConceptDraw Data Flow Diagrams solution is design to assist professional software engineers in making DFDs according to Gane and Sarson, and Yourdon and Coad notations.
Do you imagine yourself as a successful IT specialist? To your mind, they all use data flow diagram examples to learn and to get inspired. Aren’t you still with us?
Picture: Data Flow Diagram Examples
Related Solution:
This sample shows the Flowchart of the testing the work of the lamp and decision making about what to do to lamp will work.
Picture: Samples of Flowchart
Related Solution:
The ConceptDraw Flowchart component includes a set of samples and templates. This geathered as flowchart maker toolbox which focused on drawing flowcharts of any industry standards.
Picture: Flowchart Components
Related Solution:
Business Process Modeling Notation -BPMN- is a set of standard symbols that allow you to create a graphical view of a business process. The symbols were developed to help users develop standard, unified structure of processes, and any messages shared between these processes. This is business process improvement tools.
Picture: Business Process Modeling with ConceptDraw
Related Solution:
When you need a drawing software to create a professional looking cross-functional charts, ConceptDraw with its Arrows10 Technology - is more than enough versatility to draw any type of diagram with any degree of complexity.
Use templates with process maps, diagrams, charts to get the drawing in minutes.
Picture: Cross-Functional Process Map Template
Create professional business process diagram with ConceptDraw Choreographies library with 28 objects from BPMN.
Picture: Diagramming Software for Business Process
Create your own flow charts of settlement processes using the ConceptDraw DIAGRAM diagramming and vector drawing software extended with the Cross-Functional Flowcharts solution from the Business Processes area of ConceptDraw Solution Park.
Download easy flowchart software to create settlement process flowcharts show steps of monthly settlement with your business quickly and easily.
Picture: Settlement Process Flowchart. Flowchart Examples
Related Solution:
Swim lanes are visual elements used in Business Process Maps, Process Flow Diagrams and Flowcharts.
ConceptDraw DIAGRAM diagramming and vector drawing software extended with Business Process Mapping Solution from the Business Processes Area of ConceptDraw Solution Park is ideal for drawing Business Process Maps and Swim Lanes Flowcharts.
Picture: Swim Lanes
Related Solution:
ConceptDraw DIAGRAM is a best business processes modeling software for graphical documenting processes of the company.
Picture: Business Process Modeling Resume
Lean Six Sigma (LSS) is a well-known in all over the world methodology of quality improvement and business perfection. ConceptDraw DIAGRAM diagramming and vector drawing software is a powerful Lean Six Sigma Diagram Software thanks to the included Value Stream Mapping solution from the Quality Management Area of ConceptDraw Solution Park.
Picture: Lean Six Sigma Diagram Software
Related Solution: