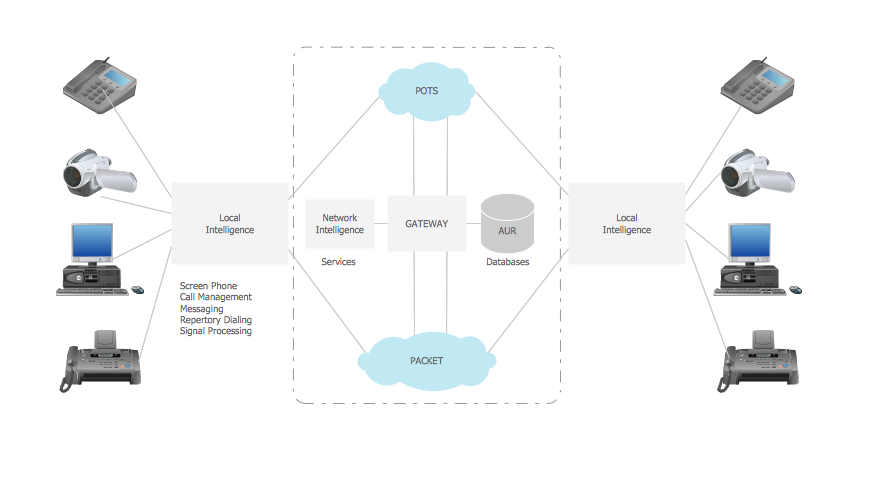
Model Based Systems Engineering
ConceptDraw DIAGRAM is a useful software for those working in very many different fields of the business activity including those involved in the modelling the systems within the systems engineering management.
The systems engineering itself is an interdisciplinary field of engineering as well as management focused on the way of designing and managing the complex systems during all their life cycles. All those involved in the systems engineering activity are expected to be involved in utilizing the systems thinking principles for organizing the mentioned body of knowledge. The issues may be: requirements engineering, logistics, reliability, coordination of the different teams involved in the process of modelling the systems, evaluation and maintainability, testing and many more other disciplines within the successful system development, design, ultimate decommission and implementation becoming more difficult while dealing with complex as well as the large projects.
Systems engineering itself deals with the optimization methods, risk management and the work-processes tools in the described projects, overlapping both technical and human-centred disciplines such as, for example, the industrial engineering, manufacturing engineering, mechanical engineering, control engineering, software engineering, cybernetics, organizational studies, engineering management, project management and electrical engineering. The activities being conducted within the systems engineering field of business are known to be ensuring the fact that all the aspects of a system or project are considered, as well as integrated into a whole.
The ongoing processes with the systems engineering business activity are the discovery ones, unlike the manufacturing ones, as the manufacturing processes are those, focused on the repetitive activities for achieving only high quality outputs spending the less the better — both money and time. Comparing to the mentioned manufacturing processes, the systems engineering ones must begin with discovering the real problems which are known to be resolved, identifying the highest or most probable impact failures occurring, involving the process of finding the elegant solutions to the mentioned problems.
Such field of the business activity as systems engineering is the one signifying only one approach as well as a discipline within the study of engineering. The main goal of education in systems engineering is to formalize different approaches. In doing so, it is also needed to identify the new methods as well as the research opportunities, which are similar to those occurring in the other fields of such study, as engineering.
Systems engineering is a widely as well as commonly known study arising with the increase in complexity of projects as well as systems in a whole in a way of increasing the possibility of any component friction and so the unreliability of the design. The complexity incorporates the logical human organization of data, apart from the engineering systems. At the same time, a system can become more complex by increasing its size as well as increasing the amount of data, the number of fields involved in the design and the variables.
The development of the smarter algorithms used in controlling the processes, the microprocessor design as well as the analysis of the environmental systems also come within the study of the systems engineering, using the methods as well as tools for managing and comprehending the complexity in systems in a much better way. Some examples of these tools can be related to such terms, as the “system architecture”, “system model”, “system modelling”, “simulation”, “optimization”, “system dynamics”, “systems analysis”, “statistical analysis”, “reliability analysis” and “decision making” activities. Although there’s a gap that exists between the informal requirements from operators, users, technical specifications and marketing organizations, it is successfully bridged within the mentioned study.
The so called model-based systems engineering is also known to be called simply as “MBSE”. The mentioned systems are basically the systems taken into consideration within the engineering methodology, which focuses on exploiting and creating domain models as if they were the primary means of the information exchange between engineers, but not on the document-based information exchange.
The focus within the mentioned model-based systems engineering has recently also started to cover such aspects as those related to the model execution in computer simulation experiment. It is done for overcoming the existing gap between the respective simulation software and the system model specification. Such term as “Modelling and Simulation-based Systems Engineering”, also known as “M&SBSE”, has also been widely used along with model-based systems engineering.
The model-based systems engineering approach was widely popularized by INCOSE in January 2007, defining the goals, including the increased productivity as well as minimizing all the unnecessary manual transcription of concepts while coordinating the work of all the large teams. The model-based systems engineering approach is outlined with a methodology, which is known to be focusing on the distributed but the integrated model management.
In order to create any needed model within the systems engineering field of business activity, you can always use the progressive as well as innovative software — ConceptDraw DIAGRAM The mentioned diagramming and drawing tool is nowadays a very commonly used application for making any needed drawings, including the models within the previously described model-based systems engineering using the SysML Solution from ConceptDraw STORE application, available for all the ConceptDraw DIAGRAM users.
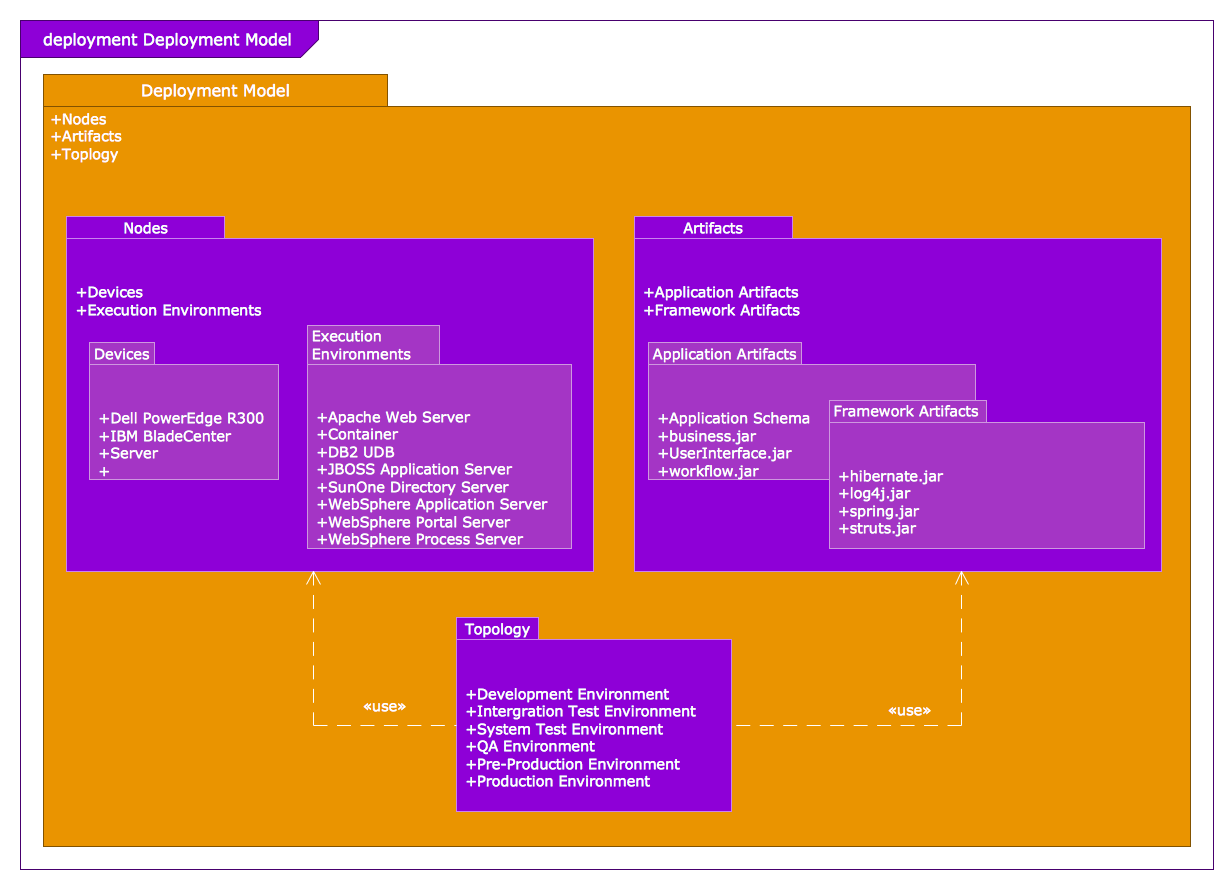
Example 1. Model Based Systems Engineering. Package Diagram — Deployment Model Structure
SYSML Solution provides powerful drawing tools, numerous collection of predesigned SysML diagrams and systems process models, and 13 libraries with 284 ready-to-use vector objects for designing SysML diagrams of any level of detail.

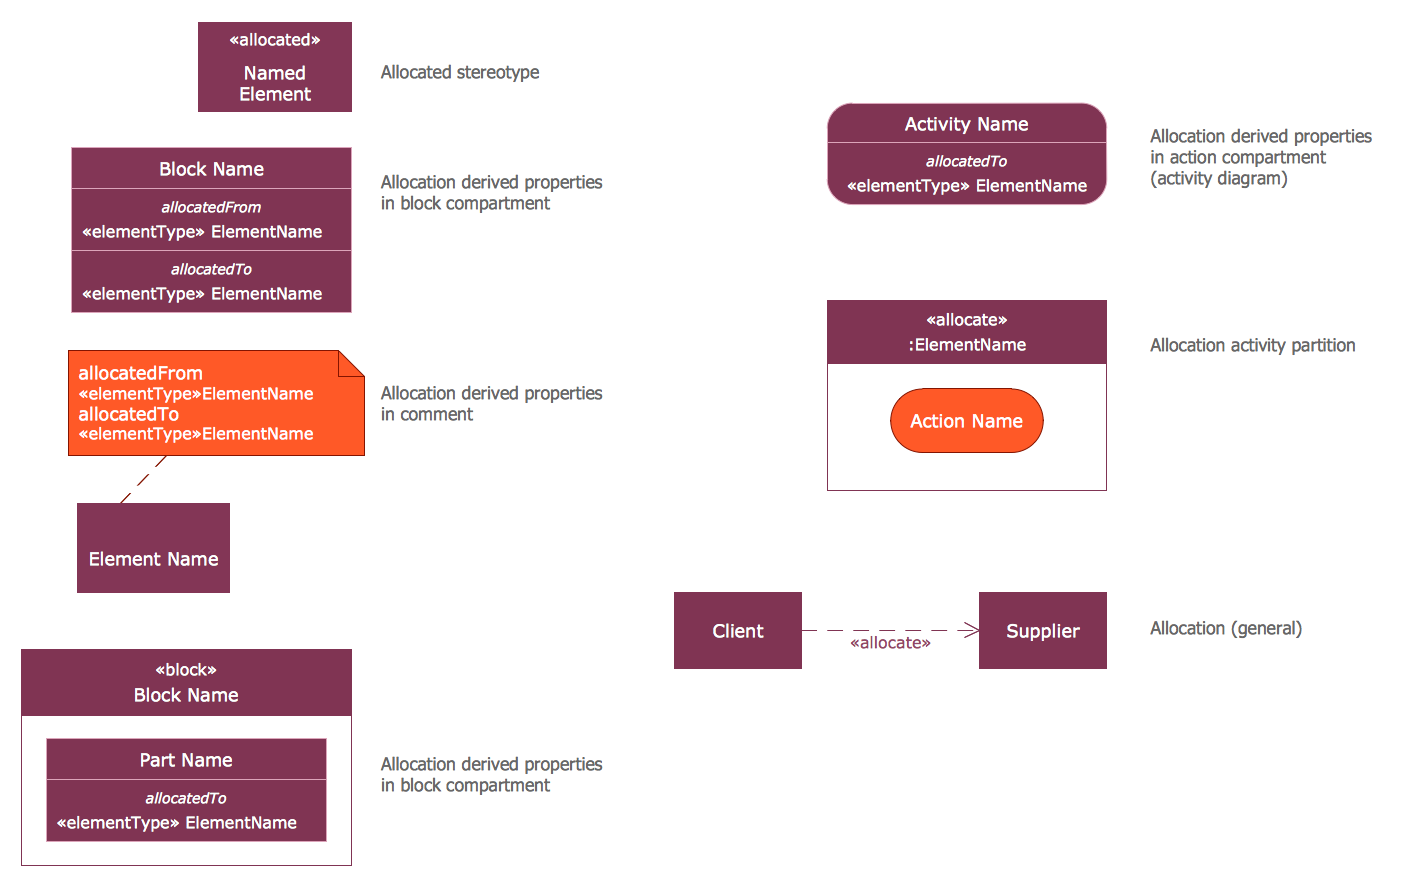
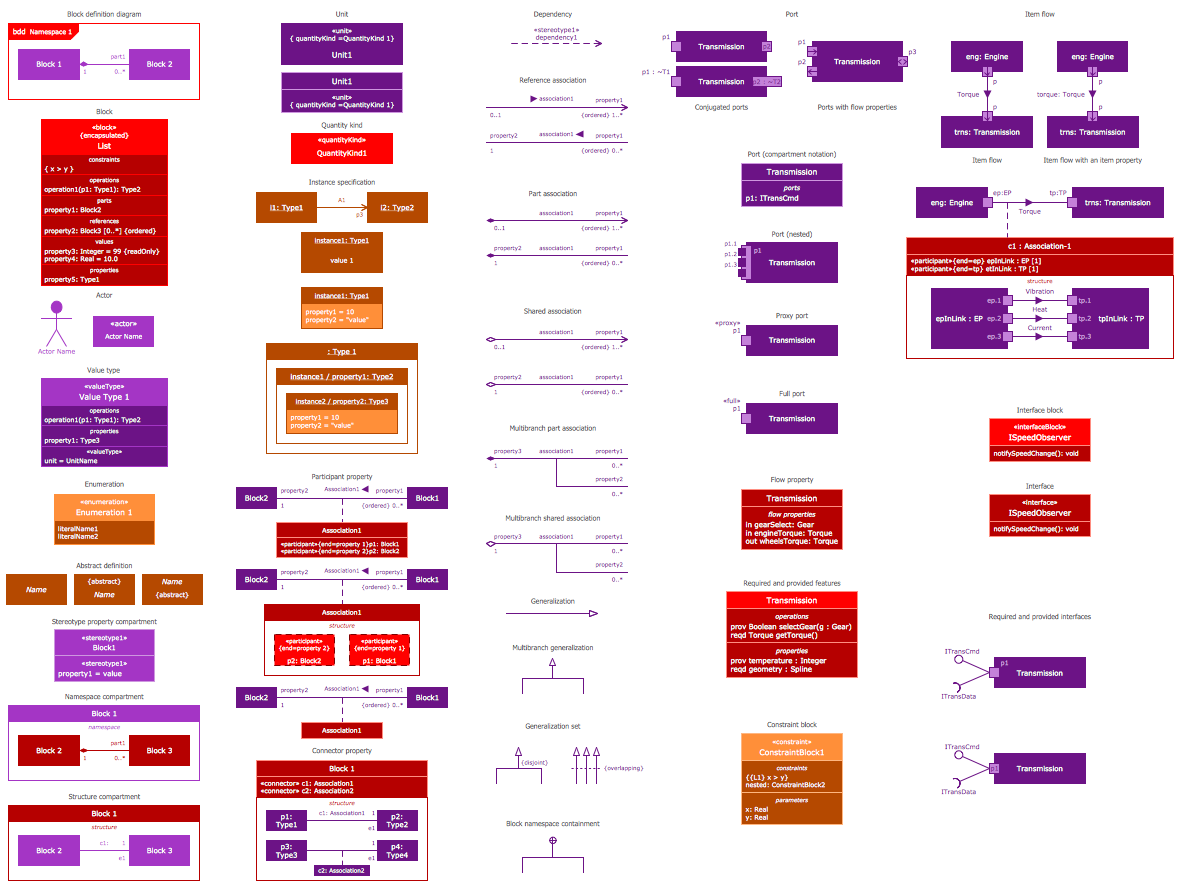
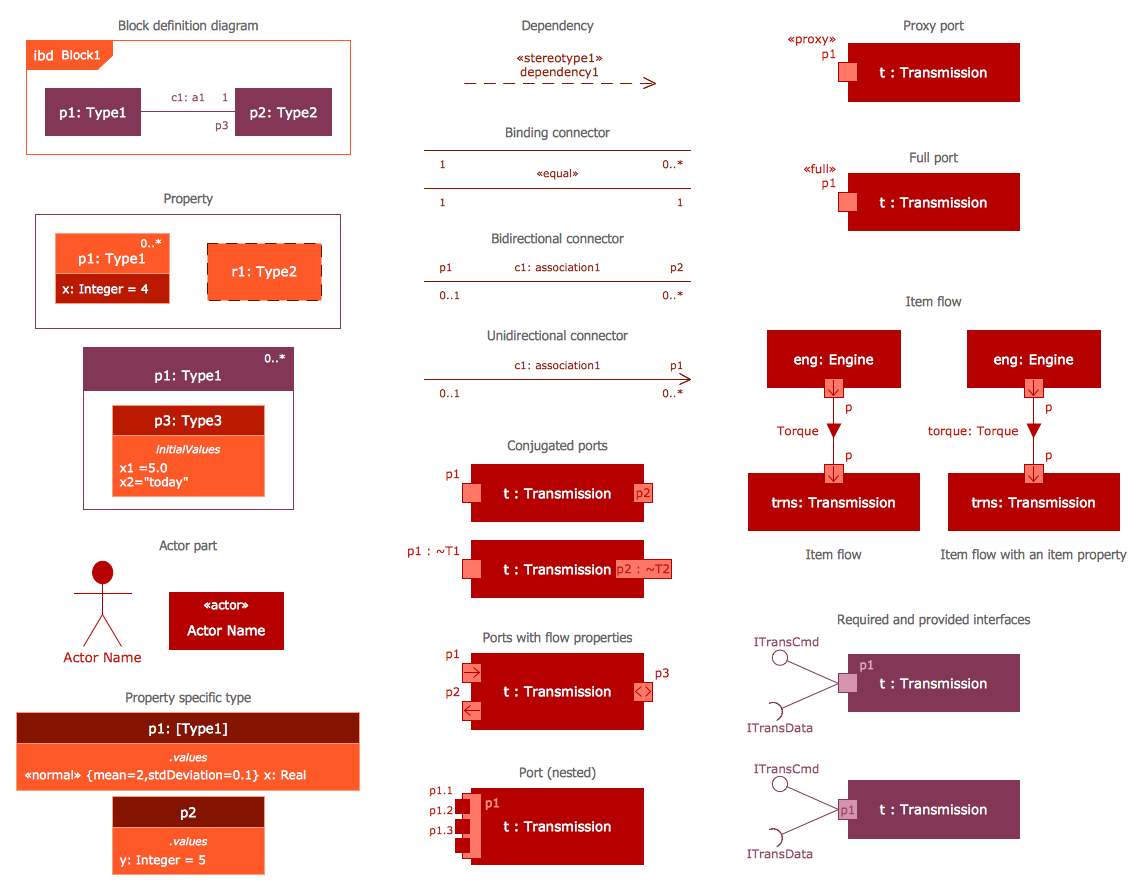
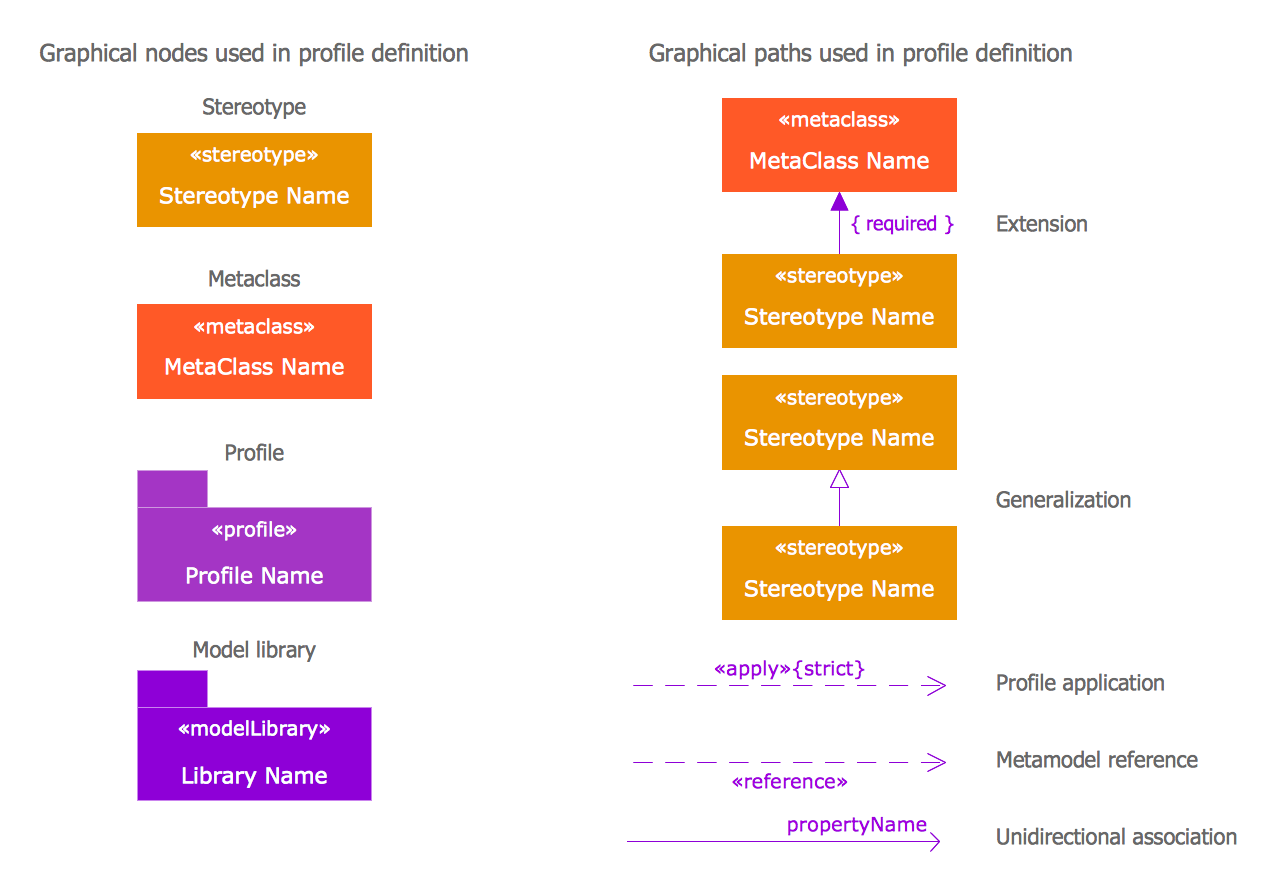
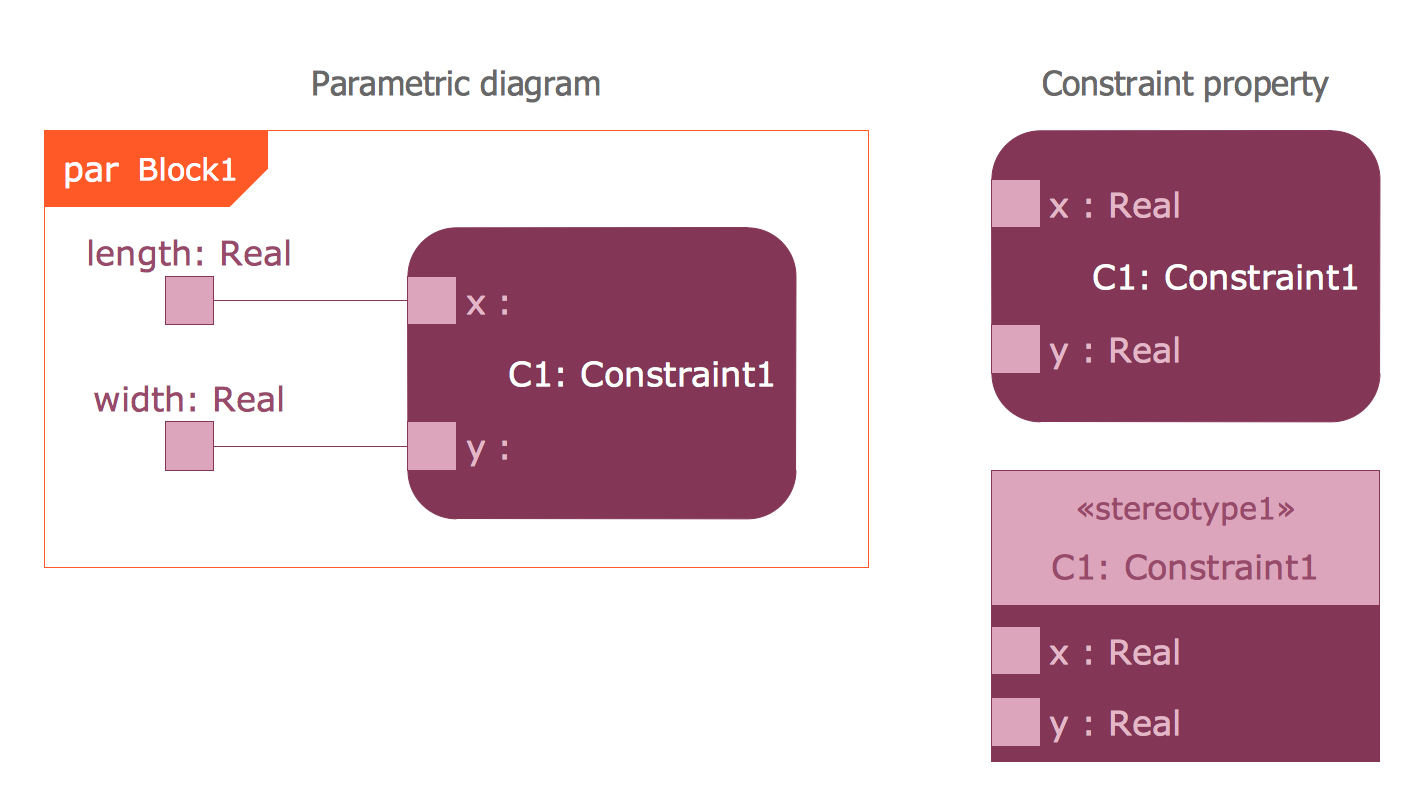
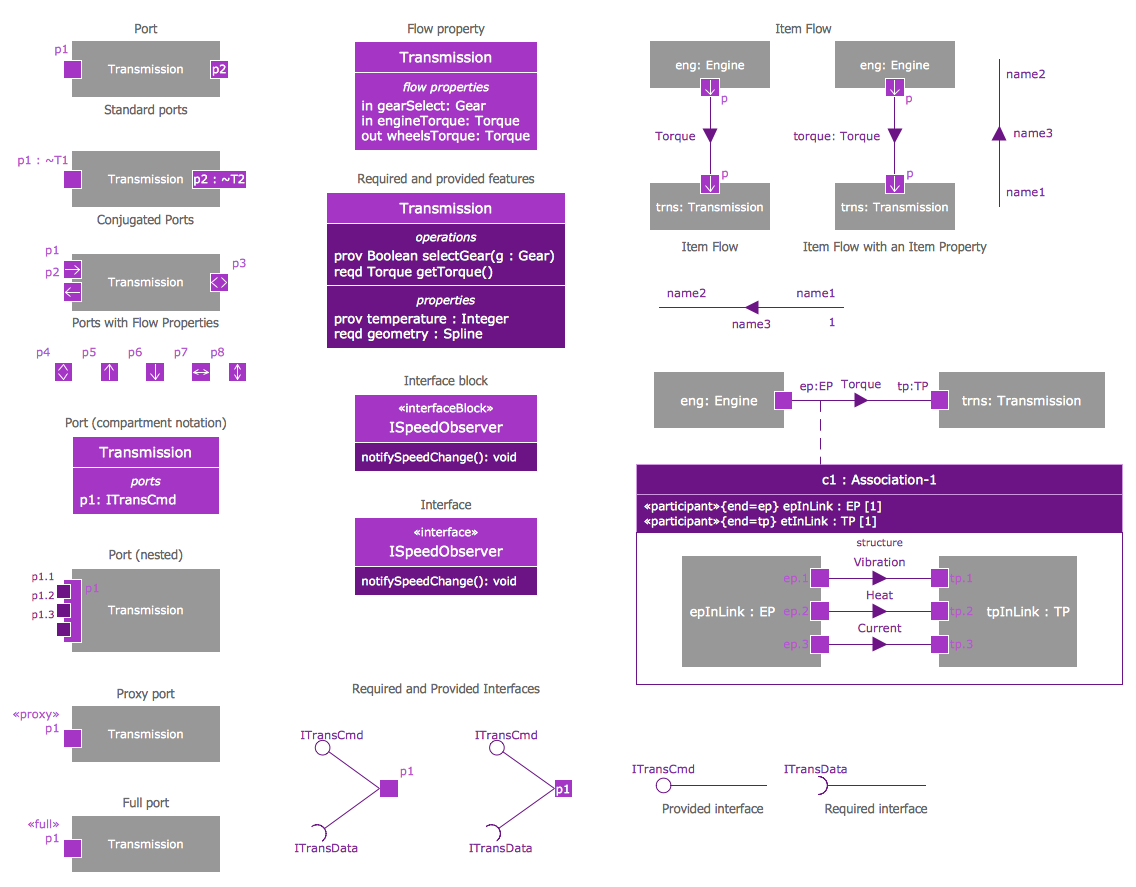
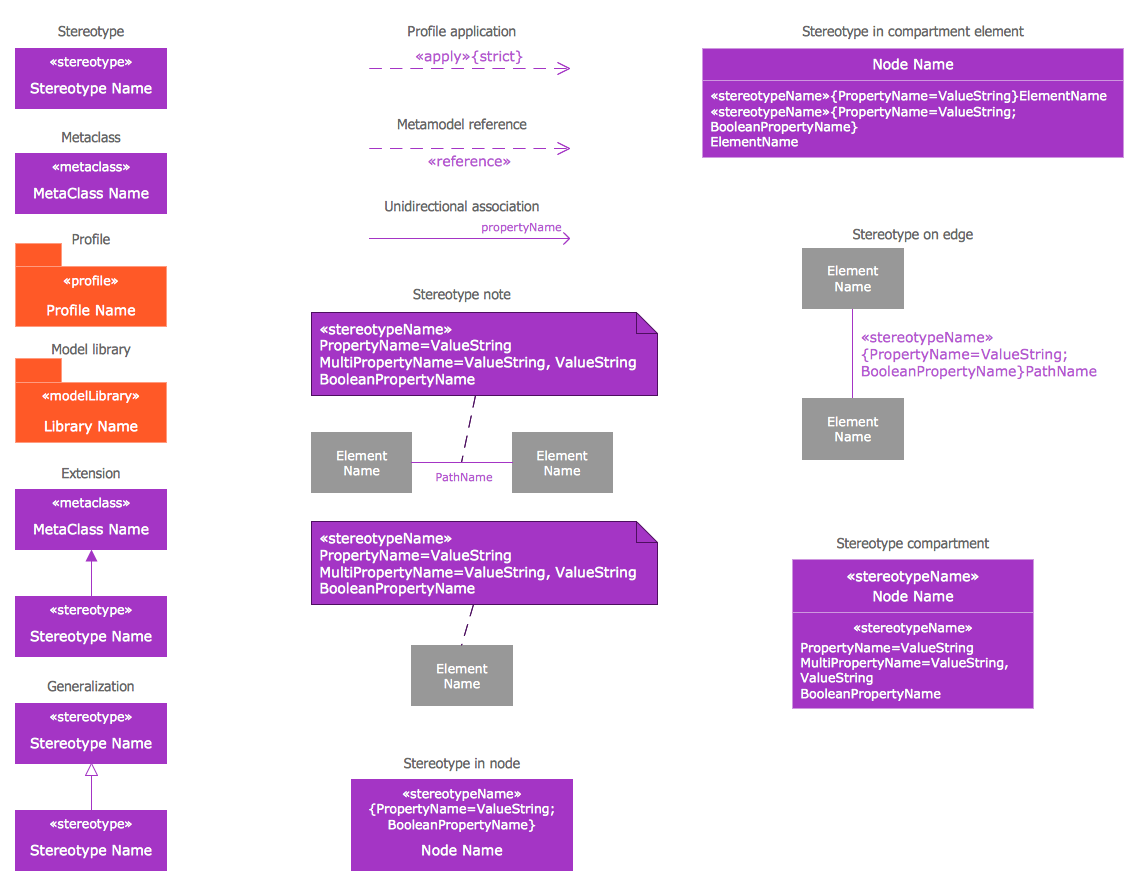
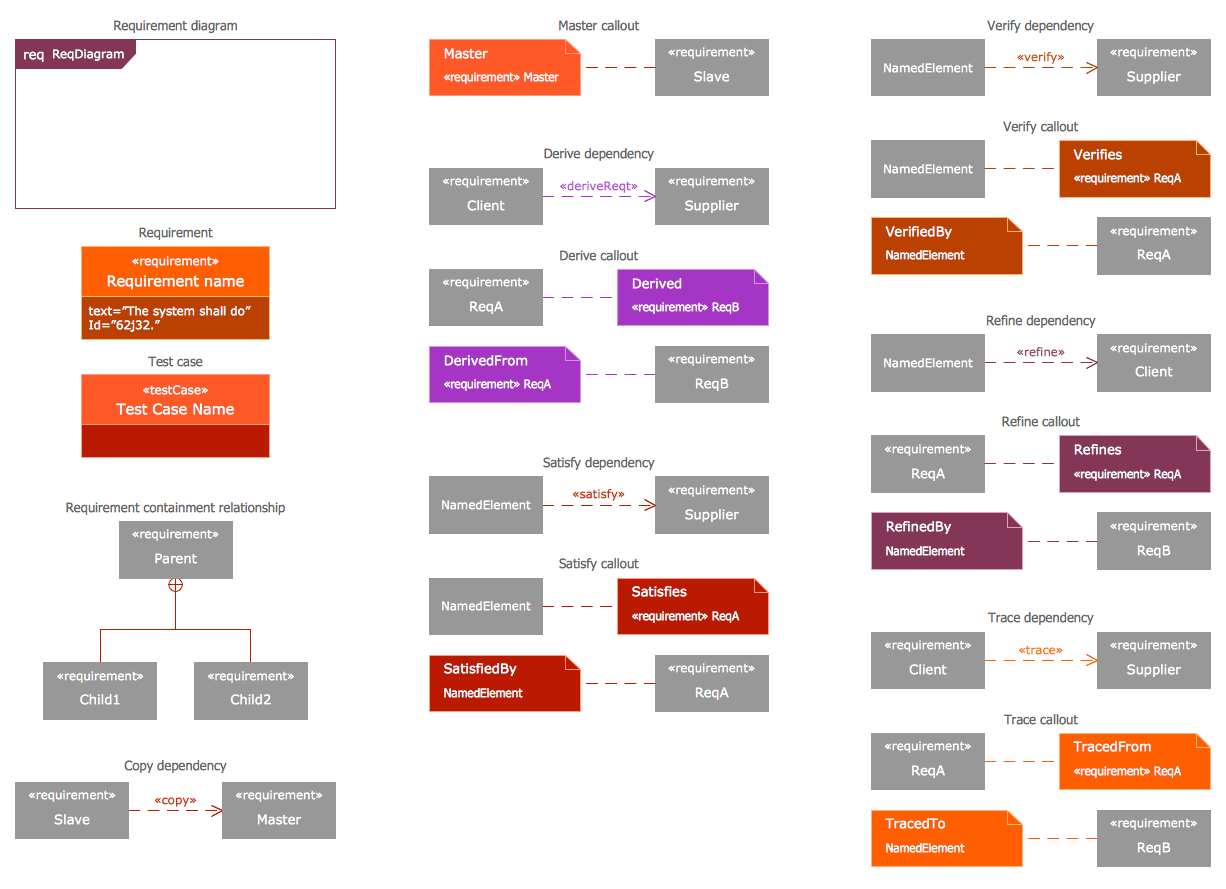
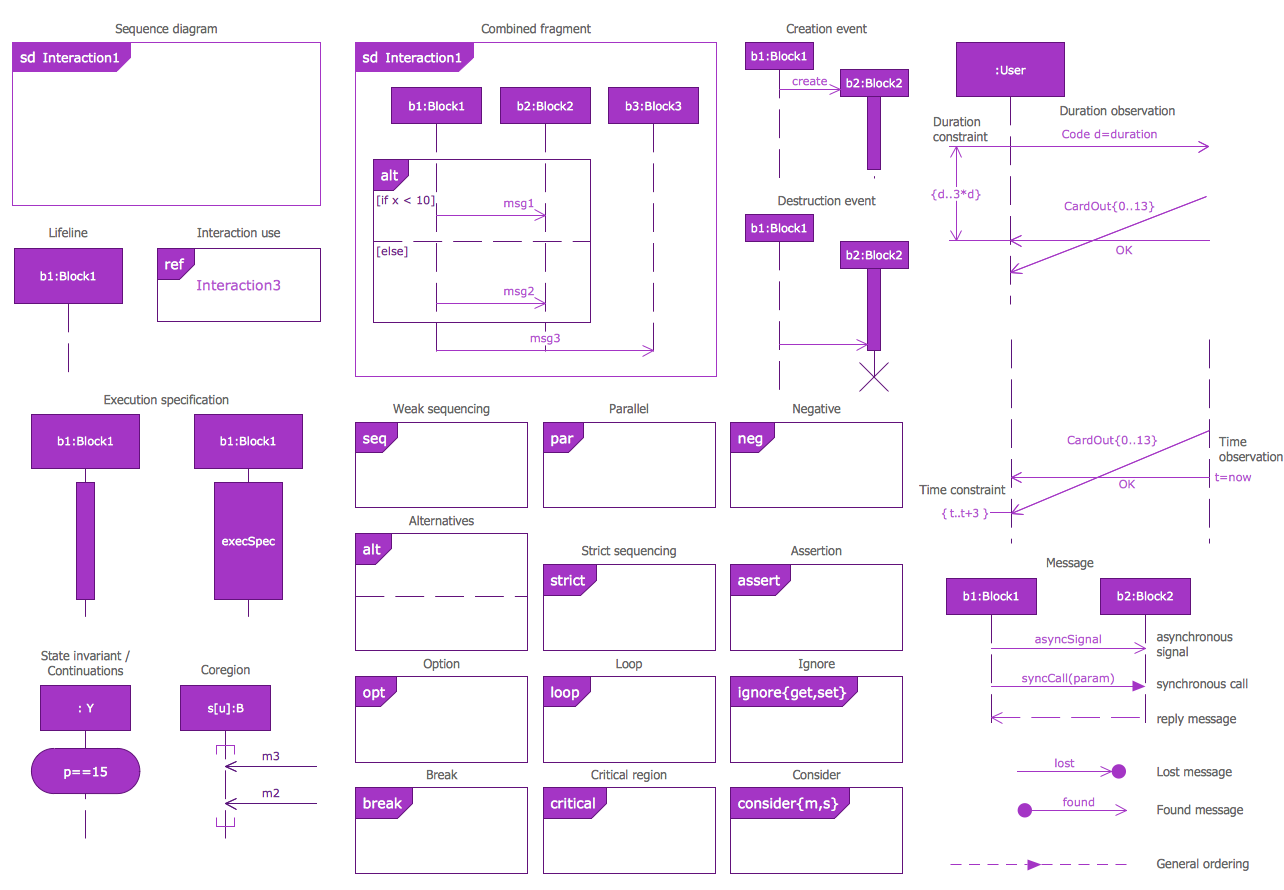
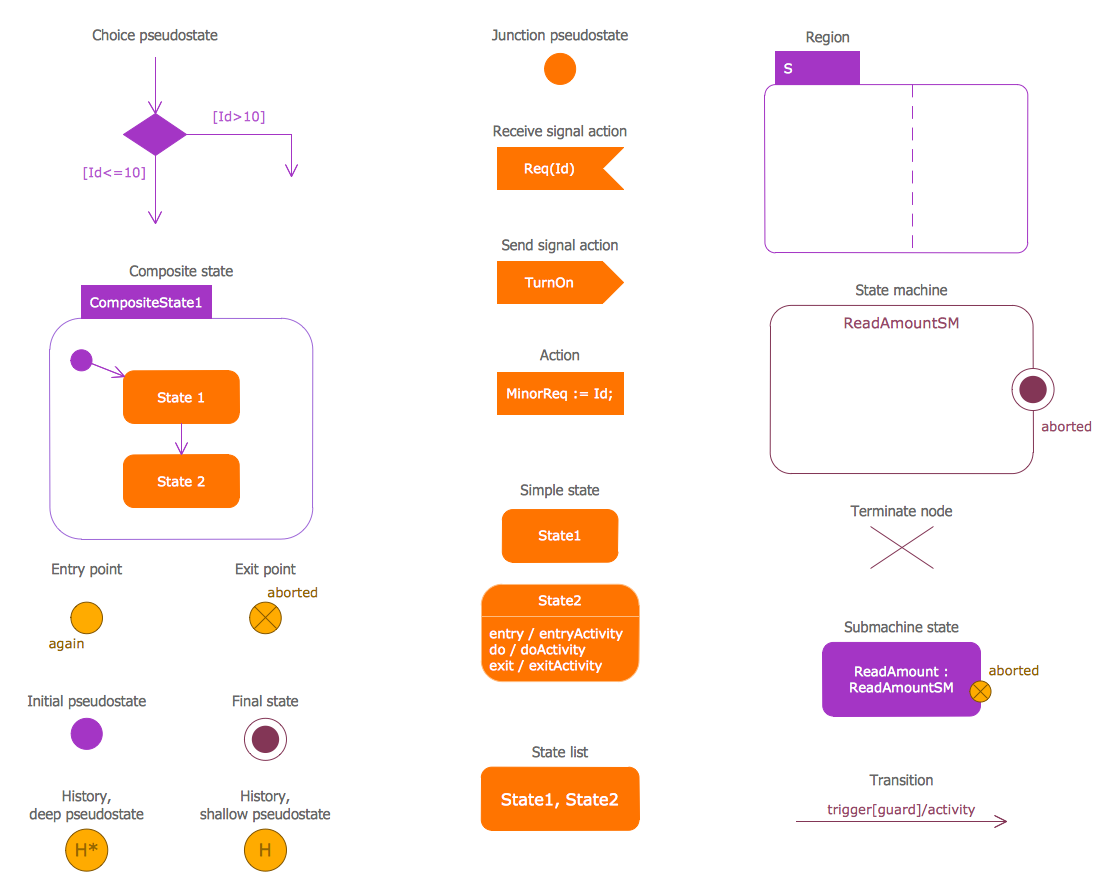
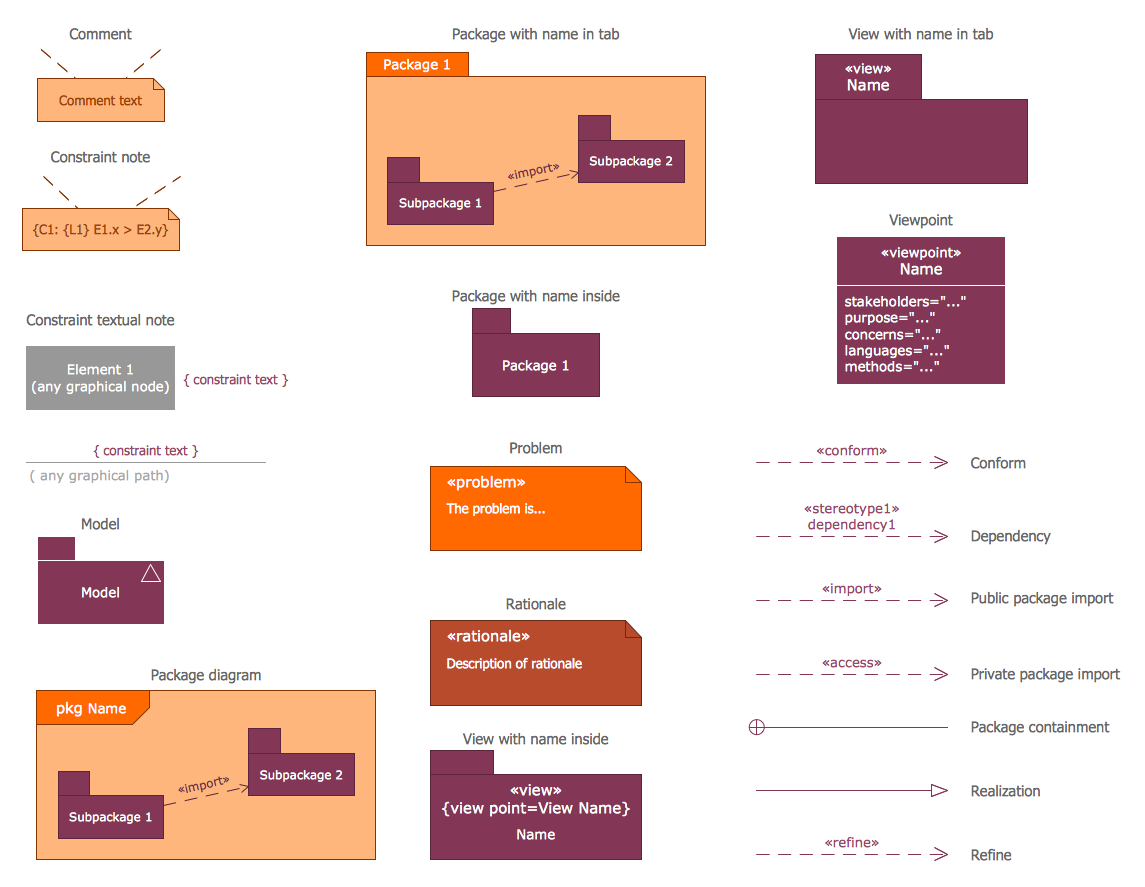
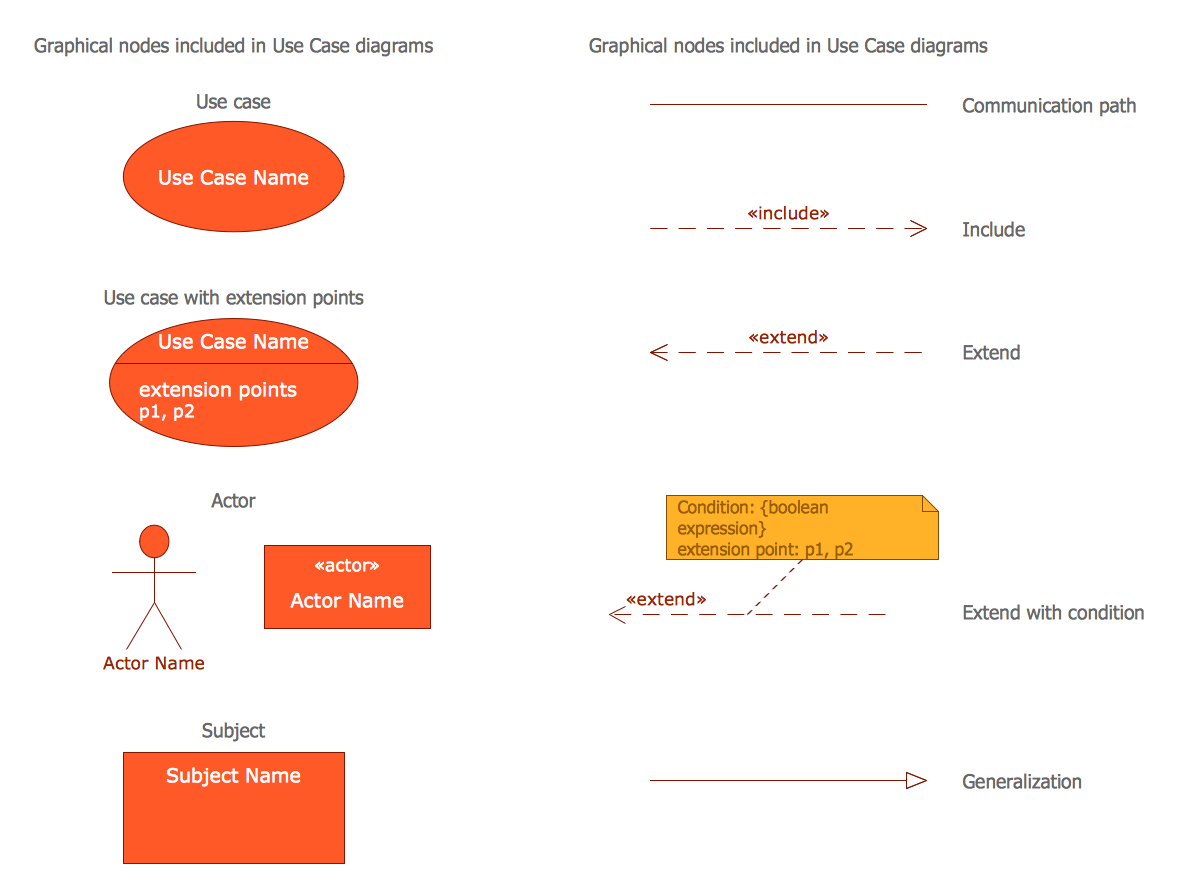
Thanks to these libraries, all that you need is simply drag the needed objects to your ConceptDraw document and arrange them according to your model idea.
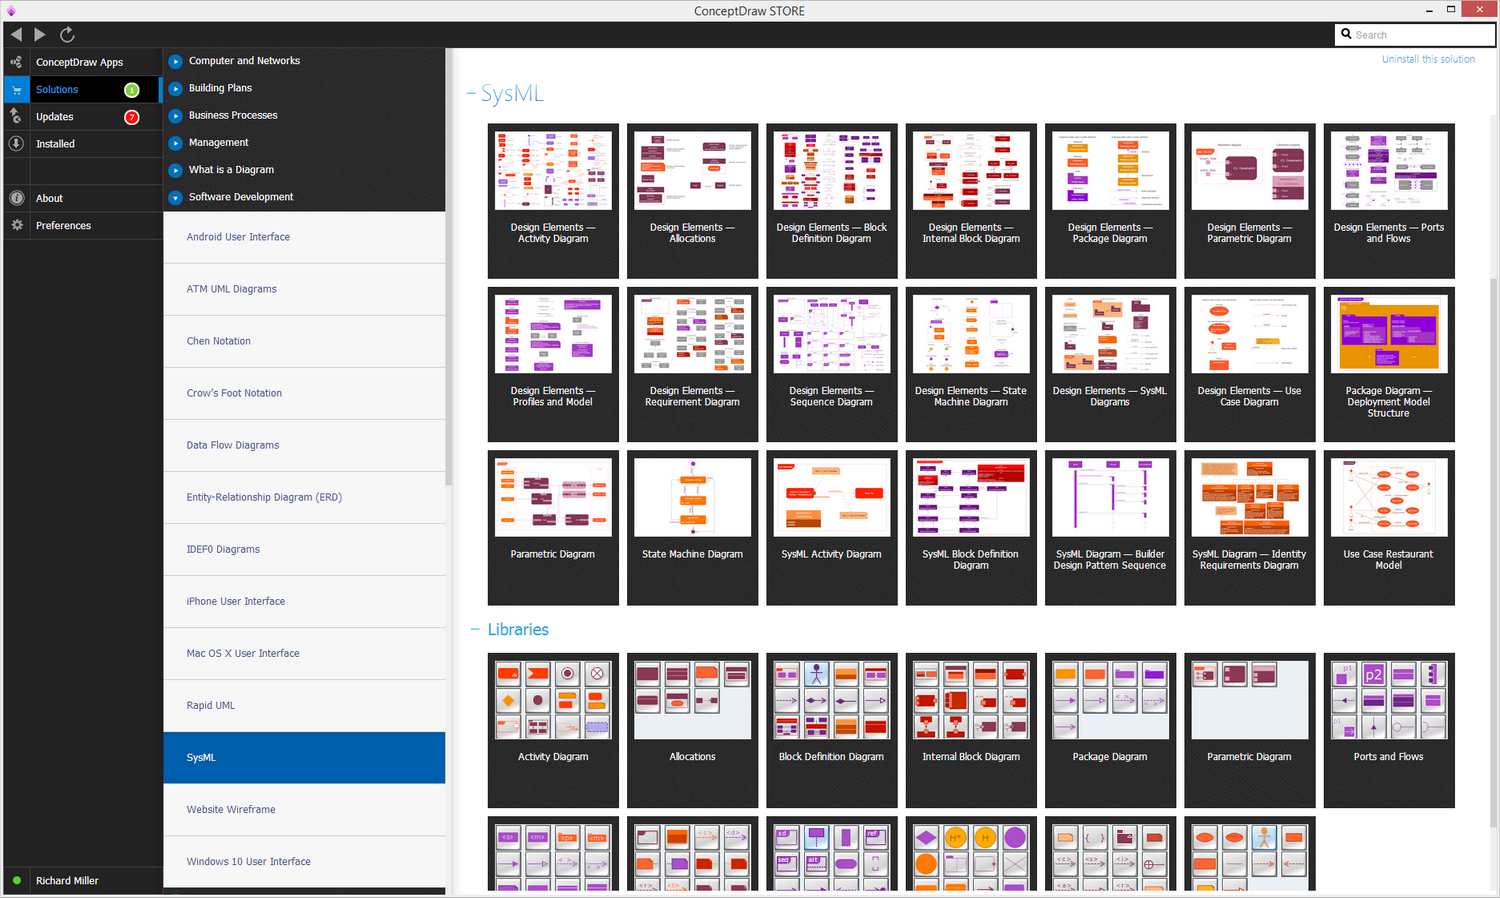
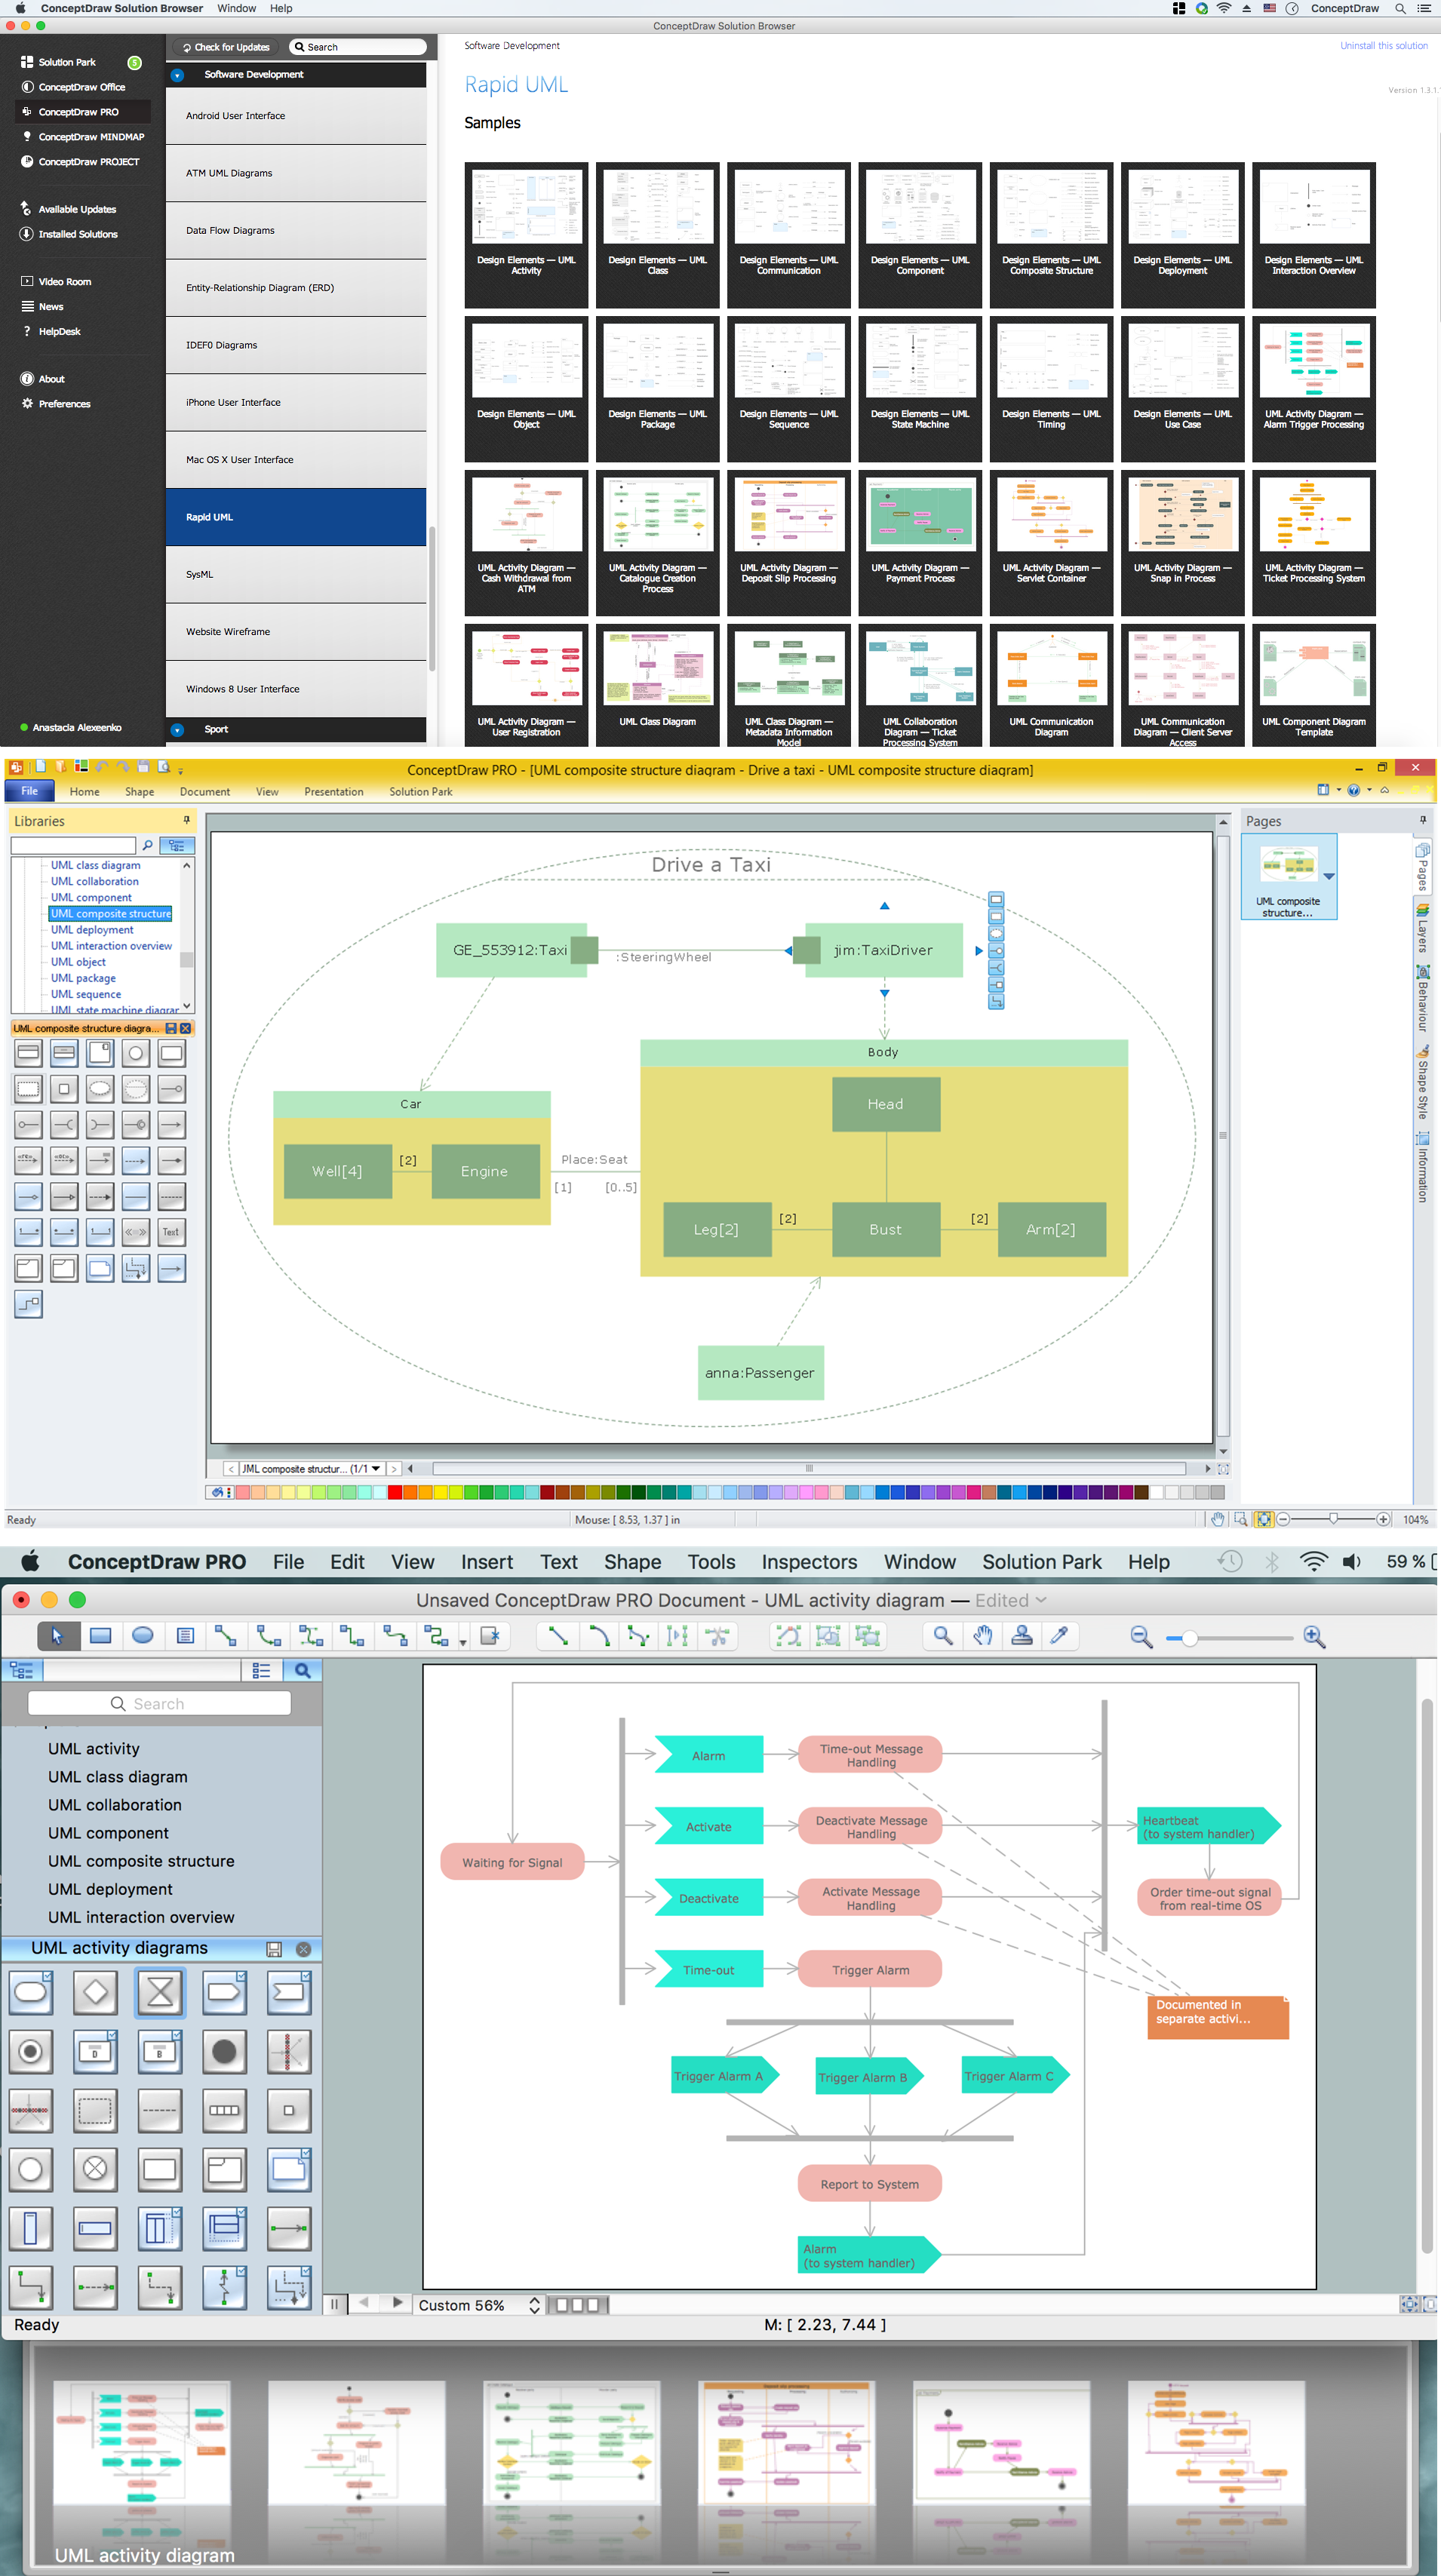
Example 2. SysML Solution in ConceptDraw STORE
SysML solution contains also variety of examples and samples of SysML diagrams of different types. All they are available for viewing and editing from ConceptDraw STORE.
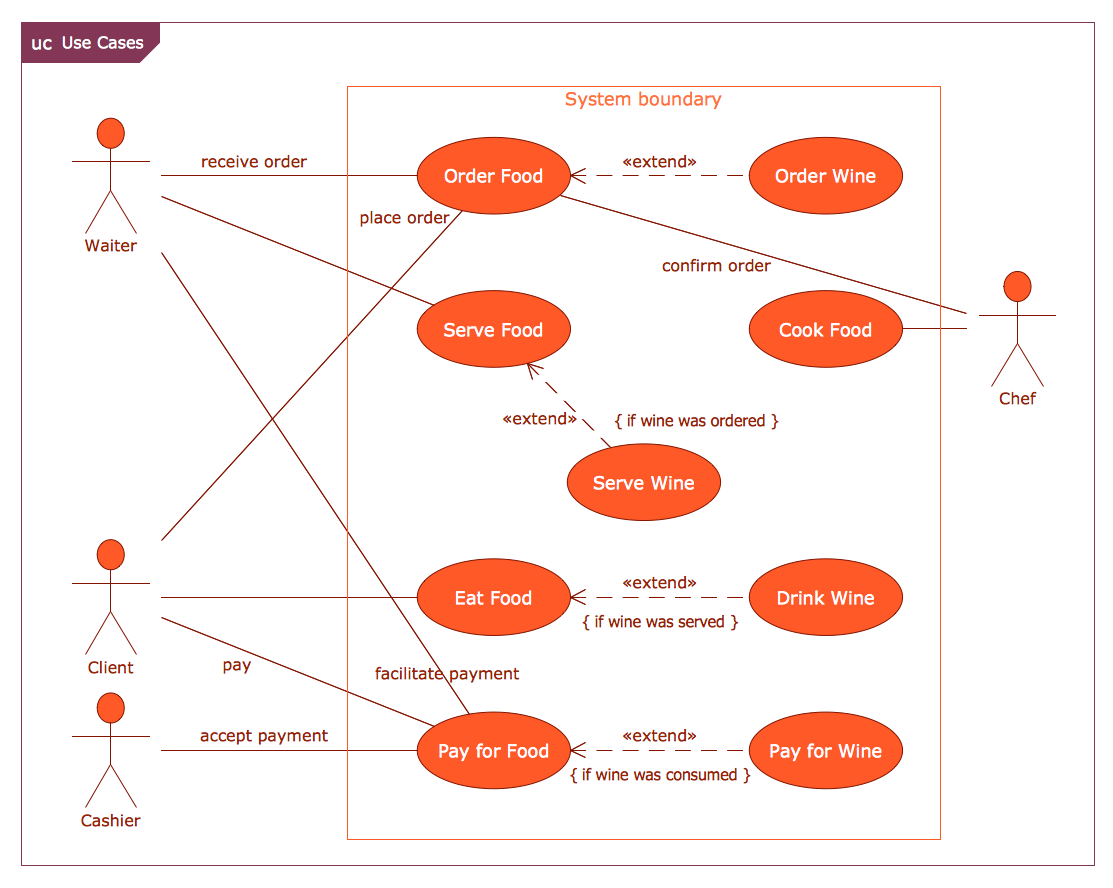
Example 3. SysML Use Case Restaurant Model
The SysML diagrams you see on this page were created in ConceptDraw DIAGRAM software using the predesigned vector icons from the libraries of SysML Solution. An experienced user spent 15 minutes creating each of these samples.
Use the powerful tools of SysML Solution for ConceptDraw DIAGRAM Solution Park for effective model based systems engineering and easy creating SysML diagrams.
All source documents are vector graphic documents. They are available for reviewing, modifying, or converting to a variety of formats (PDF file, MS PowerPoint, MS Visio, and many other graphic formats) from the ConceptDraw STORE. The SysML Solution is available for all ConceptDraw DIAGRAM users.