.png)
Sample 1. Design Elements — Rack Diagram (macintosh, windows)
for Network Diagrams.
Rack Elements library of vector stencils from ConceptDraw Computer and Networks solution provides the 33 graphic objects of design elements for drawing the rack diagrams that visualize the rack mounting of computer and network equipment as the drawing of frontal view of the rack with equipment installed.
Use Rack Elements library to design your own rack diagrams for choosing the equipment and racks to buy, and for virtual organizing the equipment on the racks without the real installation.
TEN RELATED HOW TO's:
UML Deployment Diagram depicts the physical deployment of artifacts on nodes (nodes are the existing hardware components, artifacts are the software components running on each node); and how the different pieces are connected.
Use ConceptDraw DIAGRAM with UML deployment diagram templates, samples and stencil library from Rapid UML solution to model the physical deployment of artifacts on nodes of your software system.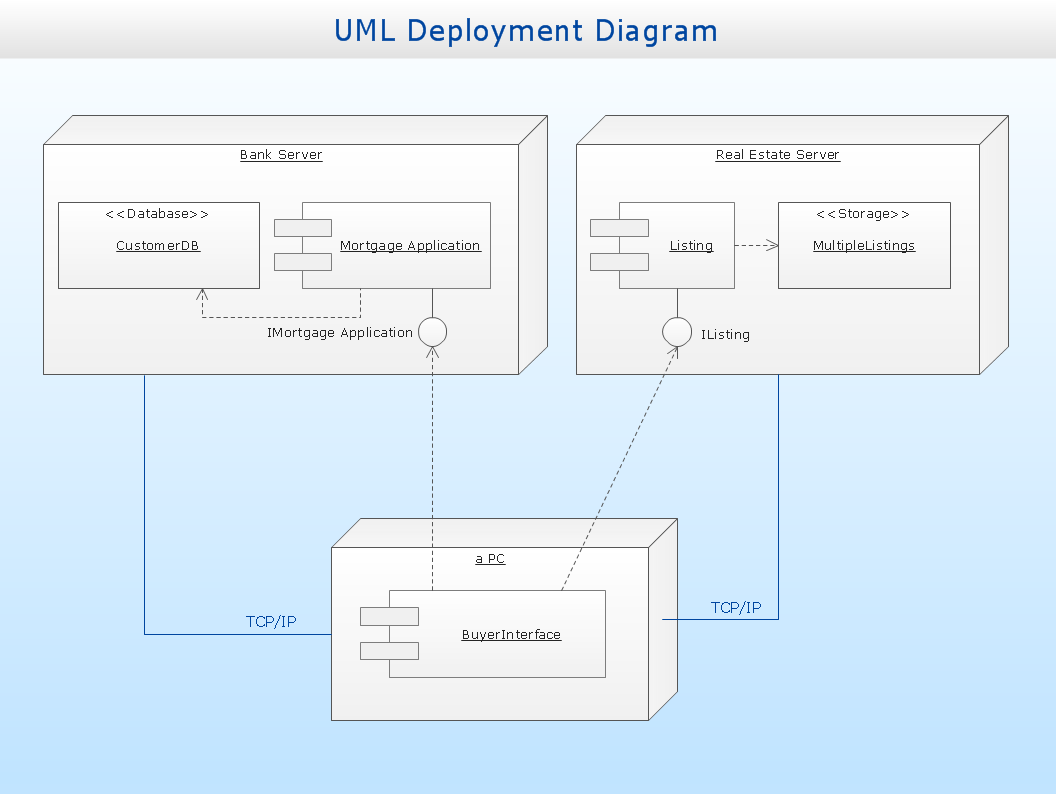
Picture: UML Deployment Diagram
Related Solution:
ConceptDraw DIAGRAM is a powerful software that helps you create professional and easy drawing diagrams for business, technology, science and education.
Picture: Create Sophisticated Professional Diagrams - Simply
Network Security Architecture Diagram visually reflects the network's structure and construction, and all actions undertaken for ensuring the network security which can be executed with help of software resources and hardware devices. You dream to find powerful software for easy designing Network Security Architecture Diagram? We recommend to use ConceptDraw DIAGRAM extended with Network Security Diagrams Solution from the Computer and Networks Area of ConceptDraw Solution Park.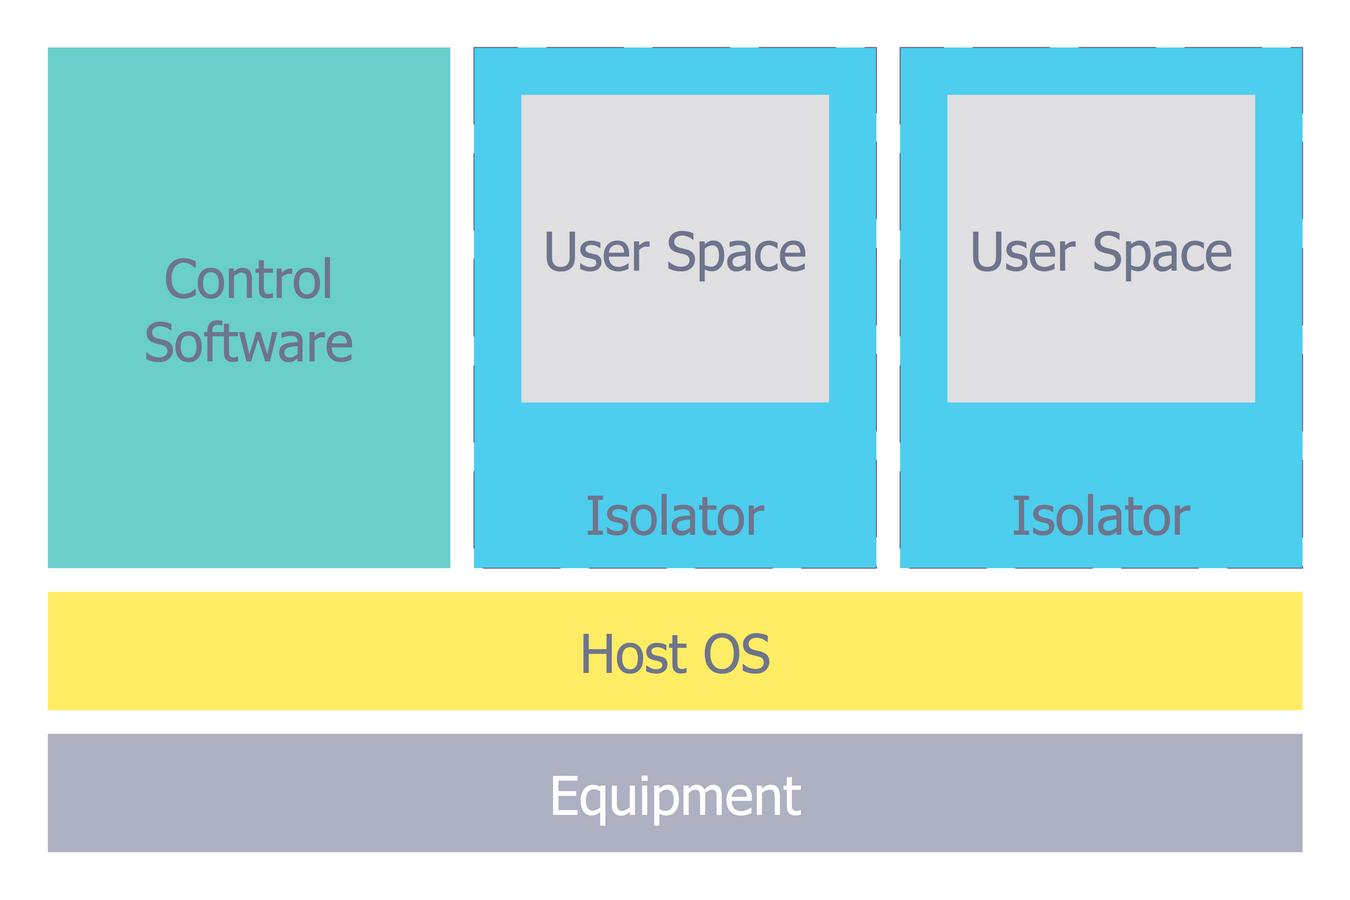
Picture: Network Security Architecture Diagram
Related Solution:
ConceptDraw DIAGRAM diagramming and vector drawing software extended with Computer Network Diagrams Solution from the Computer and Networks Area offers a set of useful tools, collection of templates, samples, and libraries of various computer symbols, computer devices icons, computer network icon for fast and easy drawing network computer diagrams and illustrations.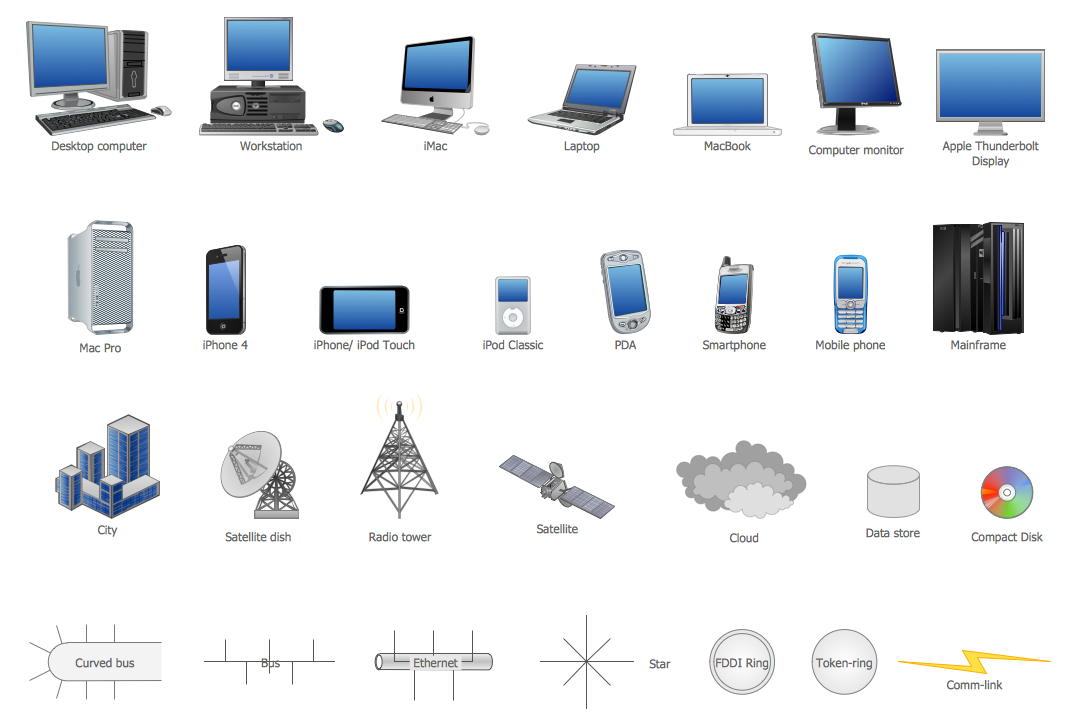
Picture: Network Icon
Related Solution:
Design efficiently the technical flow charts in ConceptDraw DIAGRAM software for various fields and provide ✔️ clarity, ✔️ accuracy, ✔️ usability, ✔️ simple communication, analysis, and improvement
Picture: Technical Flow Chart Example
Related Solution:
A network diagram represents the set of computers and network devices and the connections among them. This scheme can be developed for any institution or establishment. To illustrate this concept let’s take for example, a hotel network topology diagram or a school network diagram. These diagrams depict access points, servers, workstations, firewalls and another equipment needed to provide a network.
On this masterpiece drawing one will see a simple scheme a of connecting computers together. Such form of connecting can be applied for a hotel, guest house, bungalow, hut or something else. This diagram shows the images of the real LAN components. So, it represents a physical category of a network construction. It looks similar to a star - so this network configuration is named a star topology. The typical feature of this construction is a center point - usually it is hub, or router. The rays of this star means network connections. Computers, peripherals and other network details are placed on the ends of the star rays.
Picture: Hotel Network Topology Diagram
Related Solution:
ConceptDraw DIAGRAM diagramming and vector drawing software extended with Gym and Spa Area Plans solution from Building Plans area of ConceptDraw Solution Park is the best for simple and fast drawing the Fitness Plans.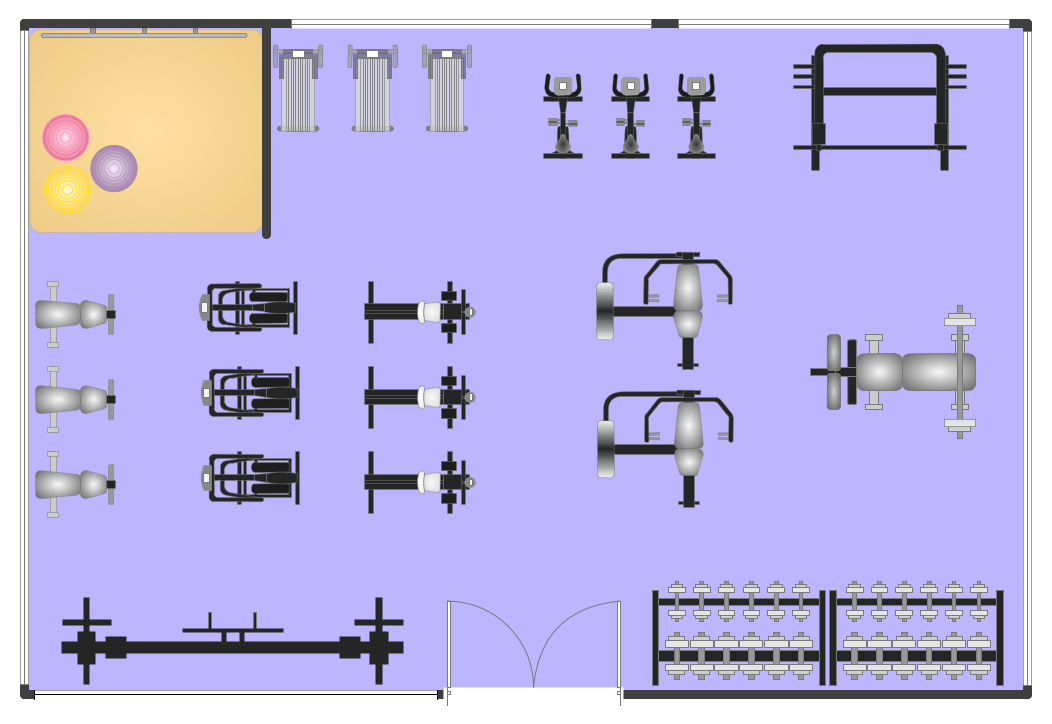
Picture: Fitness Plans
Related Solution:
ConceptDraw DIAGRAM charting and vector drawing software extended with Fire and Emergency Plans solution offer a large collection of examples and samples. The thematic vector design objects and symbols are also included. Use them to draw the Emergency Exit Plan House for the house of any area (private house or multi-floor residential house). Visually represent the floor plan with shown emergency escapes, location of fire extinguishers, safe and refuge areas.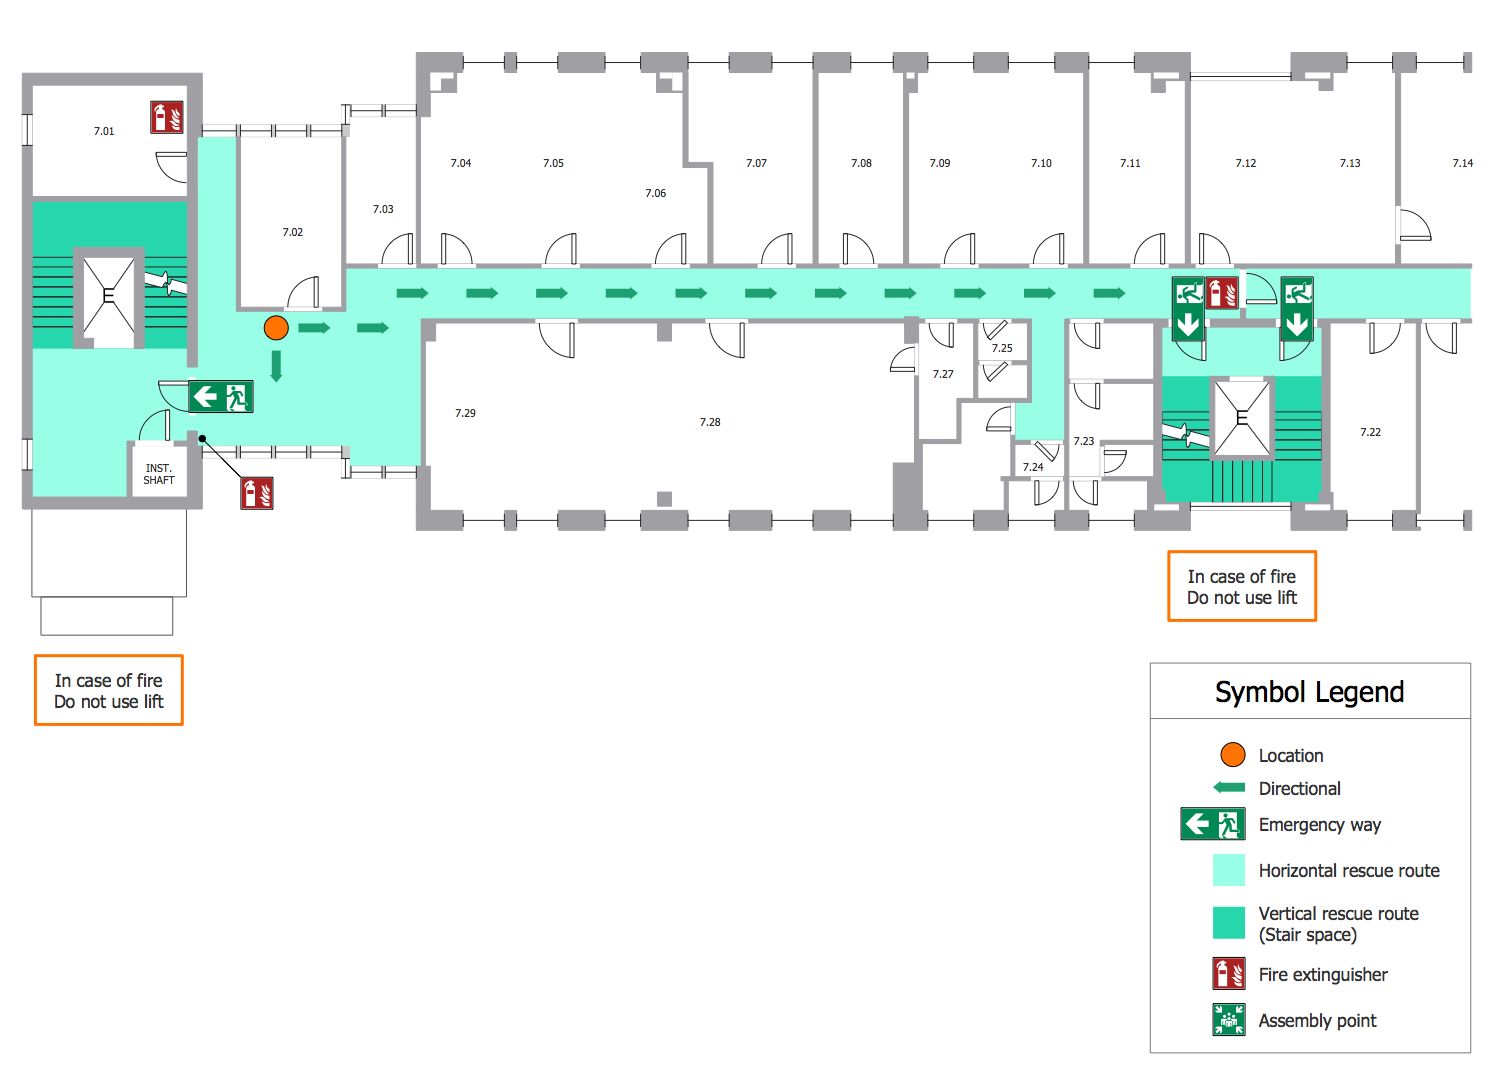
Picture: Emergency Exit Plan House
Related Solution:
The Ring Network Topology Diagram examples was created using ConceptDraw DIAGRAM software with Computer and Networks solution.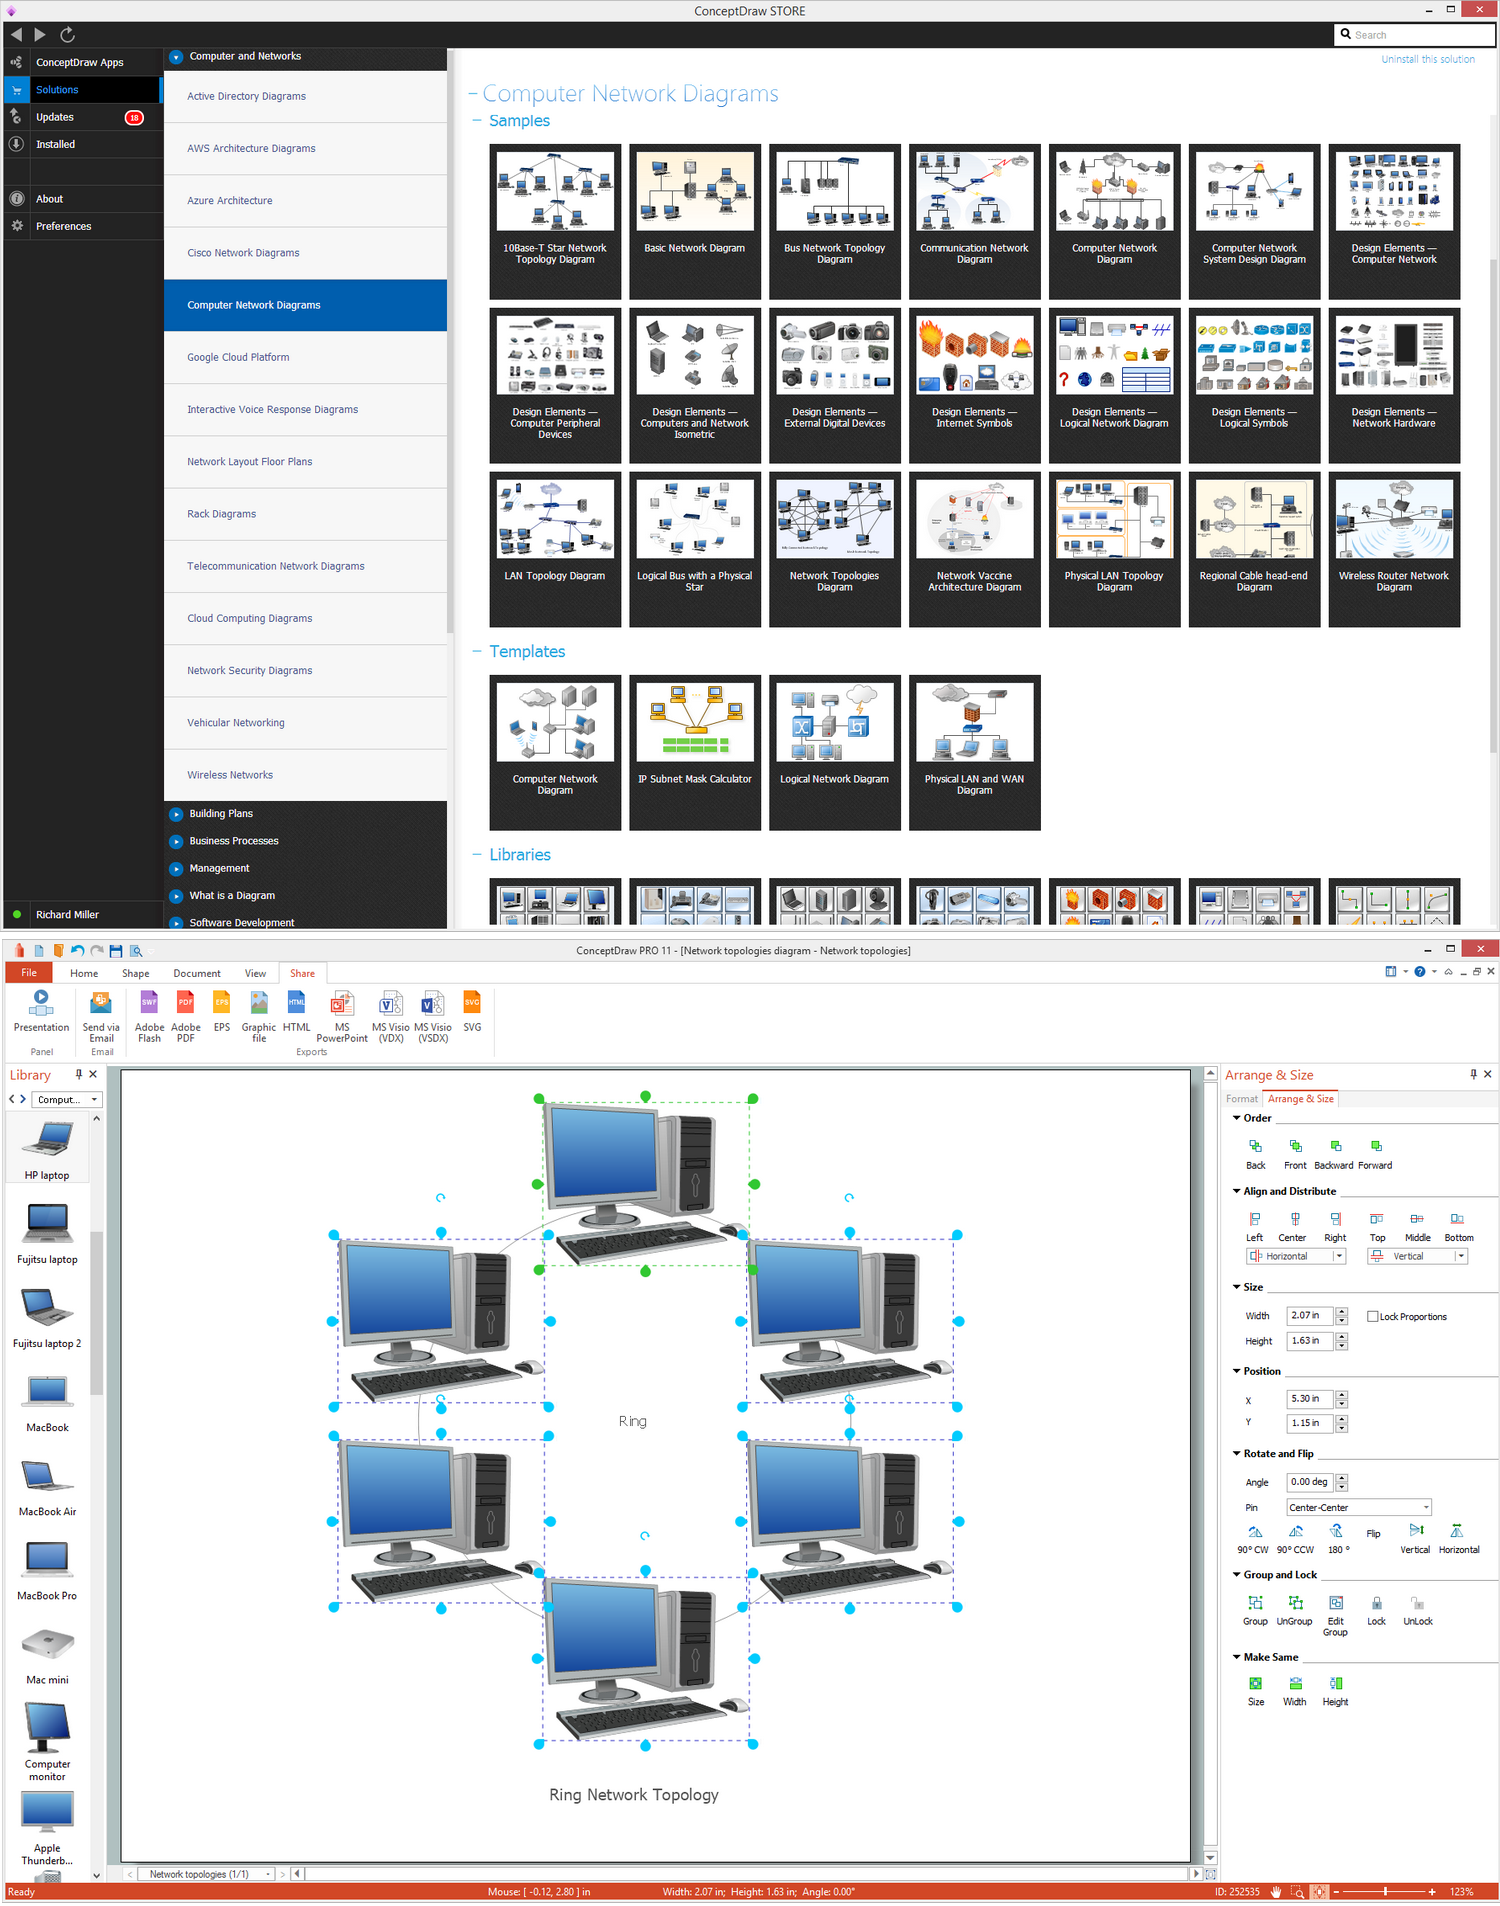
Picture: Ring Network Topology
Related Solution:
ConceptDraw DIAGRAM is the best network diagram software. To design the Cisco Network Diagrams and visualize the computer networks topology use ConceptDraw DIAGRAM diagramming and vector drawing software extended with Cisco Network Diagrams solution for ConceptDraw DIAGRAM Solution Park.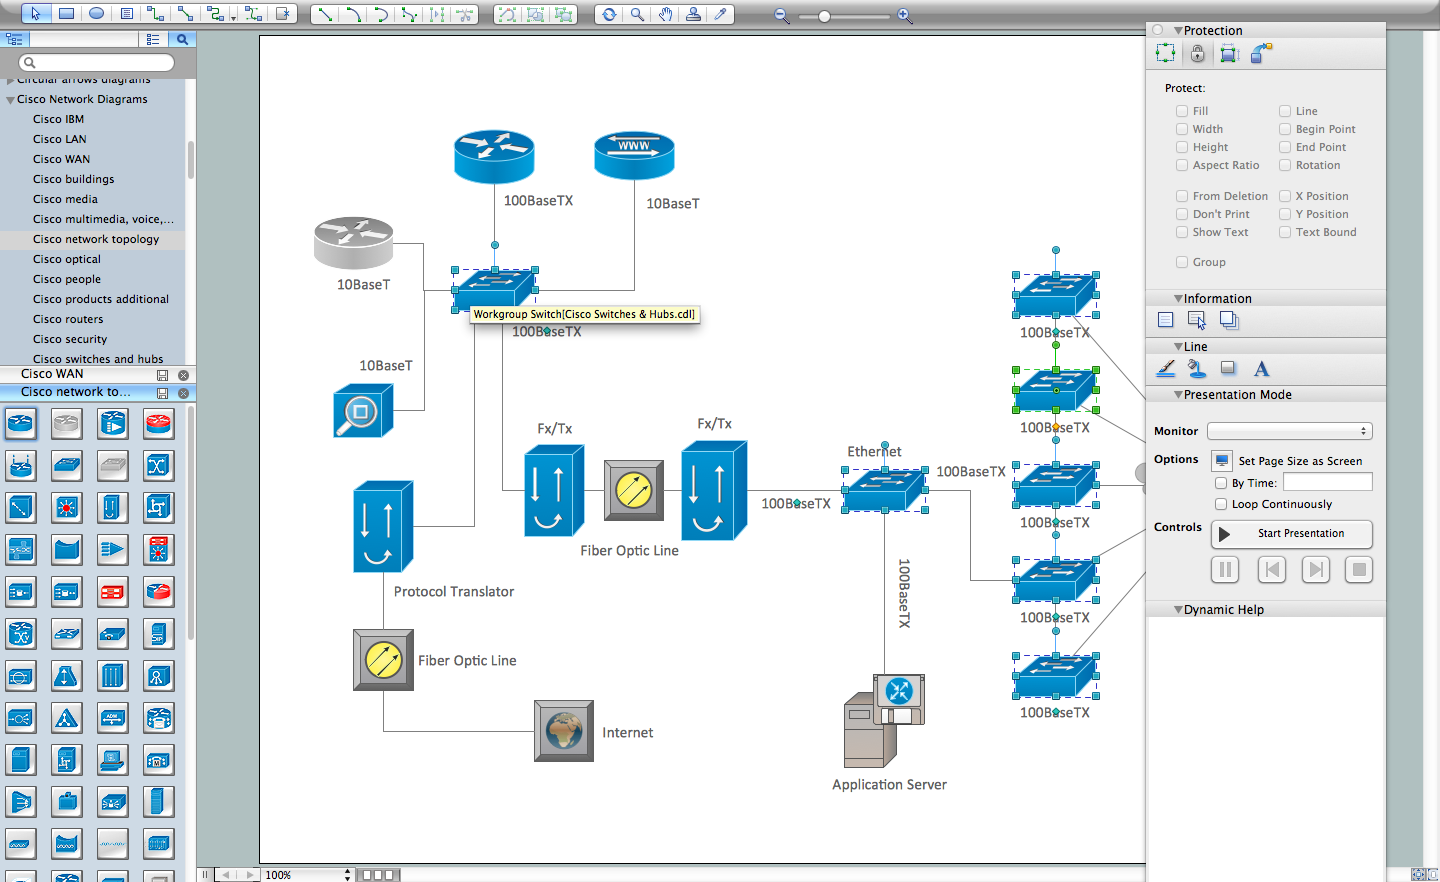
Picture: Cisco Network Diagram Software
Related Solution: