Drawing Illustration
|
ConceptDraw DIAGRAM is a complex of the vector stencils, examples, and templates for creating different types of diagrams. Nature solution allows users to design any kinds of the illustration diagrams. Users can export final document to PDF, PowerPoint, and other popular graphic formats. |

Pic.1 Water cycle diagram.
Nature solution extends ConceptDraw DIAGRAM software with samples, templates and libraries of vector clipart for drawing of Nature illustrations.
Use Nature solution to draw your own water cycle diagrams.
See also Samples:
TEN RELATED HOW TO's:
ConceptDraw DIAGRAM is a world-class diagramming platform that lets you display, communicate, and present dynamically. It′s powerful enough to draw everything from basic flowcharts to complex engineering schematics.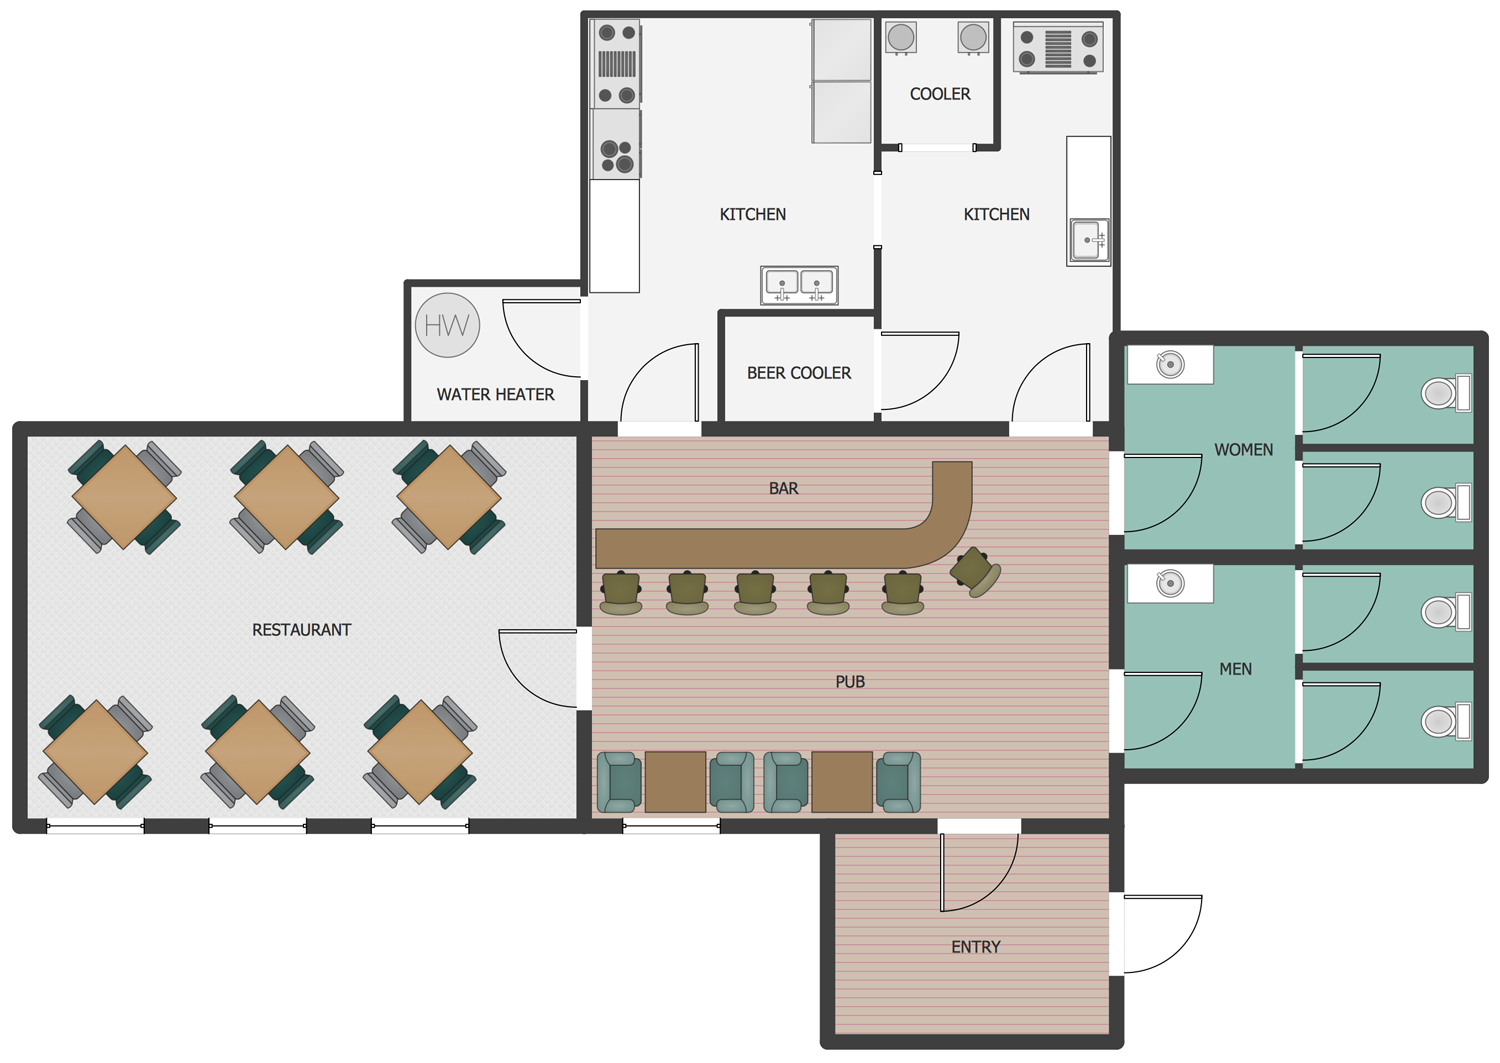
Picture: How to Draw a Building Plans
Related Solution:
In the course of recent decades data visualization went through significant development and has become an indispensable tool of journalism, business intelligence and science. The way visual information may be conveyed is not limited simply to static or dynamic representation, it can also be interactive. Infographics can be conditionally divided into several general levels. Primarily, this is level of visualization of information, its interpretation and association on any ground. Second level can be defined as a visualization of knowledge, depiction of thoughts and ideas in the form of images or diagrams. Finally, the level of data visualization, which processes data arrays in charts, enabling the information to be more clearly perceived. You can also identify the main approaches to the creation of infographics: exploratory and narrative. Exploratory method insists on minimalist design in favor of data precision without unnecessary details and is common for scientific researches and ana
Picture: Design Pictorial Infographics. Design Infographics
Related Solution:
The vector stencils library Industrial transport contains clipart of industrial vehicles for ConceptDraw DIAGRAM diagramming and vector drawing software.
Use it to draw illustrations of industrial vehicles, transportation, lifting and moving materials using machines.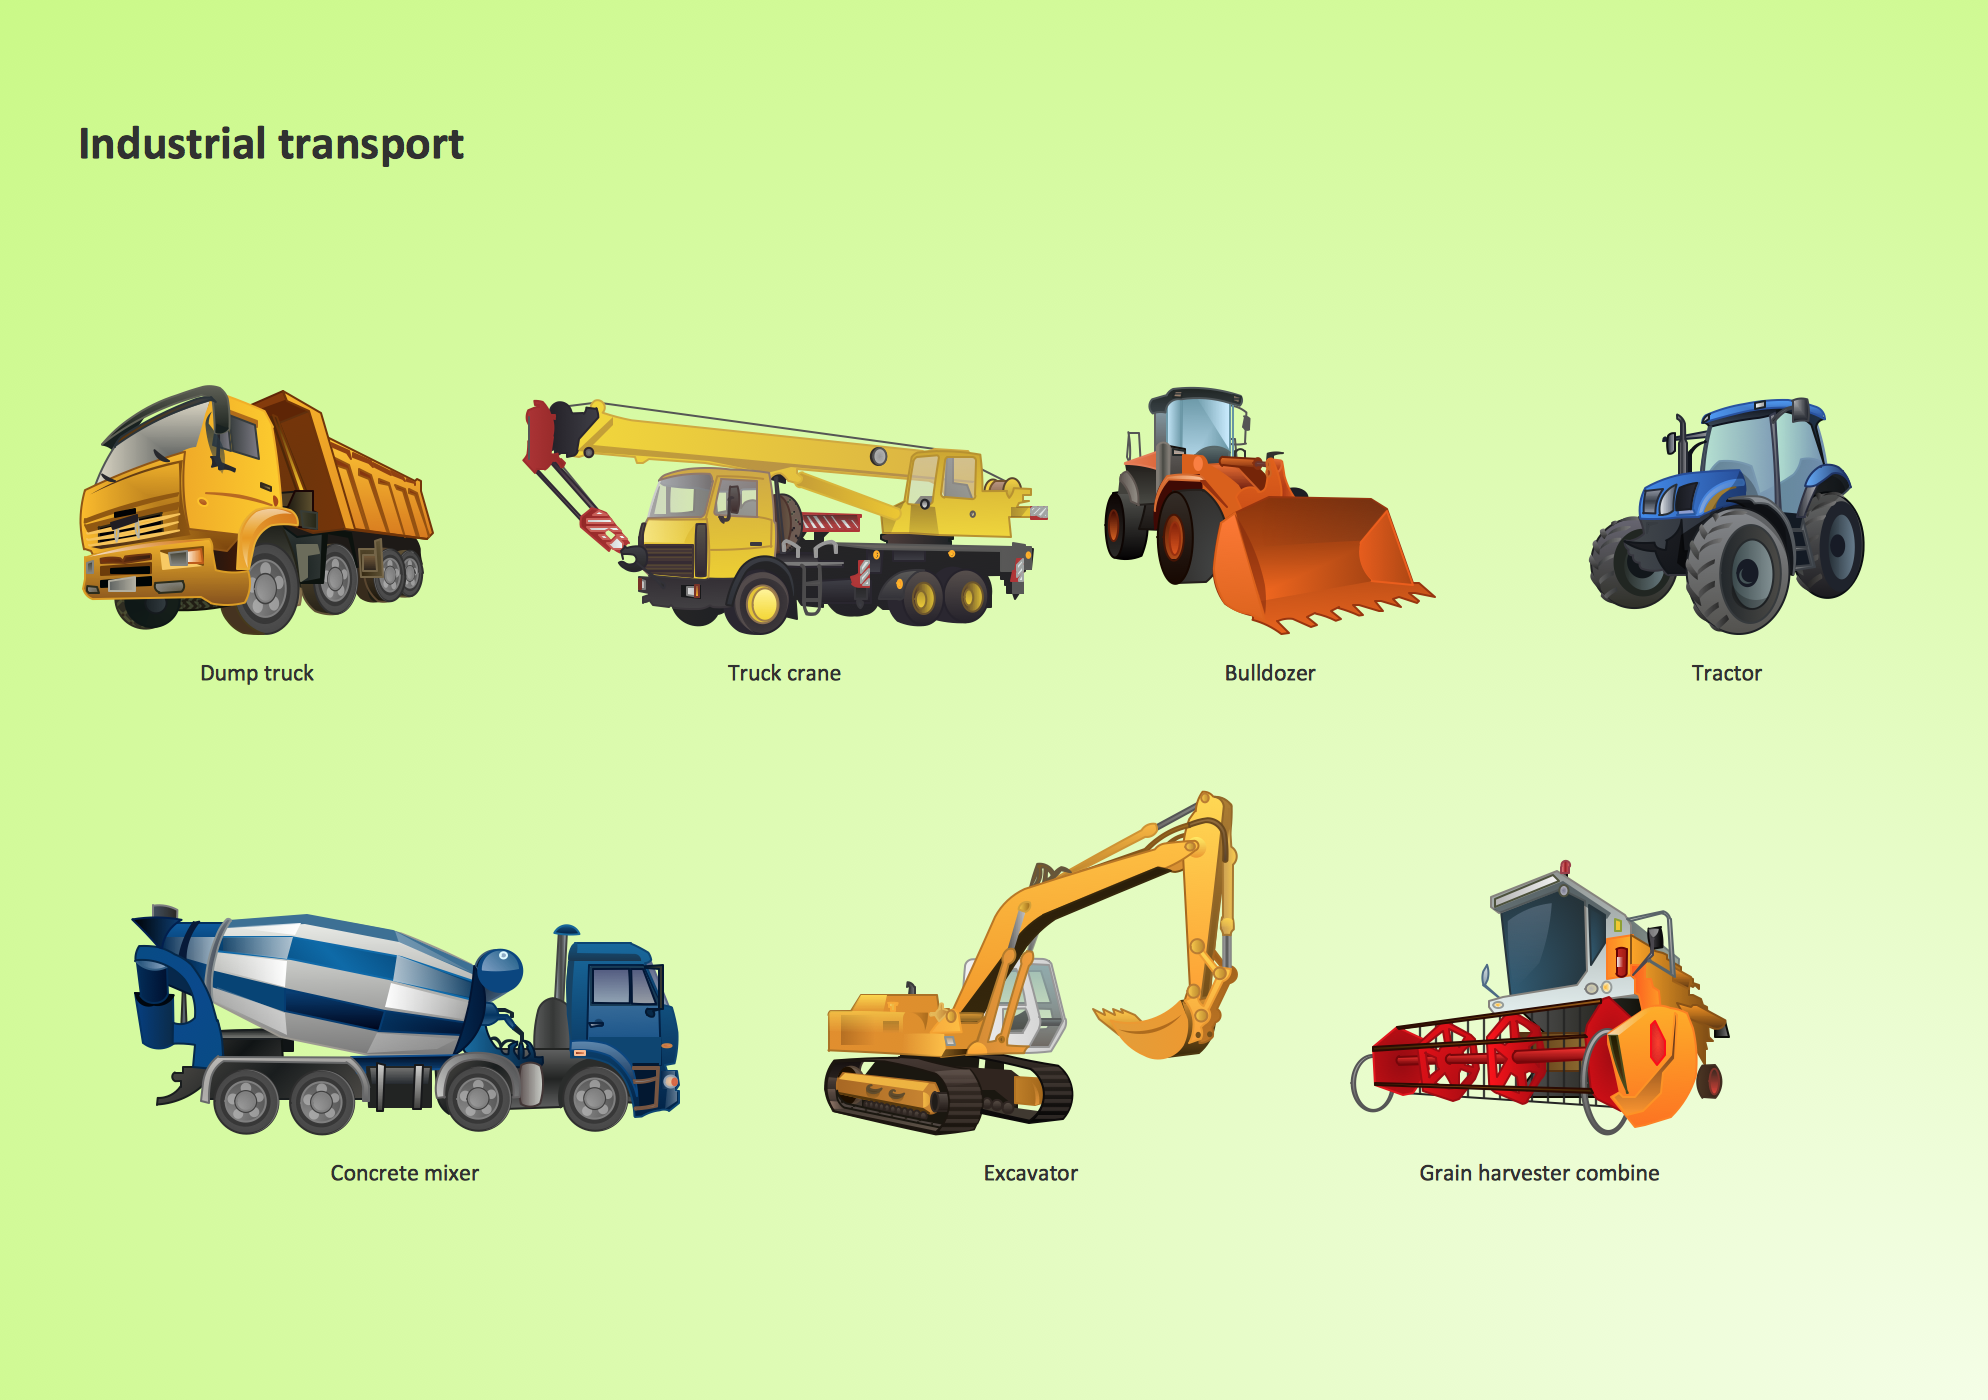
Picture: Industrial transport - Design elements
Related Solution:
ConceptDraw DIAGRAM is effective software for a variety of activity fields. Now, extended with Sales Flowcharts solution from the Marketing area of ConceptDraw Solution Park it become also useful in the field of sales. It helps to design professional looking Sales Flowcharts, Sales Process Flowcharts, Sales Process Maps, Plans and Diagrams to effectively realize the process of selling a product or service, and to display the sales results.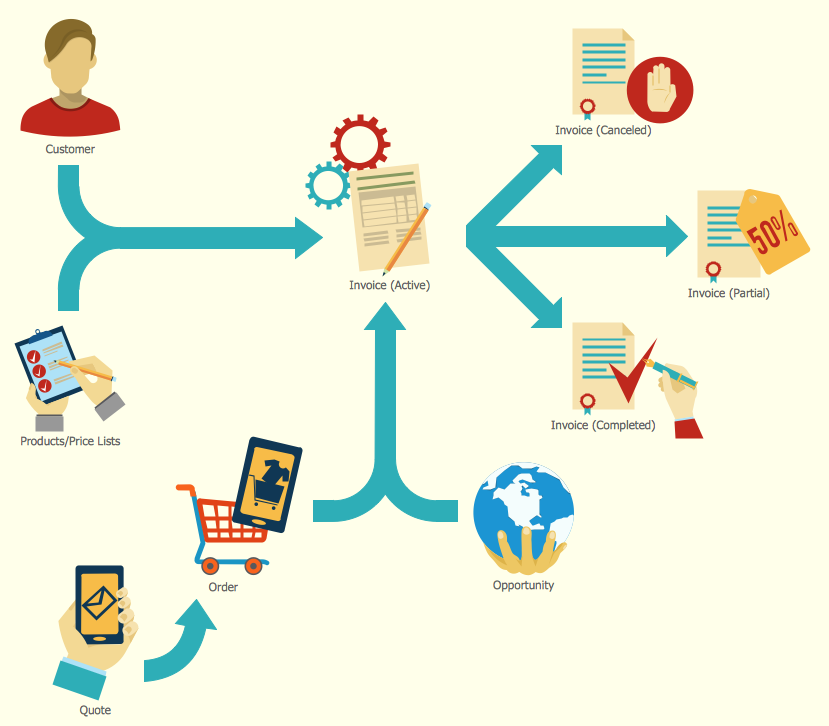
Picture: Sales Process
Related Solution:
It’s very important for any establishment to have a fire exit plan and to train it several times a year. The plan must be put on each floor of the building in a way that it could be easily seen. To make the plan clear and descriptive, you should look through examples and then create one for you your building.
Find out the fire exit plan example created with ConceptDraw DIAGRAM and its Fire and Emergency Plans solution. This plan is a floor plan that shows the ways in which people inside the building can be evacuated in the event of a fire. The location of telephones, fire extinguishers and first aid kits are indicated on the fire exit plan. The Legend in the lower right corner of the plan makes it clear and easy-to-read. Such plan should be placed on the wall on each floor of the building.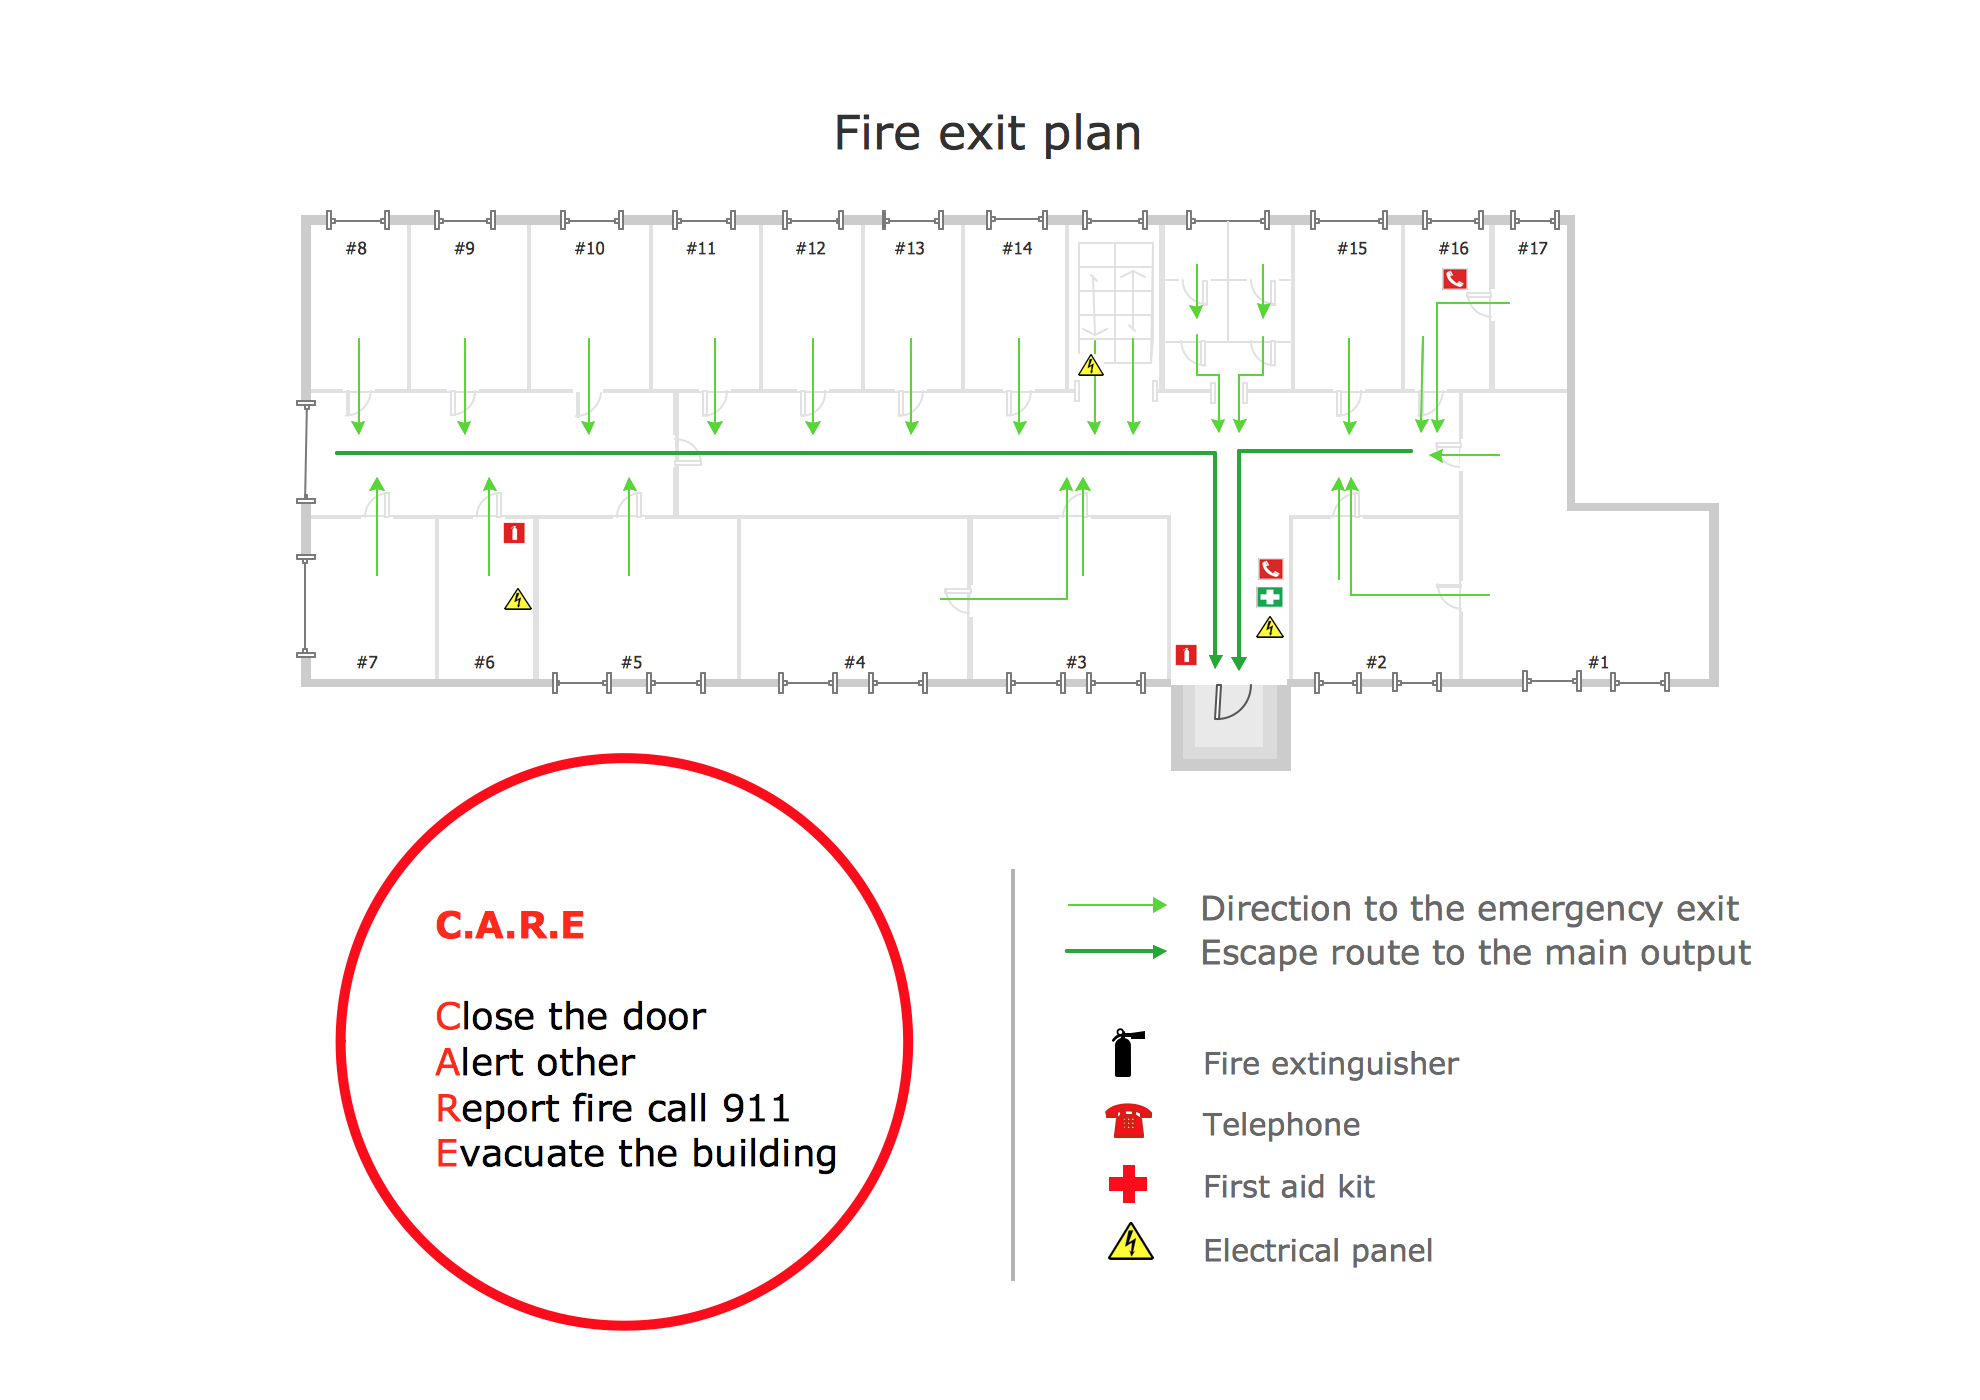
Picture: Fire Exit Plan. Building Plan Examples
Related Solution:
Arkansas is a state located in the Southern region of the United States.
The vector stencils library Arkansas contains contours for ConceptDraw DIAGRAM diagramming and vector drawing software. This library is contained in the Continent Maps solution from Maps area of ConceptDraw Solution Park.
Picture: Geo Map - USA - Arkansas
Related Solution:
Teams working with Scrum methodology use the product backlog items (PBIs), bug work item types (WITs), reports and dashboards. SCRUM Workflow solution for ConceptDraw DIAGRAM software offers collection of samples, variety of predesigned objects, clipart and graphic elements, a set of Scrum process work items and workflow which are developed for agile teams working using Scrum.
Picture: Scrum process work items and workflow
Related Solution:
The growth–share matrix (BCG Matrix) was created by Bruce D. Henderson for the Boston Consulting Group in 1970 to help corporations to analyze their business units and to help the company allocate resources. How is it easy design the BCG Matrices in ConceptDraw DIAGRAM diagramming and vector drawing software supplied with unique Matrices Solution from the Marketing Area of ConceptDraw Solution Park.
Picture: BCG Matrix
Related Solution:
Stakeholder management is a critical component to the successful delivery of any project, programme or activity.
ConceptDraw DIAGRAM is a powerful diagramming and vector drawing software. Now, thanks to the Stakeholder Onion Diagrams Solution included to the Management Area of ConceptDraw Solution Park, ConceptDraw DIAGRAM became also unique stakeholder management system design software.
Picture: Stakeholder Management System using Onion Diagram
Related Solution:
The popularity of Block Diagrams grows day by day. The existence of powerful software for their design is an excellent news! ConceptDraw DIAGRAM Block Diagram Software offers the Block Diagrams Solution from the Diagrams Area.
Picture: Block Diagram Software
Related Solution:
ConceptDraw
DIAGRAM 18