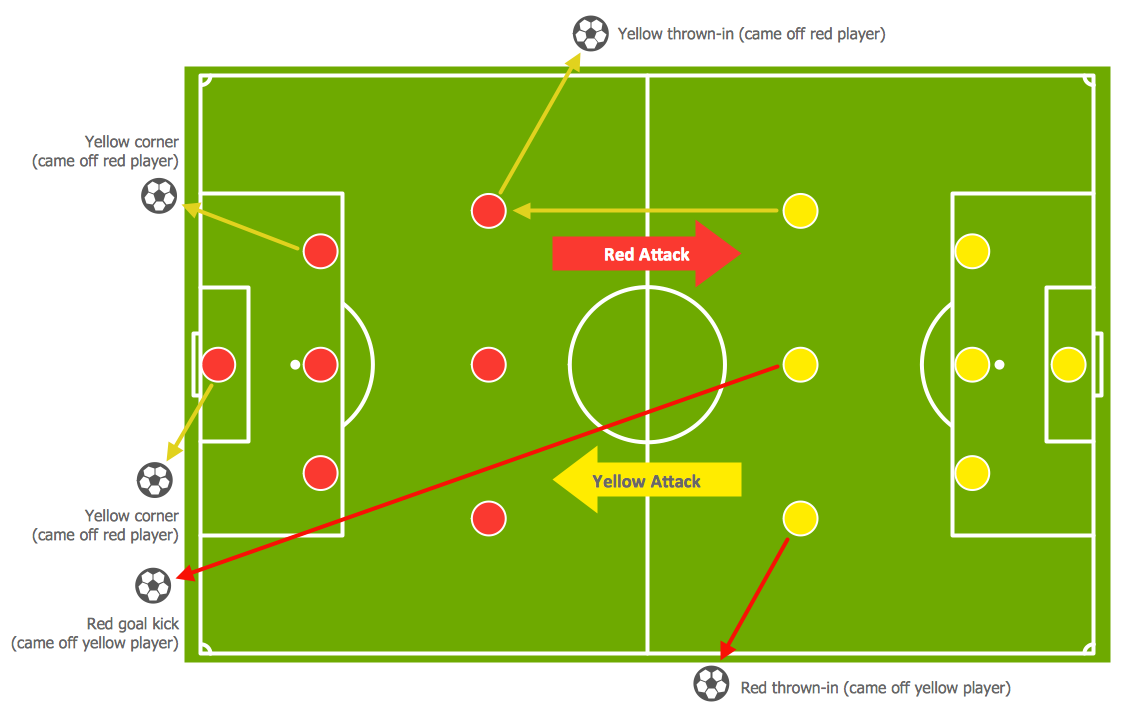
Sample 1. The Pitch Throw-ins, Goal-Kicks, Corners
To quick and easy draw the diagrams with soccer (football) tactics, use the "Soccer (Football) Fields" and "Soccer (Football) Positions" libraries from the Soccer solution from the Sport area of ConceptDraw Solution Park and follow the next steps:
- From the "Soccer (Football) Fields" library drop a field object to your document;
- From the "Soccer (Football) Positions" library drop all positions object you need to your document;
- Place positions on the field according to your drawing idea;
- Add arrows or text labels if needed.
 Offside")
Sample 2. Soccer (Football) Offside
The samples you see on this page were created in ConceptDraw DIAGRAM using the vector objects from the Soccer Solution libraries. They show the soccer (football) tactics. These samples demonstrate the solution's capabilities and the professional results you can achieve. An experienced user spent 10 minutes creating every of these samples.
All source documents are vector graphic documents. They are available for reviewing, modifying, or converting to a variety of formats (PDF file, MS PowerPoint, MS Visio, and many other graphic formats) from the ConceptDraw STORE. The Soccer Solution is available for all ConceptDraw DIAGRAM or later users.
TEN RELATED HOW TO's:
The Soccer solution for ConceptDraw DIAGRAM includes also a wide collection of templates and samples to help the soccer specialists and fans to draw any soccer-related diagrams and schemas as quickly as possible.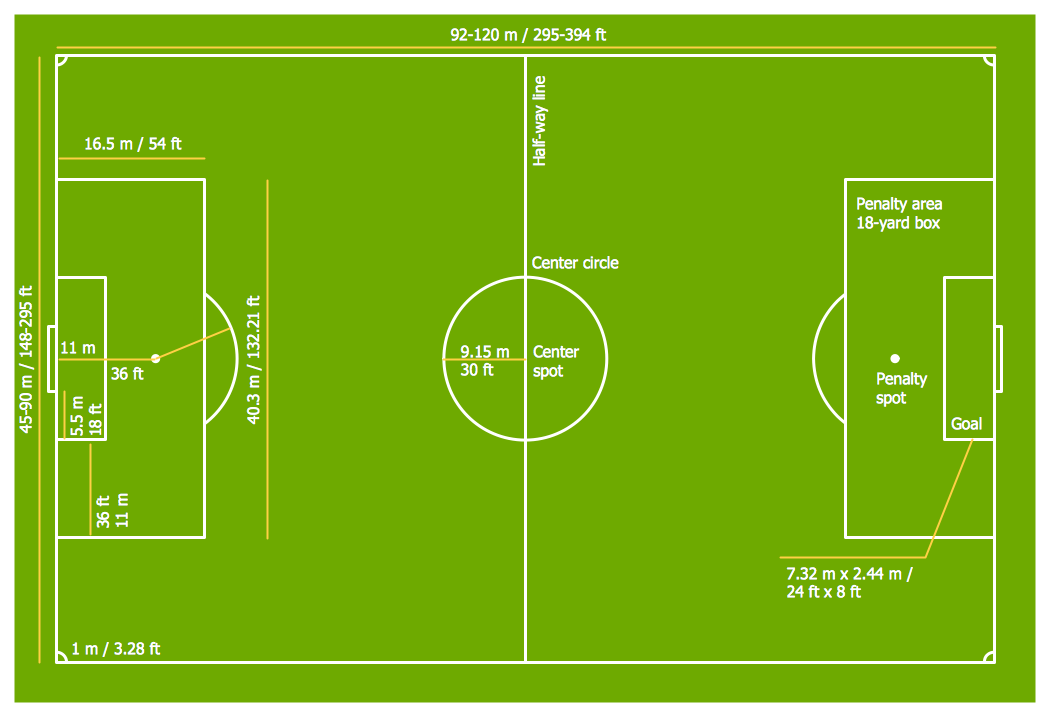
Picture: Soccer (Football) Field Templates
Related Solution:
It’s very important that your soccer drawing looked beautiful, interesting and attracted the attention. For this it is necessary add the illustrations! The Soccer solution delivers several libraries with predesigned bright and interesting clipart objects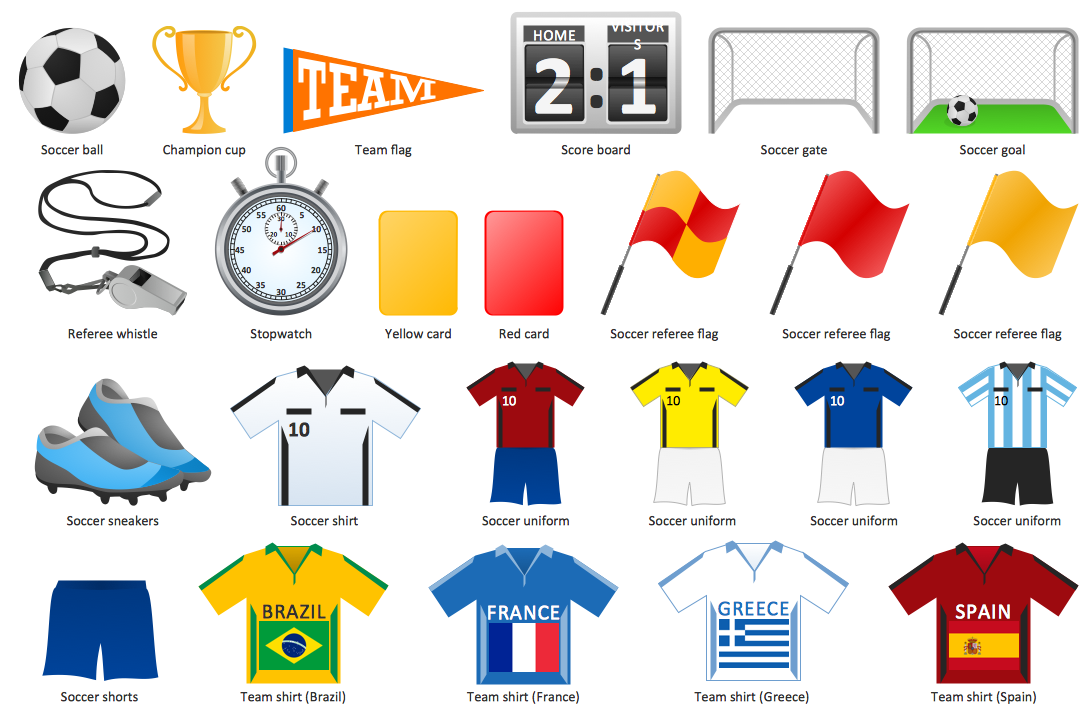
Picture: Soccer (Football) Illustrated
Related Solution:
Using diagrams is the easiest way to explain the soccer formations. The Soccer solution from the Sport area of ConceptDraw Solution Park is designed as a tool that helps you produce the soccer diagrams in a few minutes. The predesigned samples of the Soccer solution for ConceptDraw DIAGRAM depict the most popular formation diagrams.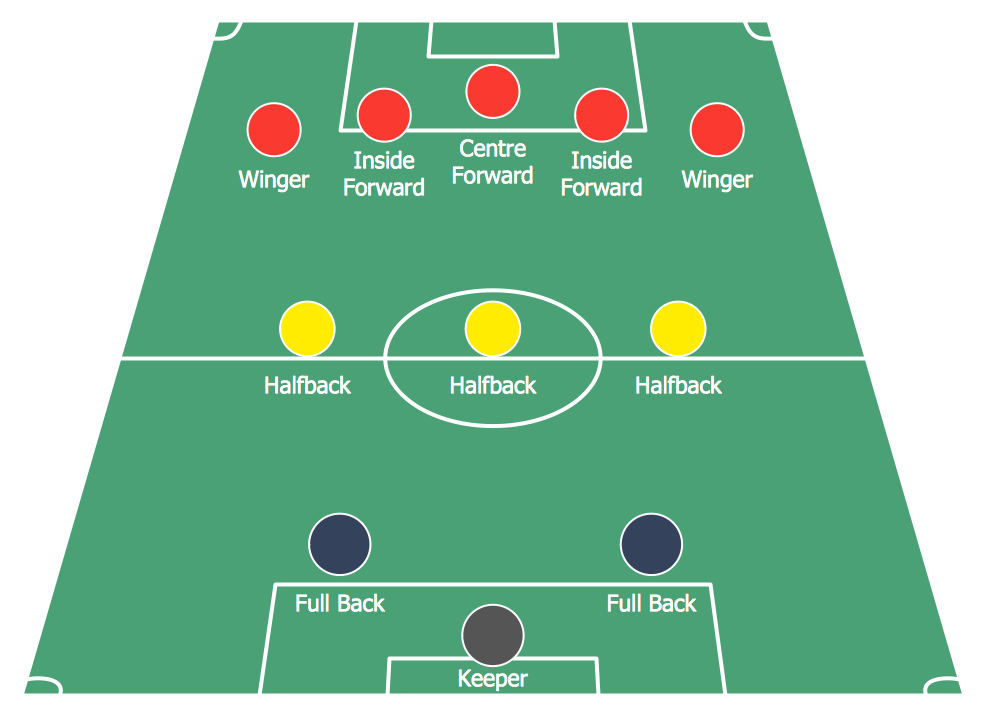
Picture: Soccer (Football) Formation
Related Solution:
Explaining offensive strategies of American Football is practically impossible without drawing a diagram. If you need to do this more than once you have to choose an appropriate tool allows you to change diagrams easily. ConceptDraw DIAGRAM extended with the Football Solution is the best choice for this case.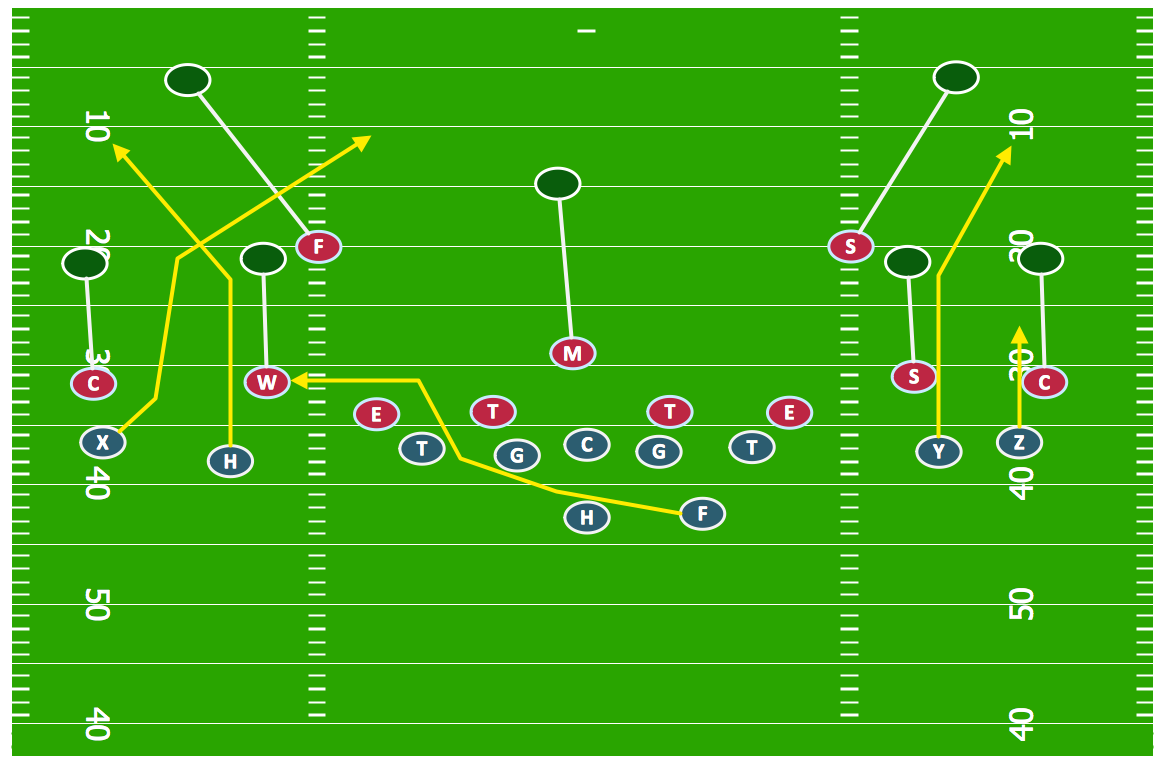
Picture: Offensive Strategy — Spread Offense Diagram
Related Solution:
The art of arranging furniture and other decorations in space is called interior design. Some sites, like sport fields have tight restrictions in dimensions, but there's still a lot of work for a designer. You can help yourself to design such a plan with ConceptDraw DIAGRAM solution Sport Field Plans that contains elements of sport equipment and recreation plans.
This drawing represents the set of vector graphic objects that compose the Sport fields and Recreation library, supplied by ConveptDraw Sport Fields Plans solution. It can be used for drawing interior designs and layouts of sport fields and recreation zones. By using ConceptDraw with Sport Field Plans solution you can create professional plans for different sport fields: basketball, volleyball, football, tennis, golf, etc. Moreover, the use of this solutions enables making a site plans including green zone, pools, parkings - in short, what makes the recreation area, that usually accompanies sports facilities.
Picture: Interior Design. Sport Fields — Design Elements
Related Solution:
To be an expert in American Football this is not enough to know rules, you should also know at least basic offenses and defenses. Getting closer with this kind of knowledge you may find visual football diagrams an extremely helpful. The Football solution for ConceptDraw DIAGRAM gives you a perfect tool for drawing football diagrams.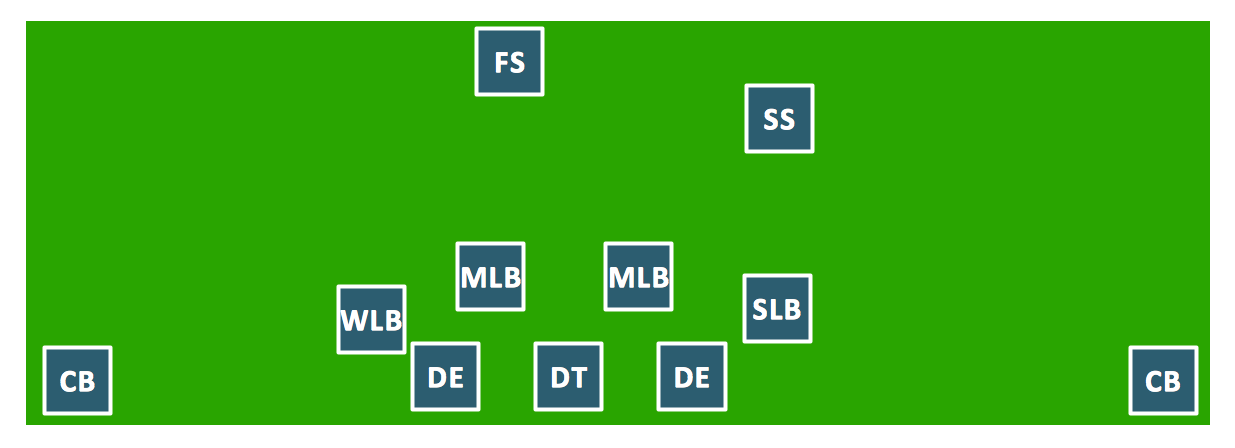
Picture: 3-4 Defense Diagram
Related Solution:
Using diagrams is the easiest way to explain American Football defensive formations. The Football solution for ConceptDraw DIAGRAM contains a set of samples depicts the most popular defensive formations diagrams. Using embedded presentation tools you are able to share your football knowledge with wide audience.
Picture: Defensive Formation – 4-3 Defense Diagram
Related Solution:
Meeting ice hockey rules one should learn ice hockey rink terms, lines, zones etc. ConceptDraw DIAGRAM is an advanced drawing software that allows you produce ice hockey rink depiction of any complexity, from simple sketch drawing to detailed one as on example below.
Picture: Ice Hockey Rink Dimensions
Related Solution:
Extending ConceptDraw DIAGRAM software with the Football solution from the ConceptDraw Solution Park you receive a complete set of libraries, templates and samples allowing to draw defensive plays diagrams in seconds. You can start from a template, change positions and get ready diagram in some clicks.
Picture: Defensive Play Diagram – Under Front
Related Solution:
Extending ConceptDraw DIAGRAM software with the Baseball solution you receive a complete set of libraries, templates and samples allowing to draw baseball diagrams in seconds. You can start from a template, change positions and get ready diagram in some clicks.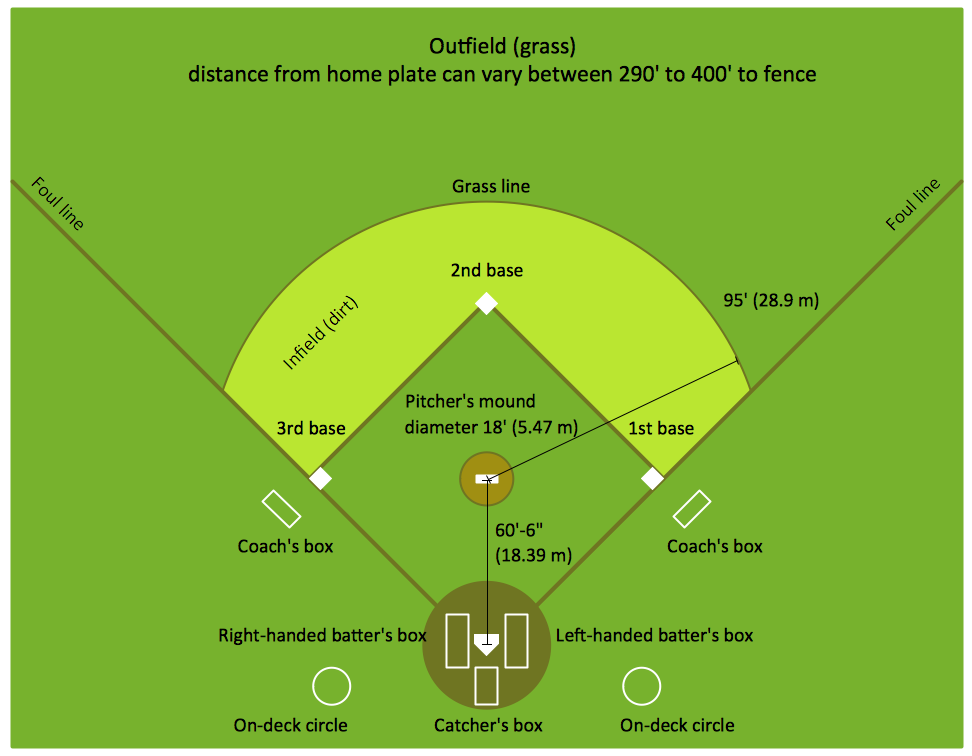
Picture: Baseball Diagram – Colored Baseball Field
Related Solution:
 Offside")