Ice Hockey Offside Diagram
Creating an ice-hockey offside diagram is always much simpler in ConceptDraw DIAGRAM diagramming and drawing software extended with the Hockey solution which can be downloaded from the ConceptDraw STORE application any time it is needed.
In ice hockey a well-known play of offside is when a player on the attacking team enters the offensive zone before the puck, but only in case the mentioned puck is not carried or sent there by a defending player. Every time some offside violation occurs, a linesman should stop playing. A so called “faceoff” is then held at a neutral ice spot, which is closest to the infraction in order to restart the play. In such event the puck carrier's feet are known to be crossing the blue line at the same time while the puck is remaining outside the blue line. In this case the attacking team's players can be considered onside and can enter the zone.
Both the International Ice Hockey Federation (IIHF) as well as the National Hockey League (NHL) apply very similar rules for determining the “offside”. A player can be judged to be “offside” in case both of his skates cross the blue line dividing his offensive zone from the neutral one before the puck makes any contact with the same line. In both mentioned organizations, “offside” is the position of a player's skates, which are very important. In this case, the players can’t use their sticks or some parts of their bodies to remain onside.
If only one player is in such offside position, then all of his team is treated to be “offside”. A so called “delayed offside” may occur in case the puck is shot into or passed the offensive zone at the same time while an attacking player is offside, but when he hasn’t been touched by any of the members of the attacking team. In most of the leagues, the attacking team may as it is called "tag up" in a way of having all the ice-hockey players to exit the offensive zone.
At the mentioned point when it happens the offside is waved off and so they may re-enter the offensive zone. In case some of the members of the attacking team has control of the puck while the offside takes place, then a linesman can stop play and so the so called “faceoff” is held at the “faceoff spot”, which is nearest to the point of the infraction. Usually, it may mean the spot, which is the closest to the blue line if the puck is carried into the zone. In case of a pass, the spot, which is closest to where the pass originated, is being considered.
In case a linesman judges that the attacking team forced a deliberate stoppage in play in a way of going offside, then they can move the faceoff into that team's zone -the defensive one. Under both NHL and IIHF rules, there is only one condition under which an offside can be waved off even when the players in the attacking zone are ahead of the puck. These situations may occur in case a defending player has carried the puck out of his zone, passing the puck back into his zone only to make it possible for the puck to be intercepted by any of the attacking players. And also it can happen if a defending player clears the puck out of his own zone, but it bounces off to another defending player in neutral ice back into his zone.
During a so called “faceoff”, any ice-hockey player is expected to be judged to be in an offside position in case they are lined up within 15 feet of the centre just before the puck is known to be dropped. Such situation may result in a so called “faceoff violation”, known to be a point when the puck waves the centre out of the faceoff spot, requiring another player to take their place. In case one of the teams commits two violations during the same attempt for restarting the play, then it can be assessed as a minor penalty for a delay of the ice-hockey game.
A so called “offside pass” may occur straight after a pass from inside a team's defending zone crosses the well known red line on the ice hockey field. After such pass occurs, the play has to be stopped and a faceoff has to be conducted in the defending zone of the team which is known to be committing the infraction.
There are a few determining factors in an offside pass violation, one of which is known to be a situation once the blue line is considered a part of the zone where the puck is in, in case the puck is in contact with or behind the blue line when the pass is released, then the pass may be called as an “offside pass”. The so called “skate position of the receiver” occurs once the receiver has a skate contact with the red line the puck completely crosses, so the pass becomes legal no matter where this puck actually makes contact with his stick. Both of the skates in this case must be all on the far side of the previously mentioned red line once the puck crosses the red line into the attacking zone.
In the ice hockey's earliest history, this game was played due to the rules similar to rugby when the forward passing was never allowed. The hockey's offside penalty was known to be influenced from the offside penalty from the Association football and a legal pass could be made only in case it was needed to a teammate who was in a so called "onside" position behind the puck. Once an offside pass takes place, the play should be stopped and a faceoff should be conducted from the point of the infraction, no matter where exactly it occurred. Sometimes a black line was painted onto the ice surface itself at the three foot mark, being served as an early precursor to the modern blue lines.
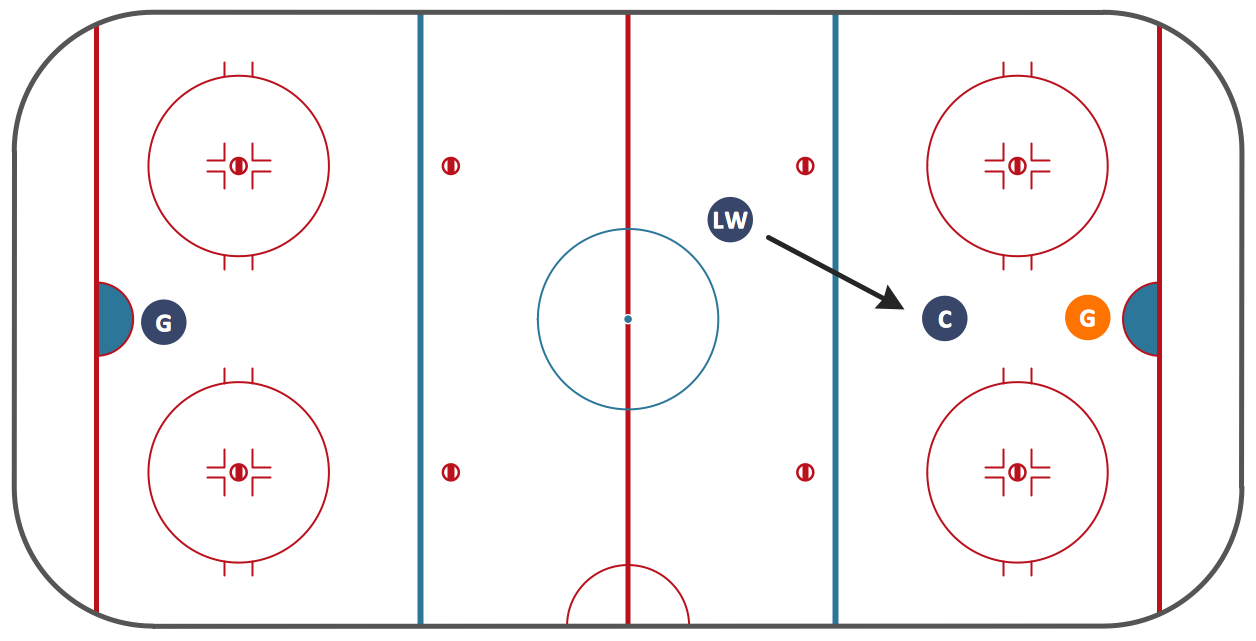
Sample 1. Ice Hockey Offside Diagram.
No matter what situation on the ice-hockey field during the game you want to illustrate, you can always do it with an ease by using the ConceptDraw DIAGRAM diagramming and drawing software which allows to make any changed to the existing examples of the already previously created ice hockey offside diagrams, which all can be found in the Hockey solution from ConceptDraw STORE application, which was developed by the CS Odessa specialists in order to simplify all the ConceptDraw DIAGRAM users work of drawing such ice-hockey related diagrams as well as many other schematics.


-Sample.png)