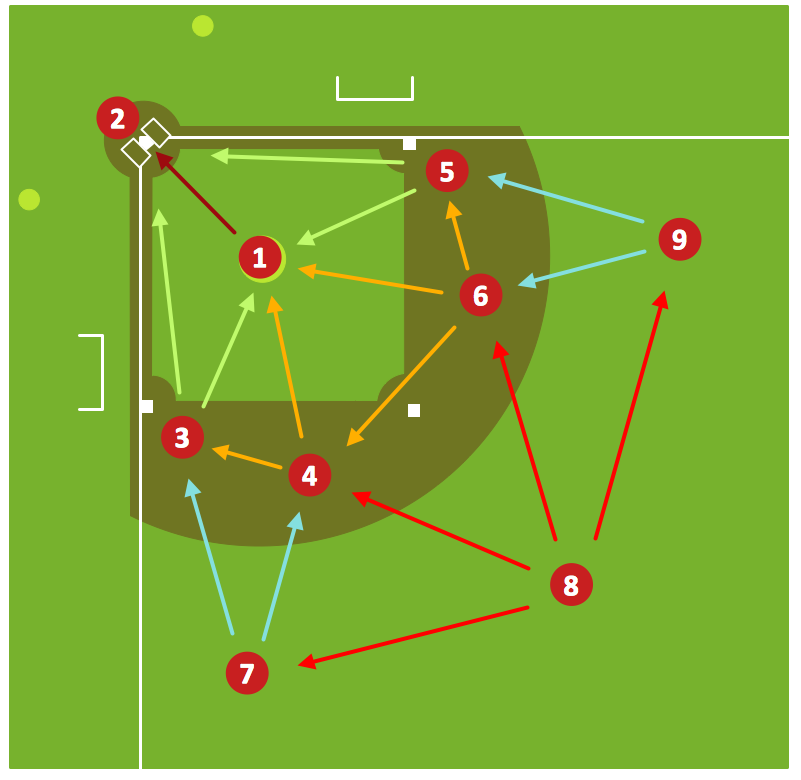
Sample 1. Baseball Diagram – Defensive Fly Ball.
This diagram was created in ConceptDraw DIAGRAM using the "Baseball Positions" and "Baseball Fields" libraries from the Baseball solution. An experienced user spent 10 minutes creating this sample.
It demonstrates a portion of the solution's capabilities and the professional results you can achieve.
All source documents are vector graphic documents. They are available for reviewing, modifying, or converting to a variety of formats (PDF file, MS PowerPoint, MS Visio, and many other graphic formats) from the ConceptDraw STORE. The Baseball Solution is available for all ConceptDraw DIAGRAM or later users.
EIGHT RELATED HOW TO's:
Explaining offensive strategies of American Football is practically impossible without drawing a diagram. If you need to do this more than once you have to choose an appropriate tool allows you to change diagrams easily. ConceptDraw DIAGRAM extended with the Football Solution is the best choice for this case.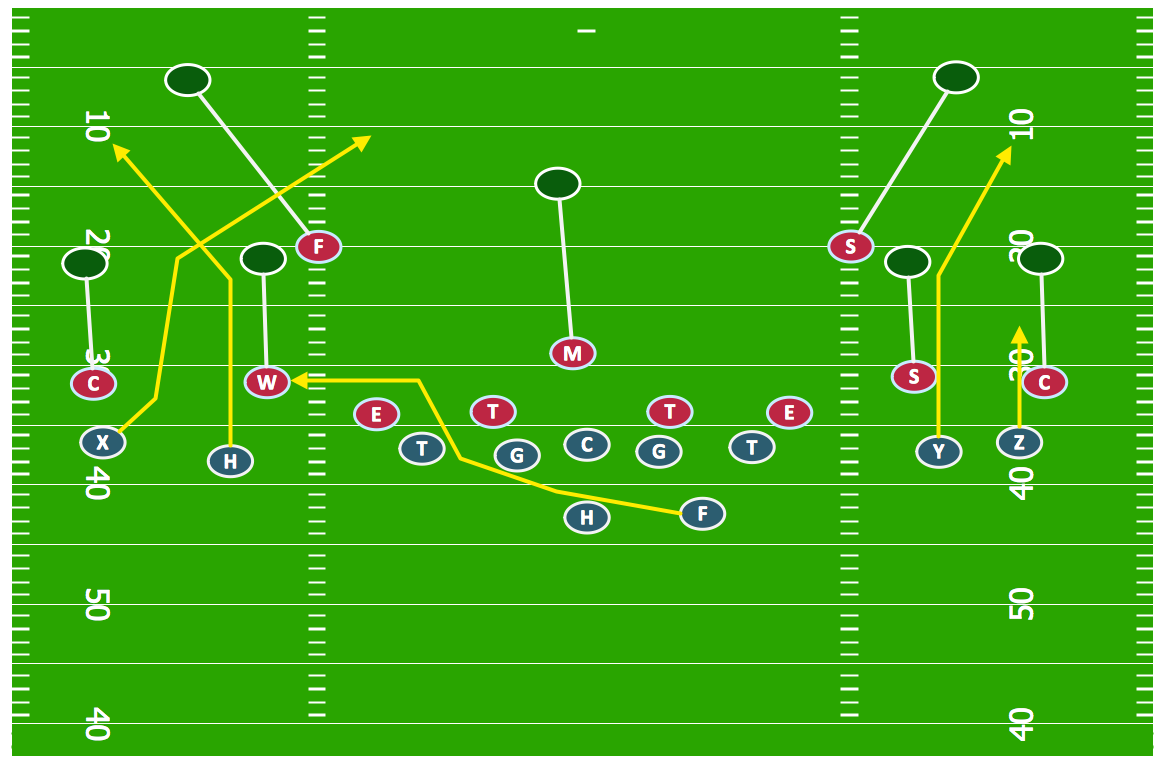
Picture: Offensive Strategy — Spread Offense Diagram
Related Solution:
The Soccer solution from the Sport area of ConceptDraw Solution Park is designed as a tool that helps produce soccer illustrations of any complexity in minutes. You can quick and easy design the professional looking plan of the soccer field with set up dimensions.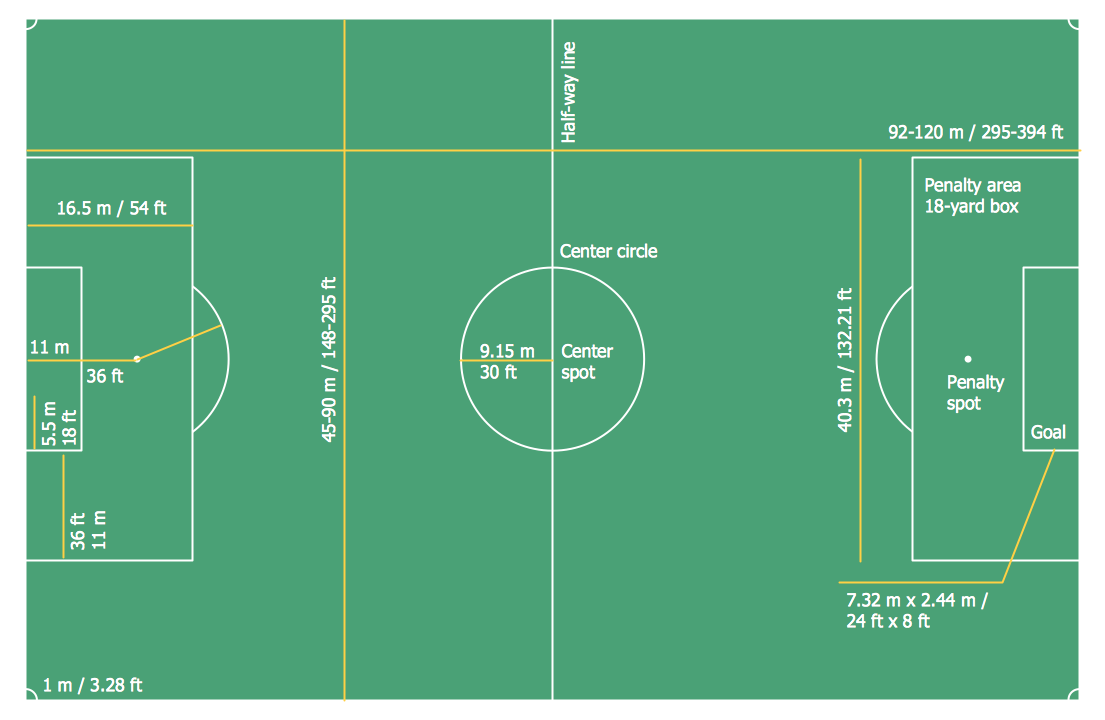
Picture: Soccer (Football) Dimensions
Related Solution:
A flowchart is a simple but very functional tool when it comes to understanding a workflow or to removing unnecessary stages from a process. When drawing flowcharts, keep in mind that there are four common types of flowcharts, like document flowcharts and data flowcharts that show control over a data or document flow over a system. To show controls on a physical level, use system flowcharts. In addition, to show controls in a program, you can draw a program flowchart.
This flowchart diagram represents the piece of an article editing process, that involves the author and editor. It was created using the Basic Flowchart notation that consists from the basic flowchart symbols. The start and the end of the process are indicated with "Terminator" symbols. The "Process" symbols show the action steps consisting from making edits and searching for a compromise, when the author does not agree with the suggestions of the editor. The "Process" symbol is the general symbol in process flowcharts. The "Decision" symbol indicates a branching in the process flow. There are two branches indicated by a Decision shape in the current flowchart (Yes/No, Disagree/Agree). This basic flowchart can be used as a repeating unit in the workflow diagram describing the working process of some editorial office.
Picture: Types of Flowcharts
Related Solution:
Video tutorials on ConceptDraw products. Try it today!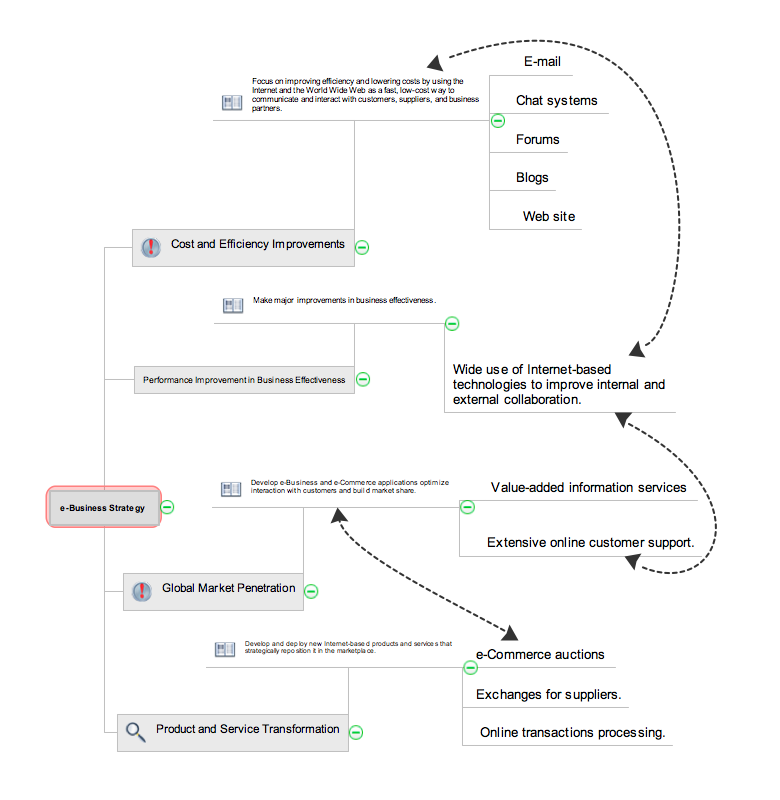
Picture: How to show a mind map presentation via Skype
Related Solutions:
ConceptDraw DIAGRAM extended with the Baseball solution provides access to libraries, templates and samples allows creating baseball diagrams and schemas.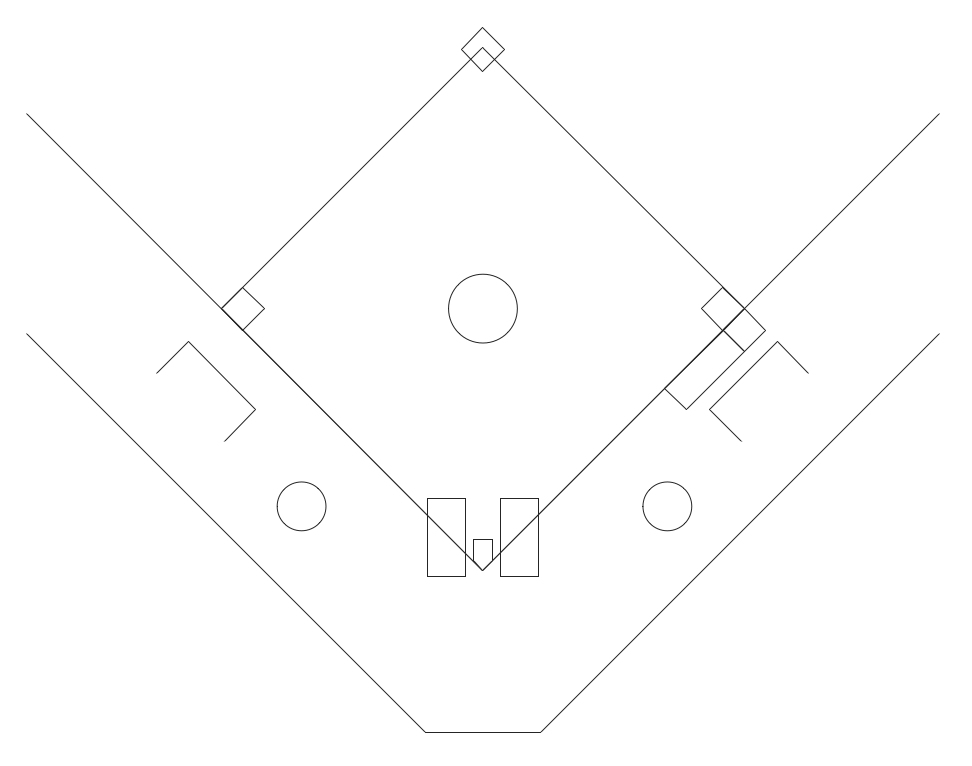
Picture: Baseball Field Schema
Related Solution:
Using diagrams is the easiest way to explain American Football defensive formations. The Football solution for ConceptDraw DIAGRAM contains a set of samples depicts the most popular defensive formations diagrams. Using embedded presentation tools you are able to share your football knowledge with wide audience.
Picture: Defensive Formation – 4-3 Defense Diagram
Related Solution:
Drawing defensive strategy diagrams using ConceptDraw DIAGRAM software extended with the Football solution saves your time, and adds more value to your work. You can easily convert vector drawing to a popular graphic format and then post it to your blog or site. There is no problem to add your logo or text copyright, or use some text comments to make your diagrams unique and recognizable.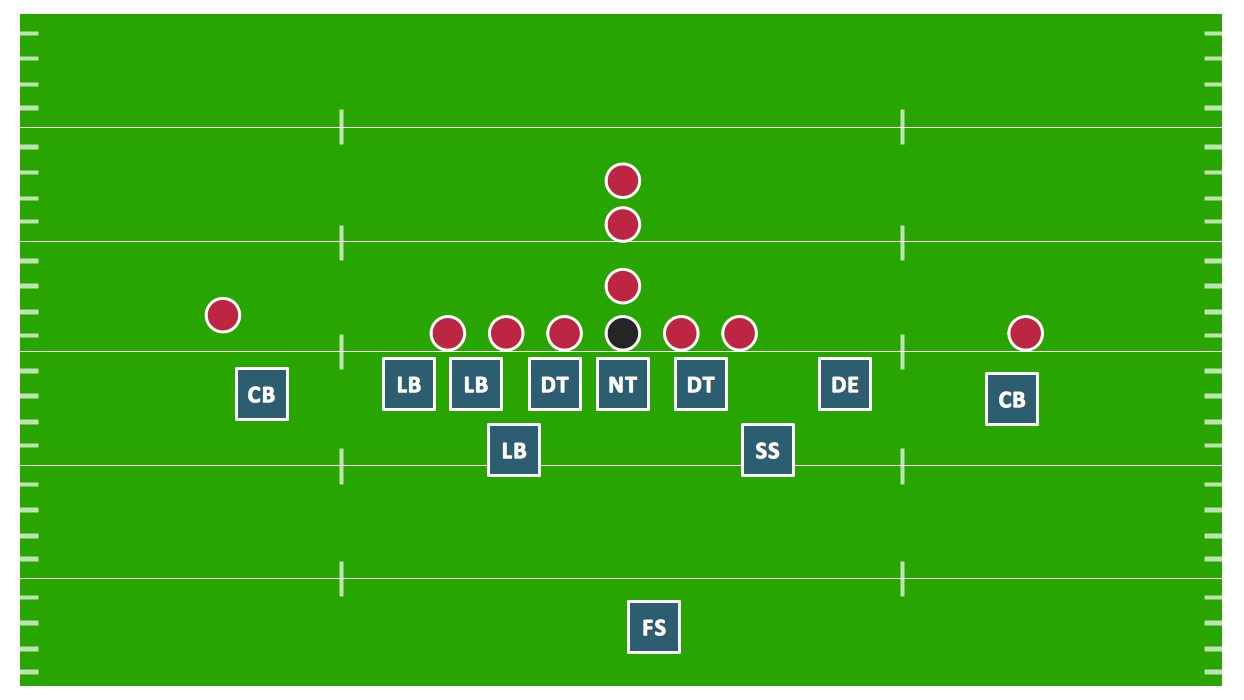
Picture: Defensive Strategy Diagram – 46 Defence
Related Solution:
Using the ready-to-use predesigned objects, samples and templates from the Business Diagrams Solution you can create your own professional-looking Venn Diagrams quick and easy.
Picture: 3 Circle Venn. Venn Diagram Example
Related Solution: