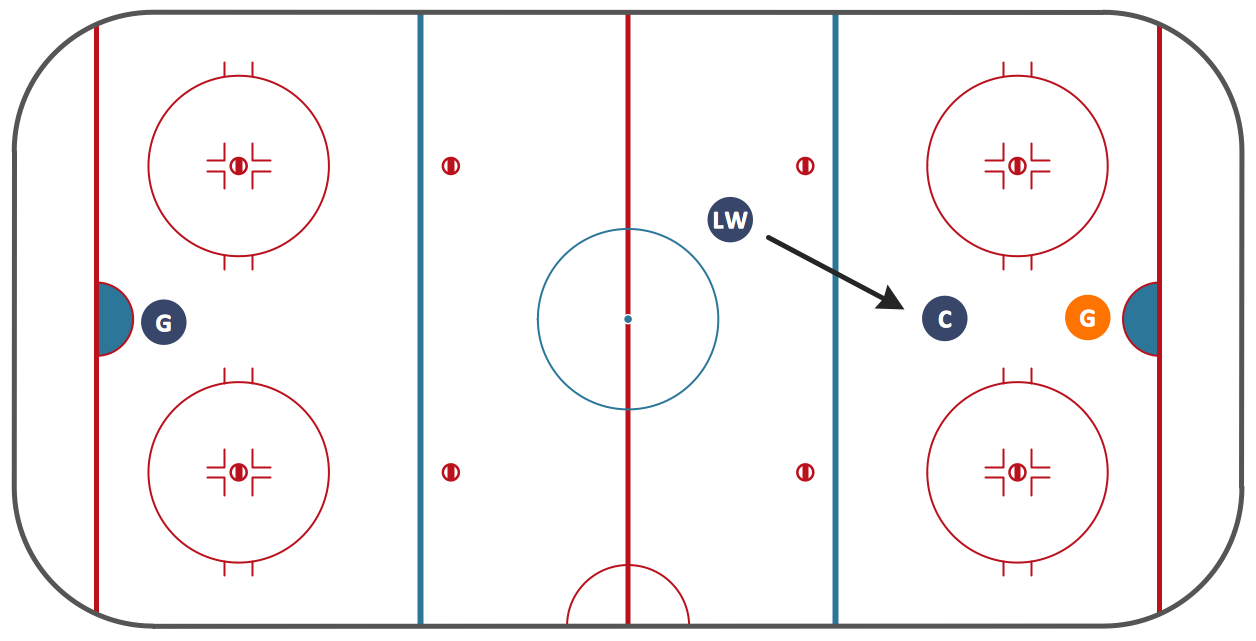
Sample 1. Ice Hockey Diagram – Penalty Kill Forecheck Angling Drill.
This diagram was created in ConceptDraw DIAGRAM using the "Ice Hockey Rinks" library from the Ice Hockey solution. An experienced user spent 1 minute creating this sample.
The sample you see on this page was created in ConceptDraw DIAGRAM using the Ice Hockey Solution; it demonstrates a portion of the solution's capabilities and the professional results you can achieve.
All source documents are vector graphic documents. They are available for reviewing, modifying, or converting to a variety of formats (PDF file, MS PowerPoint, MS Visio, and many other graphic formats) from the ConceptDraw STORE. The Ice Hockey Solution is available for all ConceptDraw DIAGRAM or later users.
TEN RELATED HOW TO's:
Explaining the soccer techniques and rules becomes much more easier and time saving with illustrations. The Soccer solution from the Sport area of ConceptDraw Solution Park provides the libraries, templates and samples that will help you produce the soccer illustrations of any complexity in minutes.
Picture: Create Soccer (Football) Positions
Related Solution:
Using diagrams is the easiest way to explain the soccer formations. The Soccer solution from the Sport area of ConceptDraw Solution Park is designed as a tool that helps you produce the soccer diagrams in a few minutes. The predesigned samples of the Soccer solution for ConceptDraw DIAGRAM depict the most popular formation diagrams.
Picture: Soccer (Football) Formation
Related Solution:
The Basketball Field library from the Basketball solution provides a complete set of ready-to-use predesigned vector courts: horizontally and vertically located, whole and half of court, colored and not, courts with views from different sides.
All courts objects are designed according to the real basketball courts dimensions. Simply drop the needed basketball field in the vector from the library to design your own basketball diagram.
Picture: Basketball Field in the Vector
Related Solution:
There are many ways to define the flow of information within a system. Structured-systems analysis method often uses data flow diagrams to show data flow, data storages and data processing visualization. These diagrams are easy to develop and quite useful.
Here is a dataflow diagram presenting an example of the manufacturing process flow. The oval process shapes represent a process that controls data within the current system. The process may produce data or make some action based on data. Data flows are represented by lines. They show the movement of information through the system. The direction of the data flow is depicted by the arrow. The external entities are shown by rectangles. They represent the external entities interacting with the system. The data store objects (unclosed rectangles) are used to show data bases participating in a process flow.
Picture: Data Flow Diagram
Related Solution:
In ConceptDraw DIAGRAM you can produce ice hockey diagrams of any complexity for any presentaion needs, using a combination of tools. To adopt the sample below for presentation needs place positions and arrows onto different layers of your document and then make them visible one by one during a presentation.
Picture: Ice Hockey Diagram — Defensive Strategy — Neutral Zone Trap
Related Solution:
To quick and easy draw the diagrams with soccer (football) tactics, use the Soccer (Football) Fields and Soccer (Football) Positions libraries from the Soccer solution from the Sport area of ConceptDraw Solution Park
Picture: Soccer (Football) Tactics
Related Solution:
Basketball is a popular sport played by two teams of five players with a ball. The game takes place on a rectangular court. The team goal is to score a ball into the basket of the opponent team. The team with the most points wins the game.
ConceptDraw DIAGRAM diagramming and vector drawing software extended with Basketball solution from the Sport area of ConceptDraw Solution Park is a very useful tool for designing the basketball-related diagrams of any complexity.
Picture: Basketball Plays Software
Related Solution:
Explaining soccer positions becomes much more easier and time saving with visual drawings. ConceptDraw DIAGRAM software extended with the Soccer solution from the Sport area of ConceptDraw Solution Park is very useful tool that will help you design the soccer-related drawings of any complexity in minutes.
Picture: Soccer (Football) Positions
Related Solution:
A causal model is an abstract concept, that describes the causal mechanisms of a system, by noting certain variables and their influence on each other, in an effort to discover the cause of a certain problem or flaw. This model is presented in diagram form by using a fishbone diagram.
ConceptDraw DIAGRAM diagramming and vector drawing software enhanced with Fishbone Diagrams solution helps you create business productivity diagrams from Fishbone diagram templates and examples, that provide to start using of the graphic method for the analysis of problem causes. Each predesigned Fishbone Diagram template is ready to use and useful for instantly drawing your own Fishbone Diagram.
Picture: Fishbone Diagram Template
Related Solution:
ConceptDraw DIAGRAM software extended with the Ice Hockey Solution allows you to draw professional looking ice hockey diagrams in minutes. You can easily customize existing samples or produce you own ones.
Picture: Ice Hockey Diagram — Entering Offensive Zone Drill
Related Solution: