SWOT Sample in Computers
SWOT analysis is a method of the making plan for evaluate the Strengths, Weaknesses, Opportunities, and Threats involved in a project. It involves specifying the objective of the project and identifying the internal and external causes for the accomplishing project goals.
The ConceptDraw DIAGRAM is a best diagram software. The SWOT Analysis solution includes the SWOT matrix samples, and templates that allow users create own SWOT diagram.

Sample 1. SWOT analysis sample - Innovative business.
This sample of a completed SWOT Matrix with example entities provides an example to help you start your analysis of Strengths, Weaknesses, Opportunities and Threats facing a project or business.
See also:
Marketing — Matrices
- Marketing positioning matrix - Product positioning map
- Product-market matrix - Ansoff matrix
- BCG matrix - Boston growth-share matrix
- Feature comparison chart - Digital scouting cameras
- Marketing matrix diagram - Competitive strategies
- Marketing matrix diagram - Porters value chain
- Marketing mindmap - Marketing research project
- Marketing mind map - Strategic accomplishment mapping
- Twitter Compaign for New Software Product
- Marketing mind map - Sales Call
TEN RELATED HOW TO's:
When describing any computer network, we imagine a set of devices and nodes, arranged in some way. Talking about network structures, we should distinguish physical and logical network topologies, as physical topology is about devices location and logical topology illustrates data flow. In the same time, they do not have to match, and some devices, such as repeaters, may have a physical star layout, but a bus logical topology.
There are two main types of computer network topologies: Physical topology that show the physical organization of a network - equipment and types of connections. Star network topology involves a set of devices that is connected to a single hub (router). Ring network topology means that, devices connected according this topology have two connections, connecting with nearby devices to make a loop. Bus network topology is the topology presented at the current diagram. It is similar to a ring topology. The difference is that data moves up and down a linear connection, copying itself where network equipment works as bus-stations along the way. This network topology can be used for small network, or when adding an extra device into a network.
Picture: Network Topologies
Related Solution:
The Internet Connectivity of the computers, mobile devices, computer networks to the Internet enables the users to access the various Internet services. There are many ways and technologies of the connection to the Internet with different data signaling rates: Wireless, Ethernet cable, Optical fiber, Dial-up, DSL, broadband Internet access, etc.
This example was created in ConceptDraw DIAGRAM using the Computer and Networks solution from the Computer and Networks area of ConceptDraw Solution Park and shows how the customers connect to ISPs and ISPs connect between the tiers (peering and transit).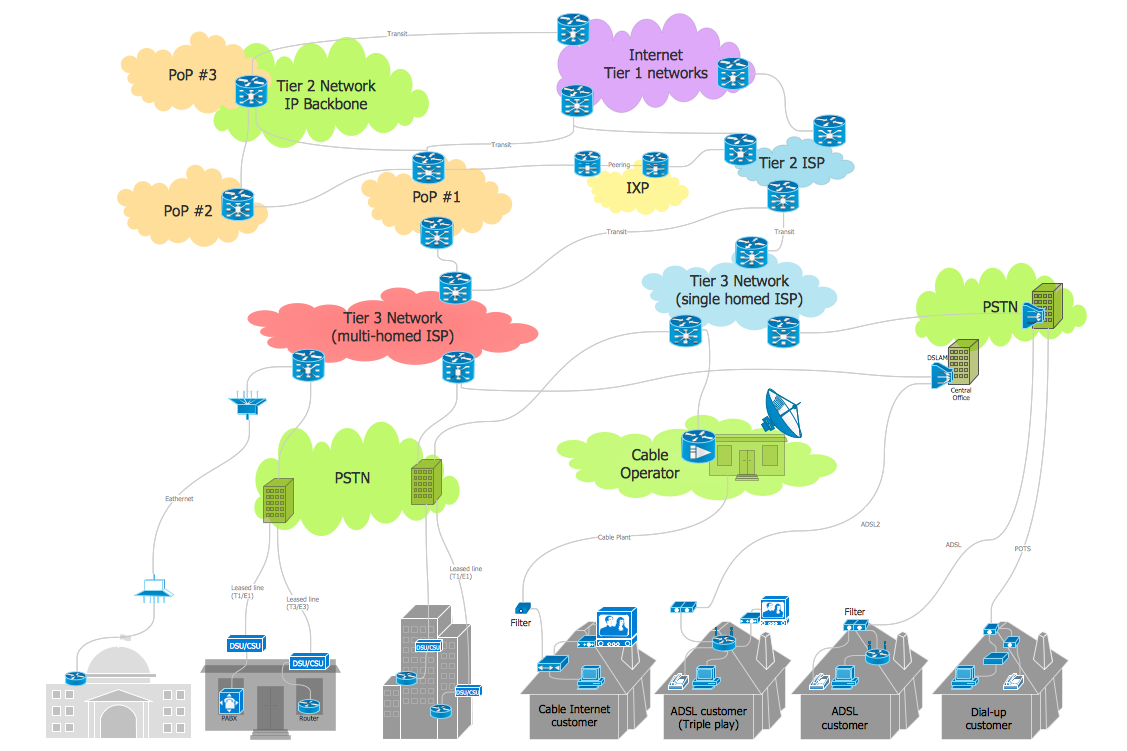
Picture: Internet Connectivity. Computer and Network Examples
Related Solution:
During the planning, discussing and execution of a project you may need to prepare a presentation using project views such as the Gantt Chart, Multiproject Dashboard or Resource Usage View. It’s easy do with ConceptDraw PROJECT!
Picture: How to Create Presentation of Your Project Gantt Chart
SWOT matrix is a structured planning method used to evaluate the strengths, weaknesses, opportunities and threats involved in a project or in a business venture. ConceptDraw DIAGRAM diagramming and vector drawing software extended with SWOT and TOWS Matrix Diagrams Solution from the Management Area will help you design SWOT Matrix of any complexity quick and easy.
Picture: SWOT Matrix
Related Solution:
ConceptDraw MINDMAP is ready to provide you with mind mapping tool which can serve as comprehensive productivity tool for your business.
Picture: Think. Act. Accomplish.
Mind map that organizes tasks, resources, outcomes and people for a marketing research project.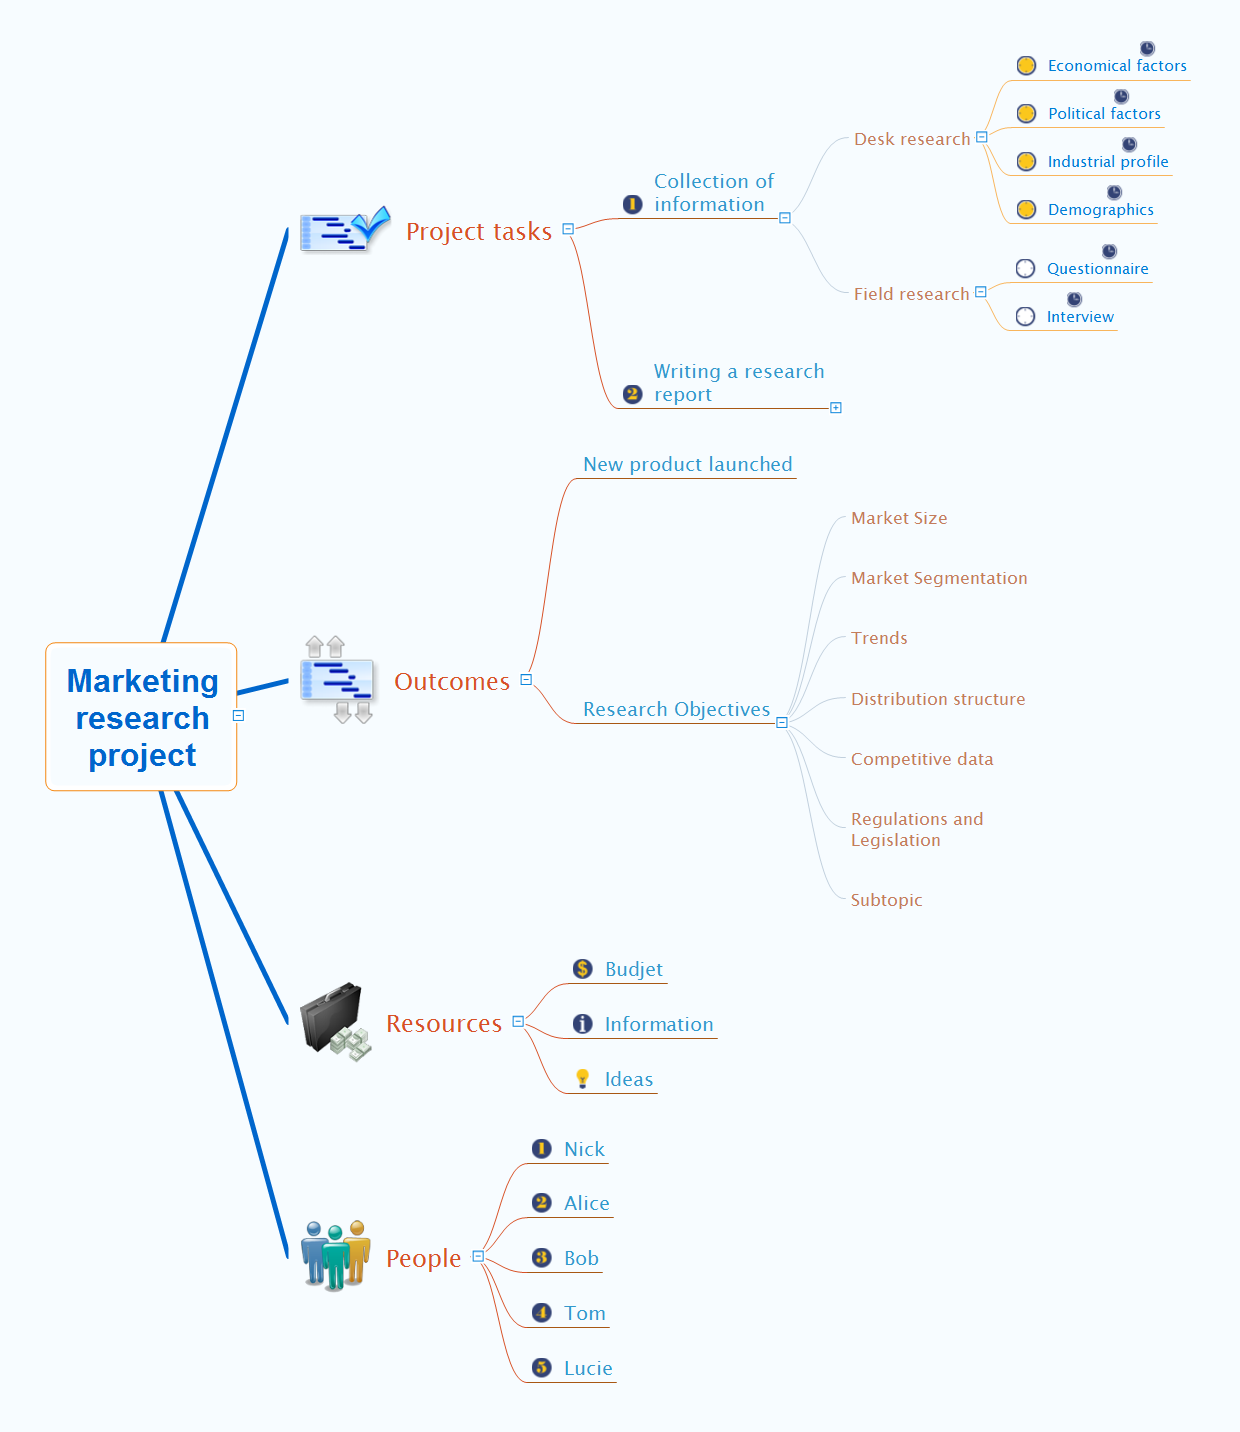
Picture: Marketing Research Project
Related Solution:
ConceptDraw Ice Hockey solution is a good tool to think about complex things. You don't need a software during hockey match, of course. Drawing software helps to plan strategy and tactics before a match, and then analyze mistakes and results.
Picture: Ice Hockey Diagram – Penalty Kill Forecheck Angling Drill
Related Solution:
This sample was created in ConceptDraw DIAGRAM diagramming and vector drawing software using the Computer and Networks solution from Computer and Networks area of ConceptDraw Solution Park.
A Daisy Chain is the simple computer network. It is the easiest way to add more Ethernet devices into the network. In the Daisy Chain network one computer is connected to the next without any intervening devices, thus the message is sent from one computer to the next and then to the next and so on. A Daisy Chain can be linear or ring
Picture: Daisy Chain Network Topology
Related Solution:
Use samples and templates to describe your own quality processes, brainstorm, and structure quality issues.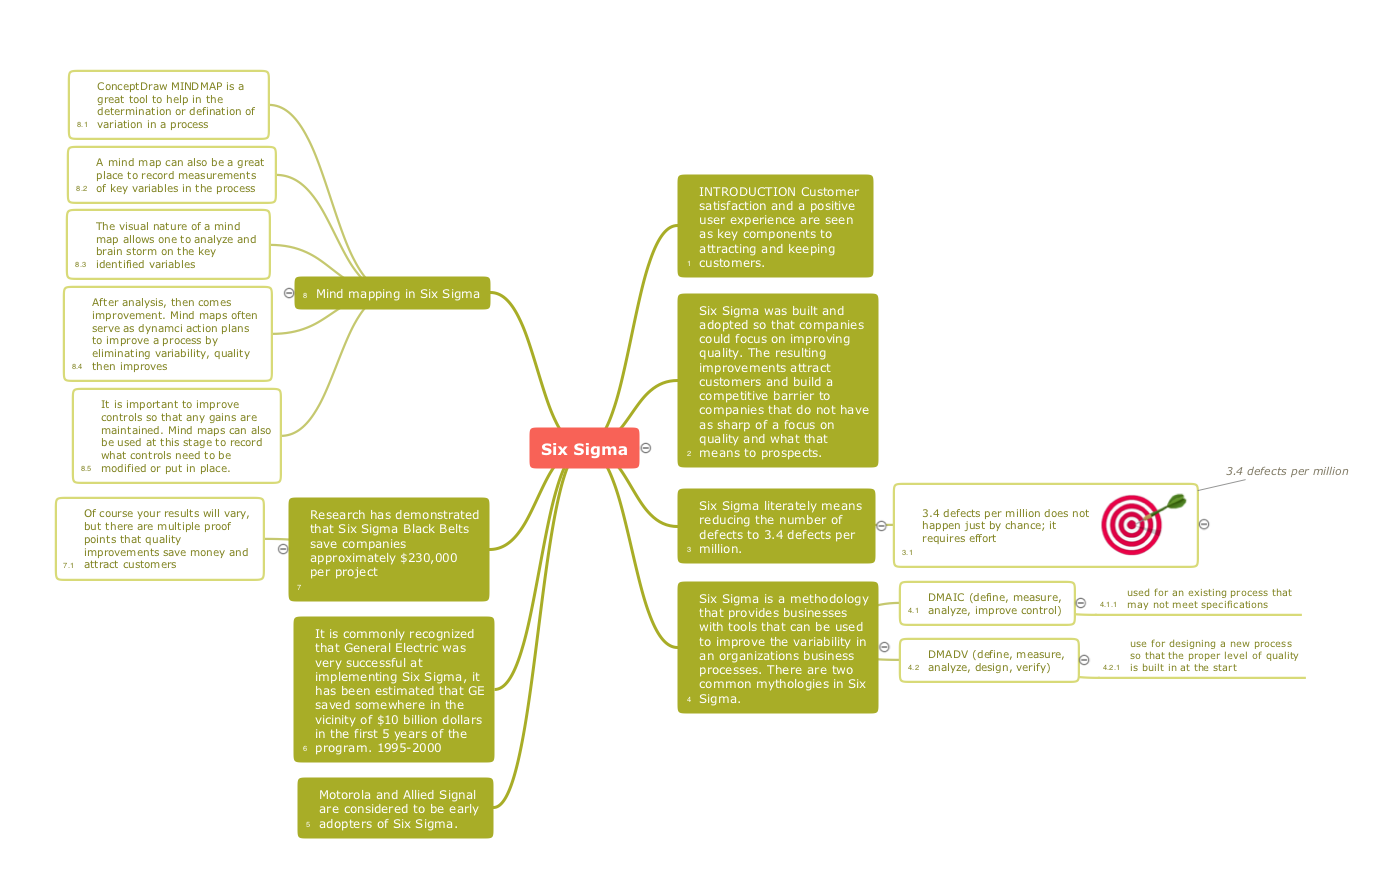
Picture: Quality Mind Maps - samples and templates
Related Solution:
Different organizations have different organizational structures. Matrix organization is one of the most popular and widely used type of organizational structure. Use ConceptDraw DIAGRAM diagramming and vector drawing software extended with 25 Typical Orgcharts solution from the Management area of ConceptDraw Solution Park for fast and easy designing matrix organizational chart for your company.
Picture: Matrix Organization
Related Solution:
ConceptDraw
DIAGRAM 18