
Pic.1 Business Board Org Chart
Using the Organizational Charts Solution for ConceptDraw DIAGRAM you can create your own professional Organizational Chart Diagrams quick and easy.
All the diagrams produced with ConceptDraw DIAGRAM are vector graphic documents and are available for reviewing, modifying, and converting to a variety of formats (image, HTML, PDF file, MS PowerPoint Presentation, Adobe Flash or MS Visio).
TEN RELATED HOW TO's:
Organization Chart Templates - Organizational Charts Solution from the Management Area of ConceptDraw Solution Park provides a wide collection of predesigned templates and samples that will help you create the Organizational Charts of any complexity in one moment.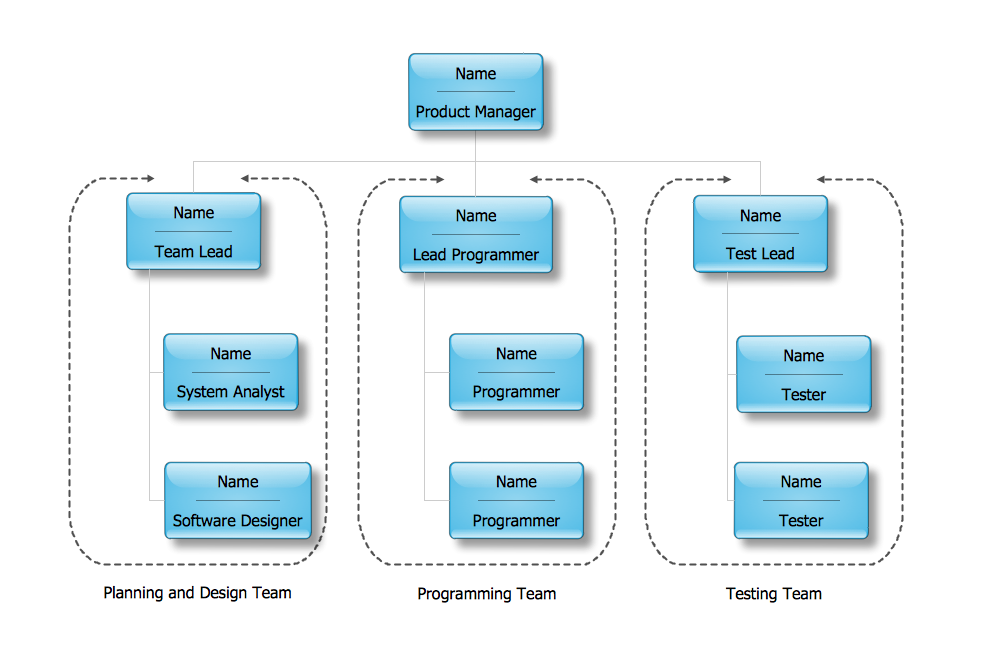
Picture: Organization Chart Templates
Related Solution:
Sales organization becomes easier when you have proper tools to motivate your team and measure team and personal progress. ConceptDraw Sales Dashboard helps you in sales organization visualizing sales data that gives your team a visual appearance of their progress.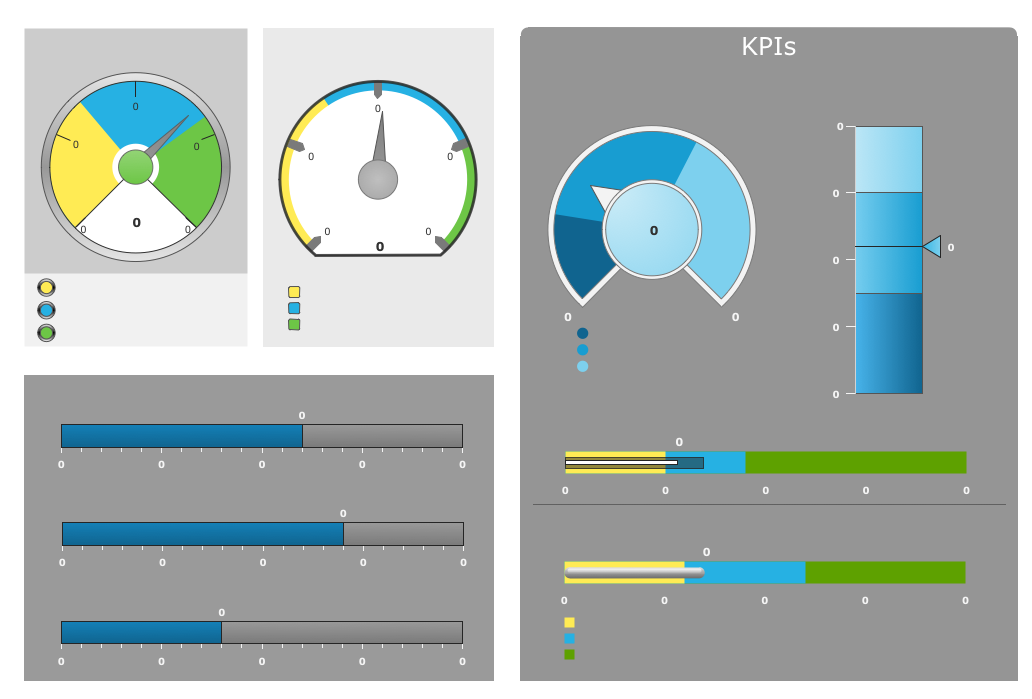
Picture: Sales Organization
This sample was created in ConceptDraw DIAGRAM diagramming and vector drawing software using the Flowcharts solution from the Diagrams area of ConceptDraw Solution Park.
This sample shows the Flowchart that displays the procedures of 2PP (two-party preferred) voting and counting the voters. The two-party-preferred vote is the result of the elections that was distributed to the final two parties.
Picture: Basic Flowchart Images. Flowchart Examples
Related Solution:
ConceptDraw Business Finance Illustration examples and libraries contain vector clip art for drawing different Business and Finance Illustrations. You may find Advertising example, Project Management example, Business Model example and many more.
Picture: Business and Finance Illustrations Example
Related Solution:
An organization structure reflects the composition and hierarchy of an organization, determines the distribution of authorities and responsibilities. ConceptDraw DIAGRAM diagramming and vector drawing software extended with 25 Typical Orgcharts solution from the Management area of ConceptDraw Solution Park allows effectively represent the organization structure of the company in the form of Organizational Chart.
Picture: Organization Structure
Related Solution:
Experience the main advantage of using ConceptDraw Ice Hockey solution with all tools you need to 🔸 create professional ice hockey diagrams as quickly as possible and visualize ✔️ ice hockey rinks, ✔️ roles, ✔️ positioning, ✔️ game situations, ✔️ tactics, and ✔️ strategies to succeed in tactical planning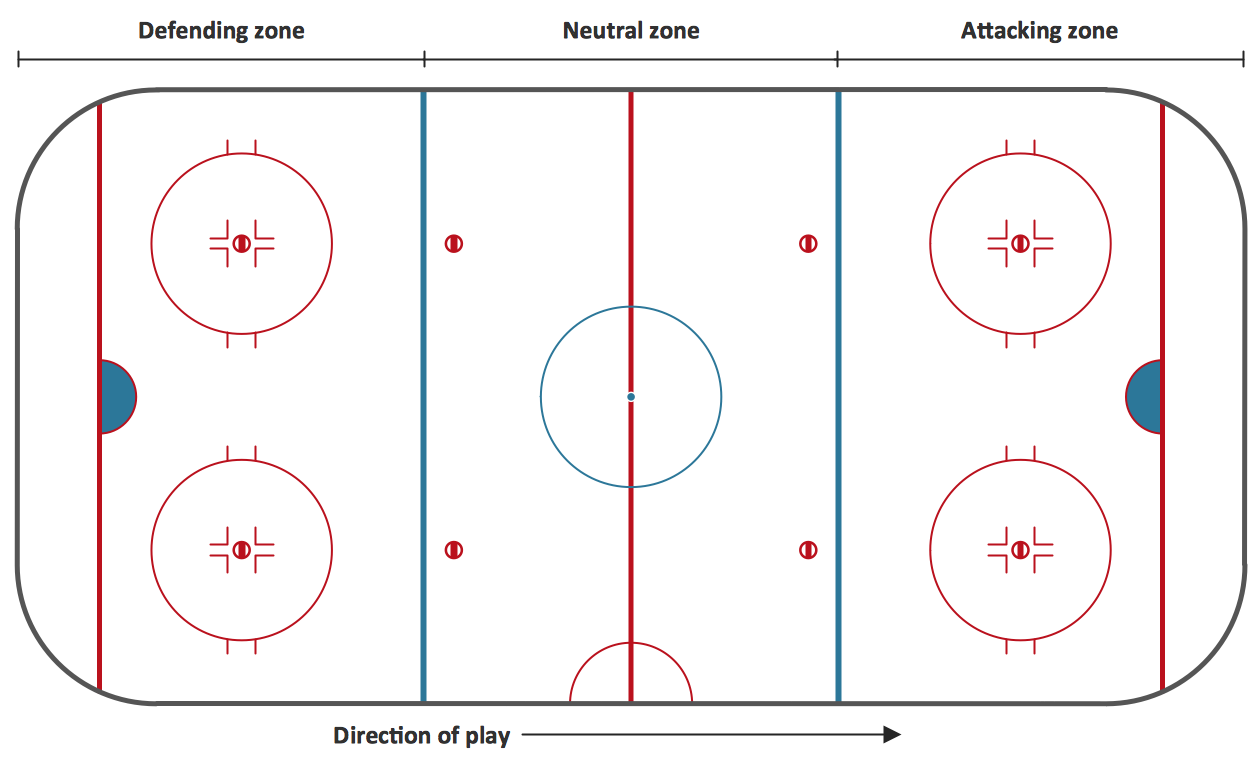
Picture: Ice Hockey Rink Diagram
Related Solution:
Agile methodology is an excellent alternative to waterfall and traditional sequential development. ConceptDraw DIAGRAM software extended with SCRUM Workflow solution is ideal for quick and easy designing various diagrams, charts, mind maps and schematics illustrating software development using Agile methodologies, and in particular Scrum methodology.
Picture: Agile Methodology
Related Solution:
Kanban Board is a really popular tool used in a great number of industries, applied to any process or methodology and by companies of any size. It provides great transparency of work distribution and existing bottlenecks in order to remove these bottlenecks. ConceptDraw DIAGRAM software enhanced with Kanban Board solution is a perfect software for designing Kanban board of any complexity in minutes.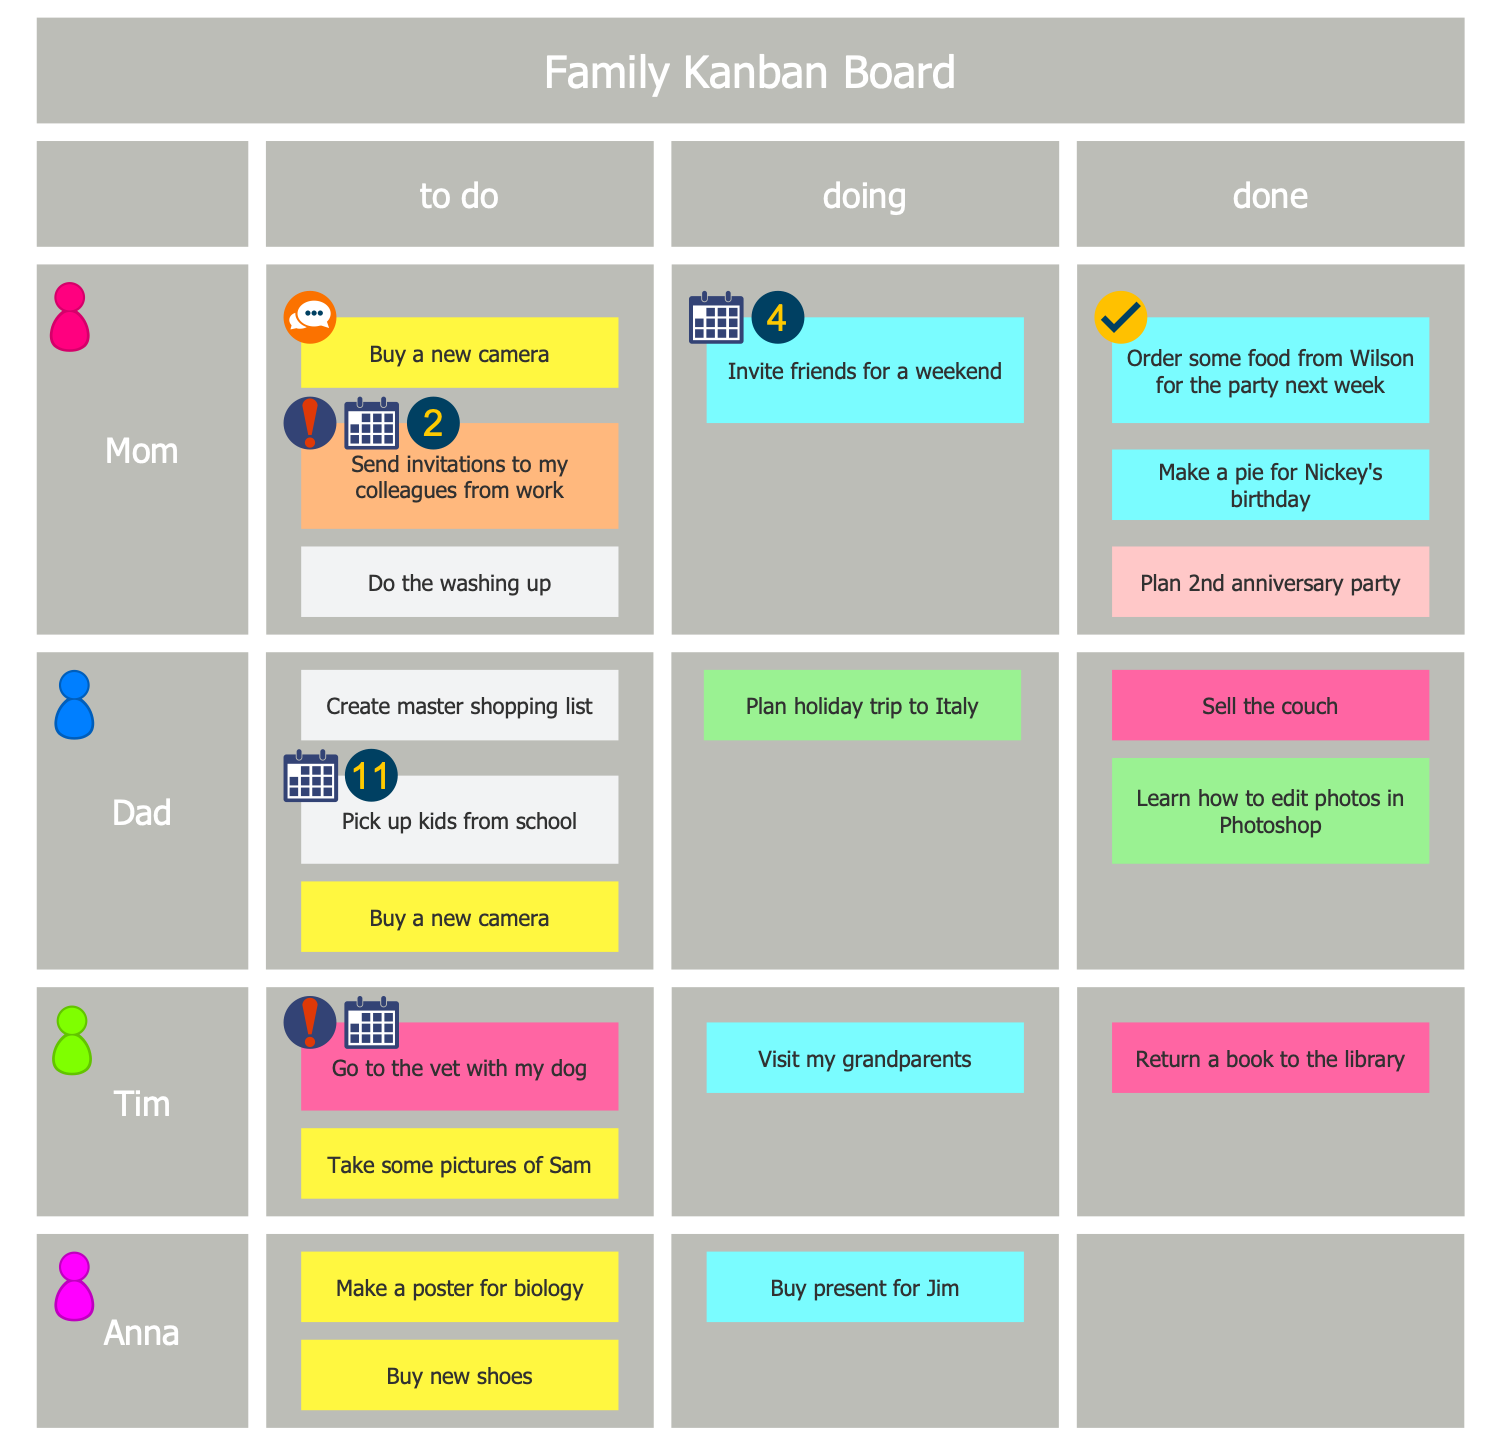
Picture: Kanban Board
Related Solution:
A flowchart is a powerful tool for examining processes. It helps improving processes a lot, as it becomes much easier to communicate between involved people, to identify potential problems and to optimize workflow. There are flowcharts of different shapes, sizes and types of flowchart vary from quite basic process flowcharts to complex program flowcharts. Nevertheless, all these diagrams use the same set of special symbols like arrows to connect blocks, parallelogram to show data receiving or rectangles for showing process steps.
Basic flowcharts are used to represent a simple process algorithm. A basic flowchart notation consists of rectangles (business processes), arrows (the flow of information, documents, etc.). The same notation is used in items such as the "decision", which allow you to do the branching. To indicate the start of the entire business process and its termination can be used the "Terminator" element. The advantages of Basic Flowchart are simplicity and clarity. With it you can quickly describe the business process steps. Creating of Basic Flowchart does not require any special knowledge, as easily understand by employees with different levels of education and IQ.
Picture: Types of Flowchart: Comprehensive Overview
Related Solution:
Video tutorials on ConceptDraw products. Try it today!
Picture: How to Draw a Bubble Chart
Related Solution: