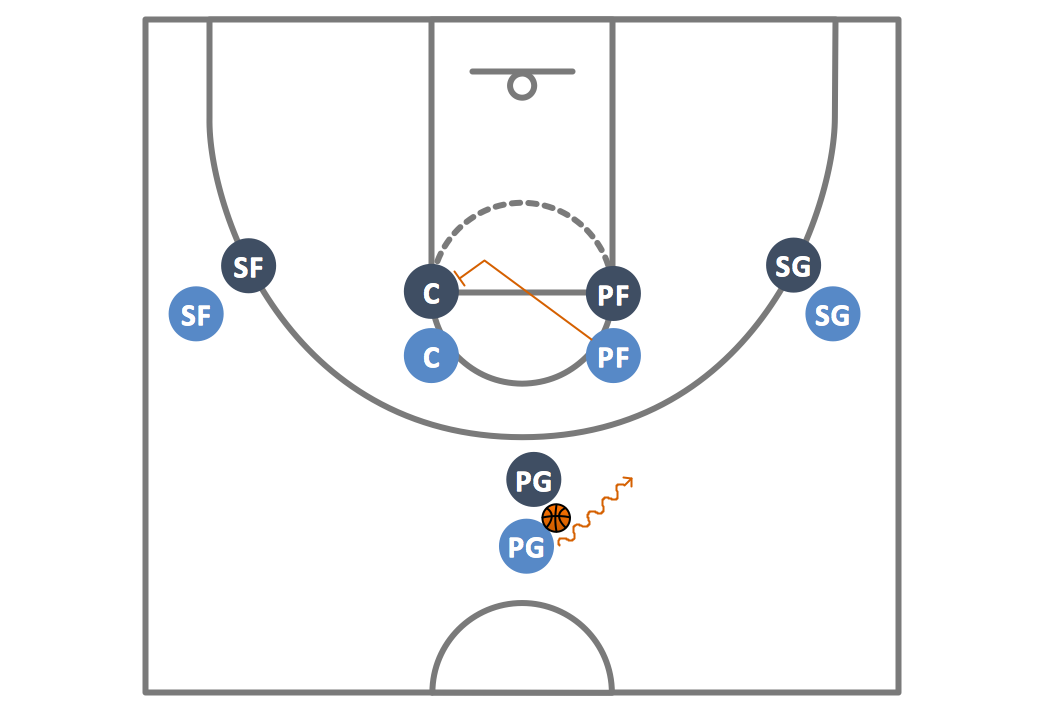
Sample 1. Basketball Plays 1–4 Stack Offense Pick and Roll Play
The wide collection of predesigned templates and samples of the Basketball solution for ConceptDraw DIAGRAM depict the diagrams of the most popular basketball offensive and defensive strategies and tactics:
- 1–4 Stack Offense Pick and Roll Play
- Triangle Offense
- 3–on–3 Play
- 1–4 low Stack Offense
- Man-to-Man Defense

Sample 2. Basketball Plays – Triangle Offense
The Basketball solution templates and samples are so various that will be suitable for any case. They are ready-to-modify and you can simply change any of them for your needs.
The Basketball solution for ConceptDraw DIAGRAM contains also two libraries with ready-to-use predesigned vector objects of the basketball courts and positions.

Sample 3. Basketball Plays – 3– on– 3 Plays
It's incredibly easy and quick to create the basketball-related drawings in ConceptDraw DIAGRAM Use the "Basketball Courts" and "Basketball Positions" libraries from the Basketball solution and follow the next steps to create your own basketball play diagram quick and easy:
- From the "Basketball Courts" library drop a court object to your document;
- From the "Basketball Positions" library drop all positions object you need to your document;
- Place positions on the court according to your drawing idea;
- Add arrows or text labels if needed.

Sample 4. Basketball Plays – 1–4 low Stack Offense
The samples you see on this page were created in ConceptDraw DIAGRAM using the vector objects from the "Basketball Courts" and "Basketball Positions" libraries from the Basketball solution. They demonstrate the solution's capabilities and the professional results you can achieve. An experienced user spent no more than 10 minutes creating every of these samples.
All source documents are vector graphic documents. They are available for reviewing, modifying, or converting to a variety of formats (PDF file, MS PowerPoint, MS Visio, and many other graphic formats) from the ConceptDraw STORE. The Basketball Solution is available for all ConceptDraw DIAGRAM or later users.
TEN RELATED HOW TO's:
How to Draw ER Diagrams? With Entity-Relationship Diagram (ERD) solution from the Software Development Area for ConceptDraw Solution Park you are able to draw ER diagram with no problem. It includes 45 predesigned icons advocated by popular Chen's and Crow’s Foot notations that can be used when describing an enterprise database.
Picture: How to Draw ER Diagrams
Related Solution:
Microsoft Azure is widely used cloud platform which was created by Microsoft and now is managed by Microsoft datacenters in 19 regions of the world, and has a wide set of benefits and features.
ConceptDraw DIAGRAM diagramming and vector drawing software extended with Azure Architecture Solution from the Computer and Networks area of ConceptDraw Solution Park is the best for designing various pictorial infographics, illustrations and materials showing the possibilities and work of Microsoft Azure Cloud System and Azure services.
Picture: Microsoft Azure
Related Solution:
How to design a Bubble Chart? It’s very easy! All that you need is a powerful software. Never before creation of a Bubble Chart wasn’t so easy as now with tools of Business Diagrams Solution from the Management Area for ConceptDraw Solution Park.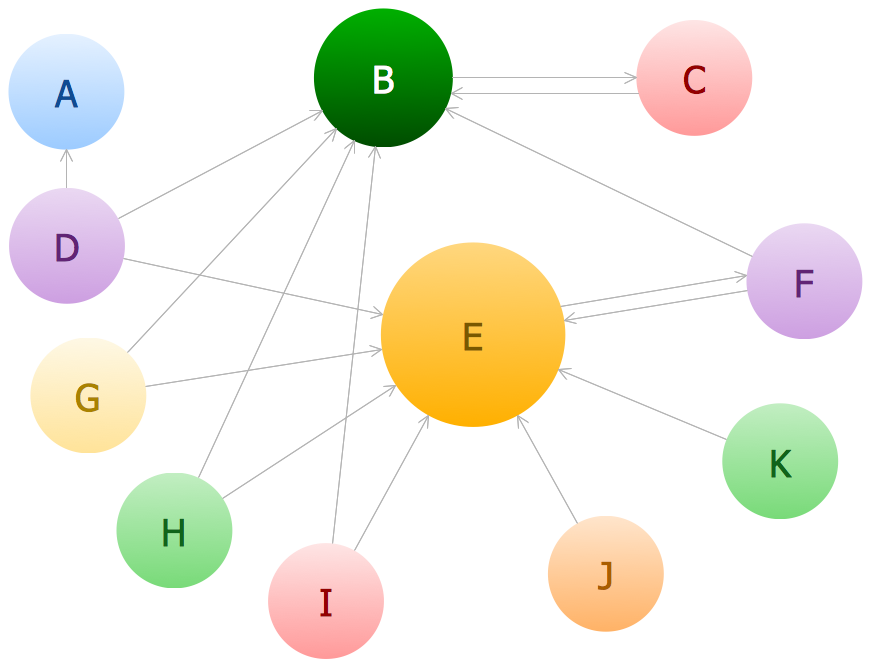
Picture: Bubble Chart
Related Solution:
ConceptDraw DIAGRAM extended with the Baseball solution provides access to libraries, templates and samples allows creating baseball diagrams and schemas. All plays and positions diagrams are available as ready-to-modify samples.
Picture: Baseball Field Sample
Related Solution:
Drawing baseball diagrams using ConceptDraw DIAGRAM software extended with the Baseball solution saves your time, and adds more value to your work.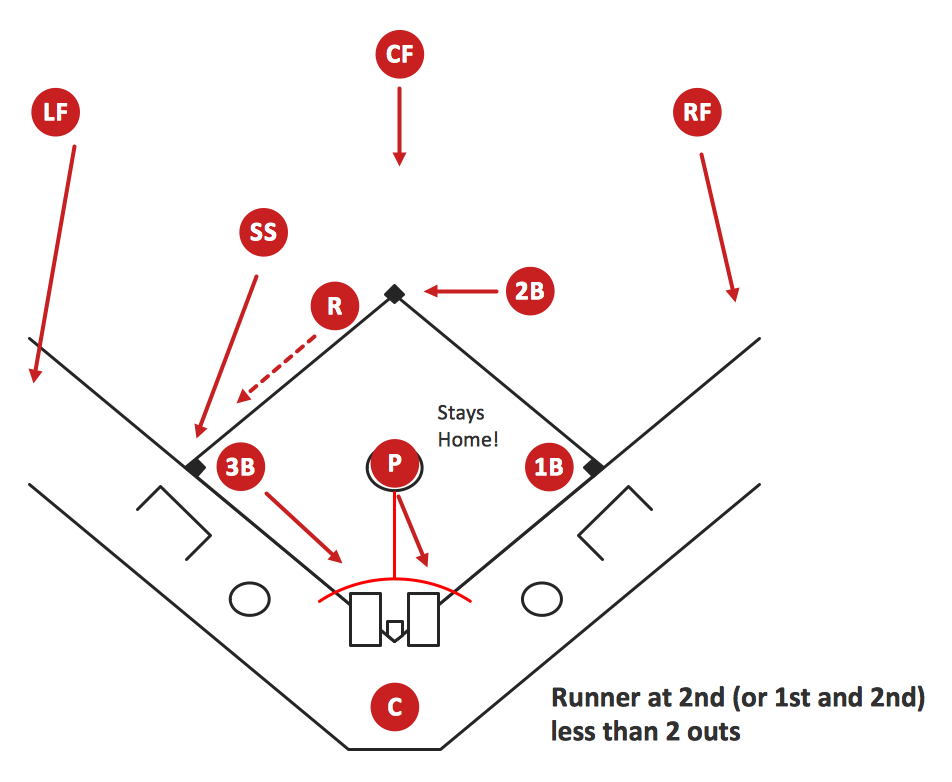
Picture:
Baseball Diagram
Basic Bunt Coverage – Runner at 2nd
Related Solution:
All of the needed tools for that, including the field objects, were designed in accordance with the real field dimensions and they all can be found in the solution, as well as the corner view template and many other samples.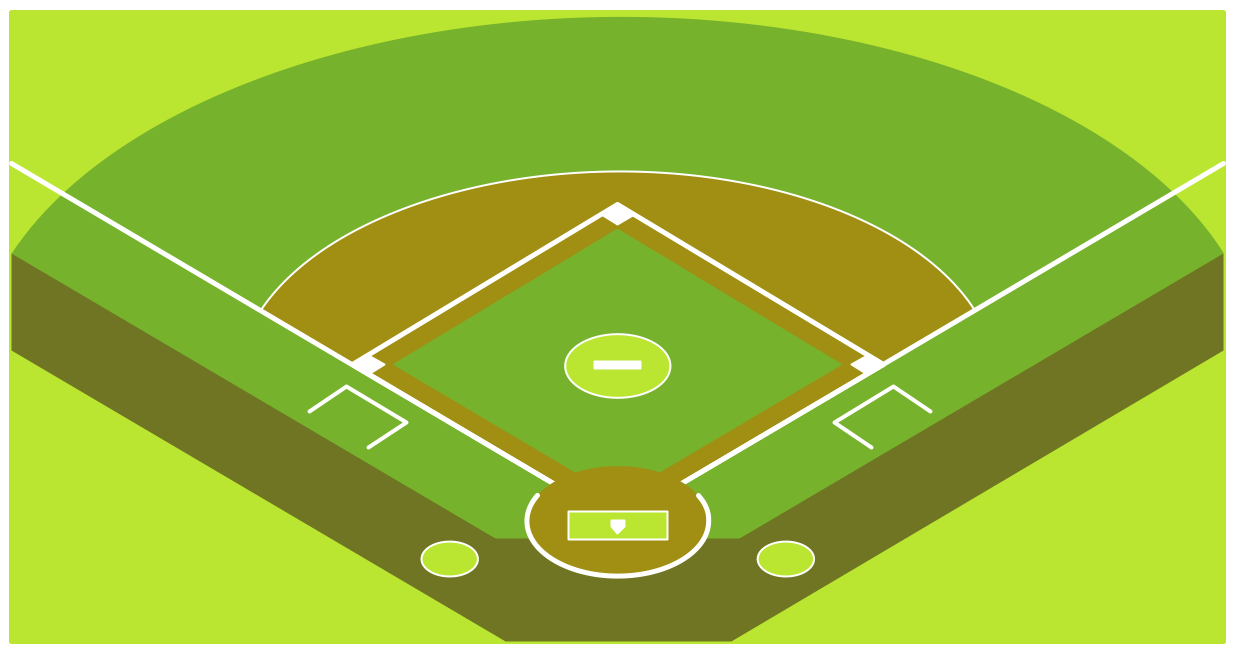
Picture:
Baseball Diagram
Baseball Field – Corner View – Template
Related Solution:
Football diagram is the simplest way to explain American Football details. Plenty offenses and defenses may startle a newbie. Using visual method to explain the meaning of each formation, play or strategy gives a clear understanding. ConceptDraw DIAGRAM software extended with the Football solution is an amazing tool for producing and presenting football diagrams.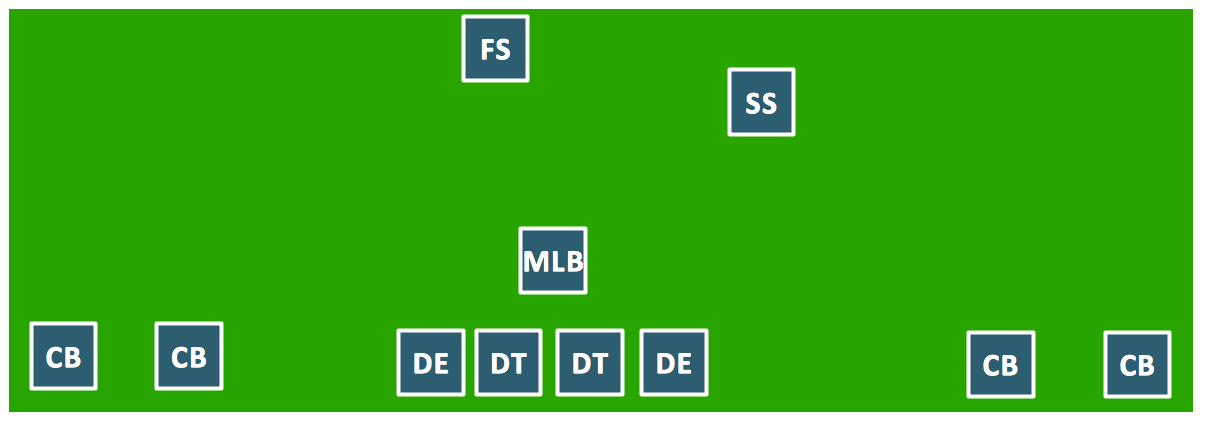
Picture: Dime Defense Diagram
Related Solution:
The modern garden design is a full complex of works for design, decorating and gardening. Landscape design offers a large number of styles for the modern garden design, their origins go back centuries. But do not forget that the modern garden design is first of all an individual project for a specific landscape and specific owner of the land, and sometimes it is appropriate to apply the combination of styles.
ConceptDraw DIAGRAM diagramming and vector drawing software offers the unique Landscape & Garden Solution from the Building Plans area for effective development the modern garden design.
Picture: Modern Garden Design
Related Solution:
For documenting the Cloud Computing Architecture with a goal to facilitate the communication between stakeholders are successfully used the Cloud Computing Architecture diagrams. It is convenient and easy to draw various Cloud Computing Architecture diagrams in ConceptDraw DIAGRAM software with help of tools of the Cloud Computing Diagrams Solution from the Computer and Networks Area of ConceptDraw Solution Park.
Picture: Cloud Computing Architecture Diagrams
Related Solution:
ConceptDraw is a good means of visualization of information of any kind as it features powerful graphic capabilities. The conception of using ConceptDraw and open formats by the programs that work with Internet can be used for displaying any data and any structure in Internet.
Picture: Internet solutions with ConceptDraw DIAGRAM


