Defensive Play Diagram – Under Front
With the strong side guard essentially uncovered, the defensive line has shifted away, or undershifted, from the strength of the offensive line. The strong side defensive tackle plays over the shoulder of the center and the weak side end plays a loose 5-technique outside the tackle, leaving the weak side defensive tackle (our 3-technique/undertackle) isolated against a guard. [Guide to N.F.L. Defenses]
Extending ConceptDraw DIAGRAM software with the Football solution from the ConceptDraw Solution Park you receive a complete set of libraries, templates and samples allowing to draw defensive plays diagrams in seconds. You can start from a template, change positions and get ready diagram in some clicks.
A combination of the "Football Fields" and "Football Positions" libraries gives you an ability to create a football-related drawing in seconds. Follow next steps to create you own football schema:
- From the "Football Fields" library drop a field object to your document
- From the "Football Positions" library drop all positions object you need to your document
- Place positions on the field according to your drawing idea
- Add arrows or text labels if needed.
All drawings, schemas and diagrams created in ConceptDraw DIAGRAM are scalable vector graphics that allows use it for any kind of presentation needs. The popular tool for perfoming presentations in MS PowerPoint. You can easily export your ConceptDraw DIAGRAM document to MS Power point and then present as is, or continue working on presentation using MS PowerPoint tools.

Sample 1. Football – Defensive Play – Under Front.
This diagram was created in ConceptDraw DIAGRAM using the "Football Fields" and "Football Positions" libraries from the Football solution. An experienced user spent 10 minutes creating this sample.
The samples you see on this page were created in ConceptDraw DIAGRAM using the Football Solution; they demonstrate a portion of the solution's capabilities and the professional results you can achieve.
All source documents are vector graphic documents. They are available for reviewing, modifying, or converting to a variety of formats (PDF file, MS PowerPoint, MS Visio, and many other graphic formats) from the ConceptDraw STORE. The Football Solution is available for all ConceptDraw DIAGRAM or later users.
SEVEN RELATED HOW TO's:
Drawing baseball diagrams using ConceptDraw DIAGRAM software extended with the Baseball solution saves your time, and adds more value to your work.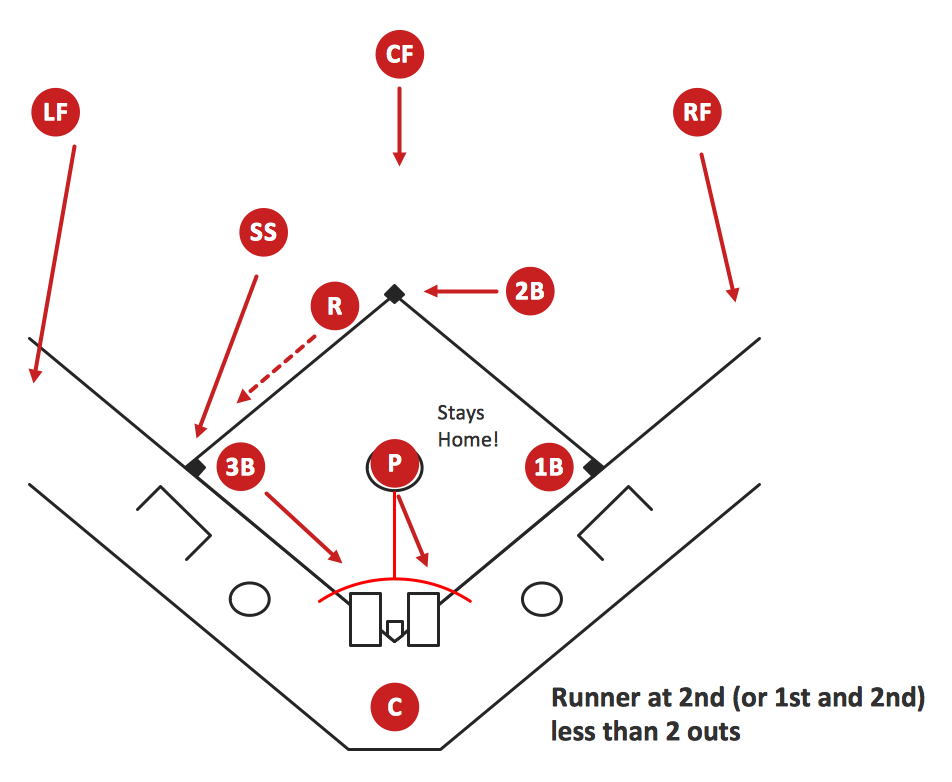
Picture:
Baseball Diagram
Basic Bunt Coverage – Runner at 2nd
Related Solution:
It’s very important that your basketball illustrations looked bright, beautiful, interesting and attracted the attention. For this you just need to add the illustrations! The Basketball solution delivers two libraries with predesigned vector clipart objects. Simply drag the needed clipart to your diagram to make it successful.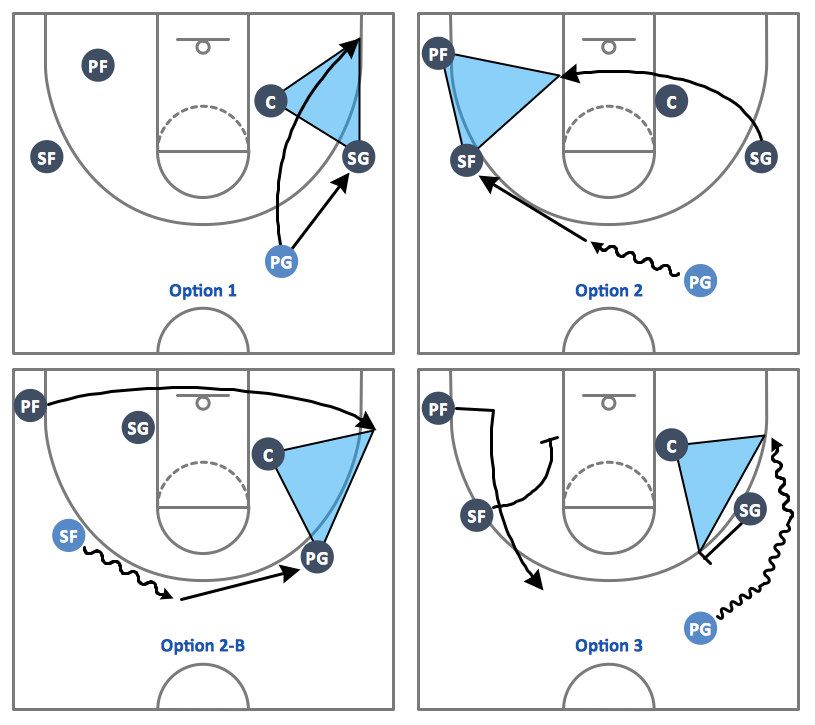
Picture: Basketball Illustrations
Related Solution:
The art of arranging furniture and other decorations in space is called interior design. Some sites, like sport fields have tight restrictions in dimensions, but there's still a lot of work for a designer. You can help yourself to design such a plan with ConceptDraw DIAGRAM solution Sport Field Plans that contains elements of sport equipment and recreation plans.
This drawing represents the set of vector graphic objects that compose the Sport fields and Recreation library, supplied by ConveptDraw Sport Fields Plans solution. It can be used for drawing interior designs and layouts of sport fields and recreation zones. By using ConceptDraw with Sport Field Plans solution you can create professional plans for different sport fields: basketball, volleyball, football, tennis, golf, etc. Moreover, the use of this solutions enables making a site plans including green zone, pools, parkings - in short, what makes the recreation area, that usually accompanies sports facilities.
Picture: Interior Design. Sport Fields — Design Elements
Related Solution:
The Baseball solution for ConceptDraw DIAGRAM contains a set of samples depicts helpful baseball diagrams examples. Using embedded presentation tools you are able to share your baseball knowledge with wide audience.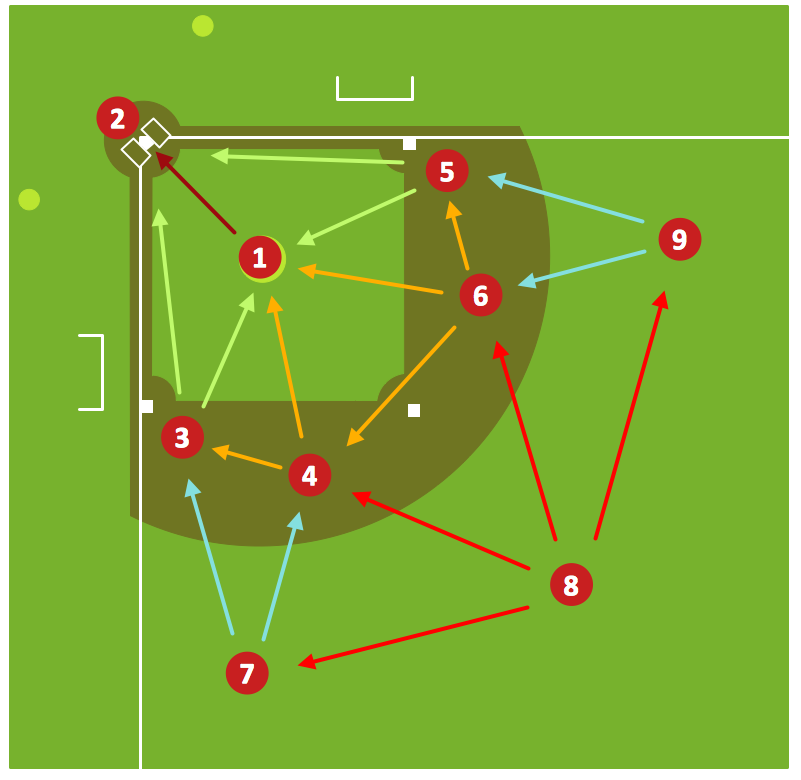
Picture: Baseball Diagram – Defensive Fly Ball
Related Solution:
ConceptDraw DIAGRAM extended with the Baseball solution provides access to libraries, templates and samples allows creating baseball diagrams and schemas.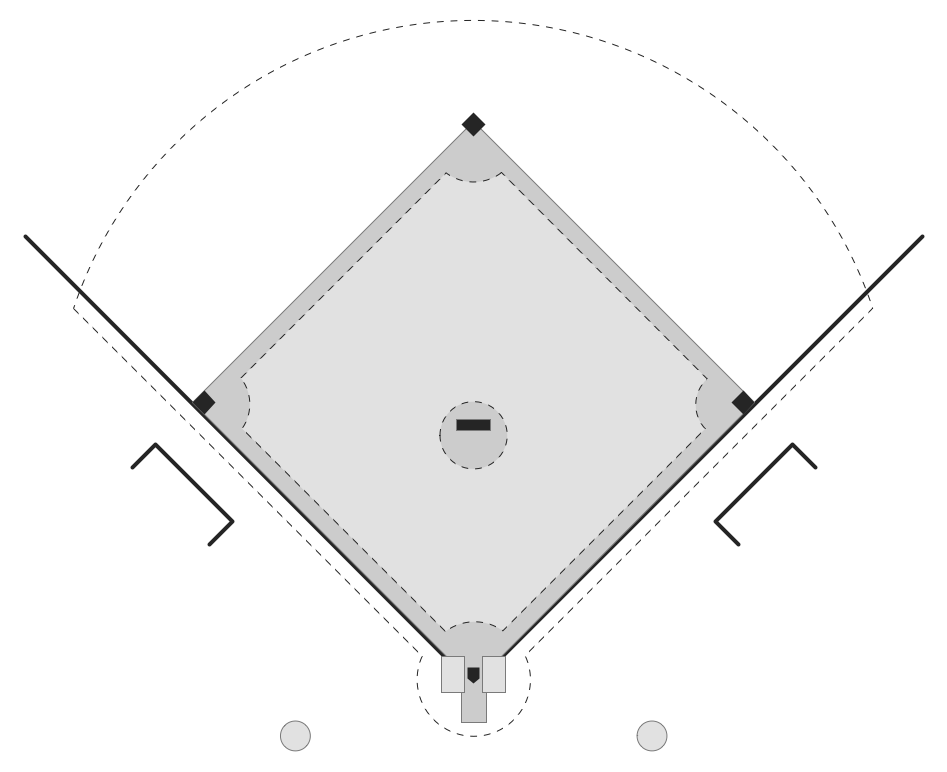
Picture: Baseball Field Template
Related Solution:
Visualizing sports statistics becomes as easy as never before with ConceptDraw DIAGRAM software extended with the Winter Sports solution. This solution delivers a complete set of winter sports illustrations, samples and templates you may use to visualize any kind of sports statistics in minutes.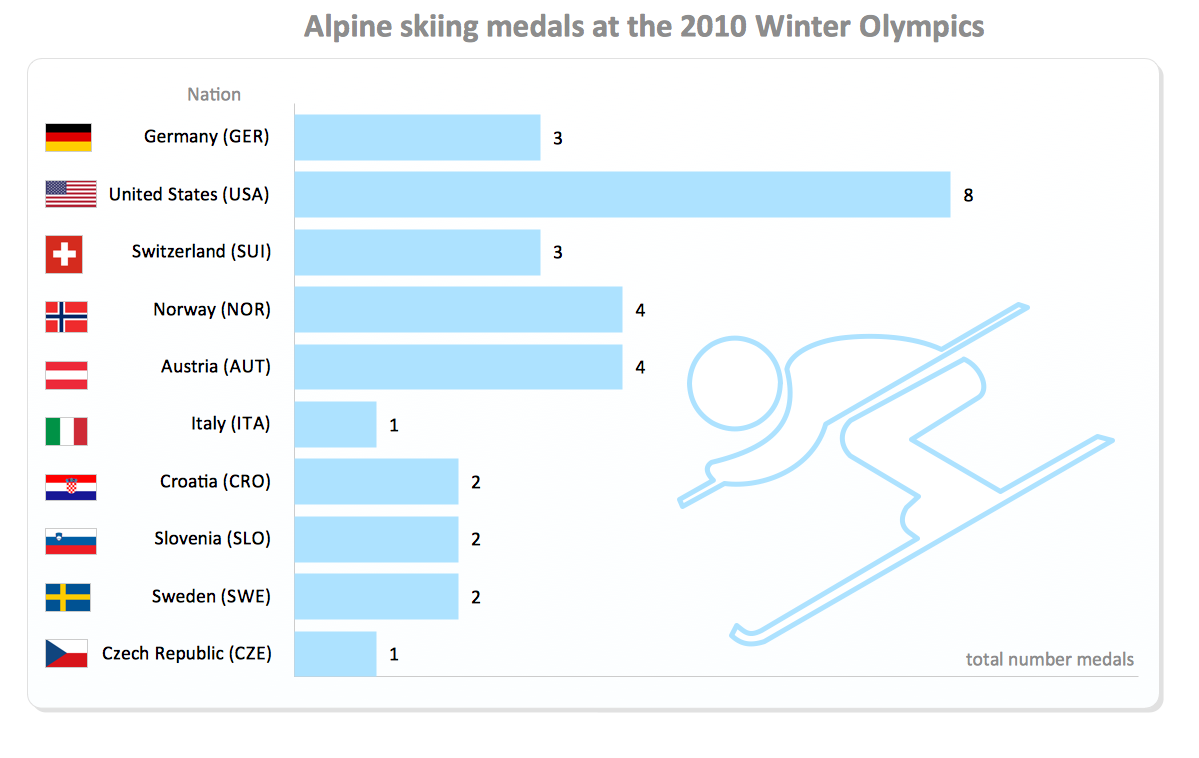
Picture: Winter Sports. Illustrations and Visualize Statistics
Related Solution:
There are many tools to manage a process or to illustrate an algorithm or a workflow. Flowcharting is one of those tools. However, it may be difficult to show complex processes that require multiple attributes or several people in a simple flowchart, so a cross-functional flowchart would be a solution for that situation. To create such flowchart, group processes and steps to labeled rows or columns, and divide those groups with horizontal or vertical parallel lines. It is worth mentioning that there are different types of cross-functional flowcharts, like opportunity or deployment flowchart.
This diagram shows a cross-functional flowchart that was made for a trading process. It contains 14 processes, distributed through 5 lines depicting the participants who interact with the process. Also there are connectors that show the data flow of information between processes. The cross-functional flowchart displays a detailed model of the trading process, as well as all participants in the process and how they interact with each other. The lines in the flowchart indicates the position, department and role of the trading process participants.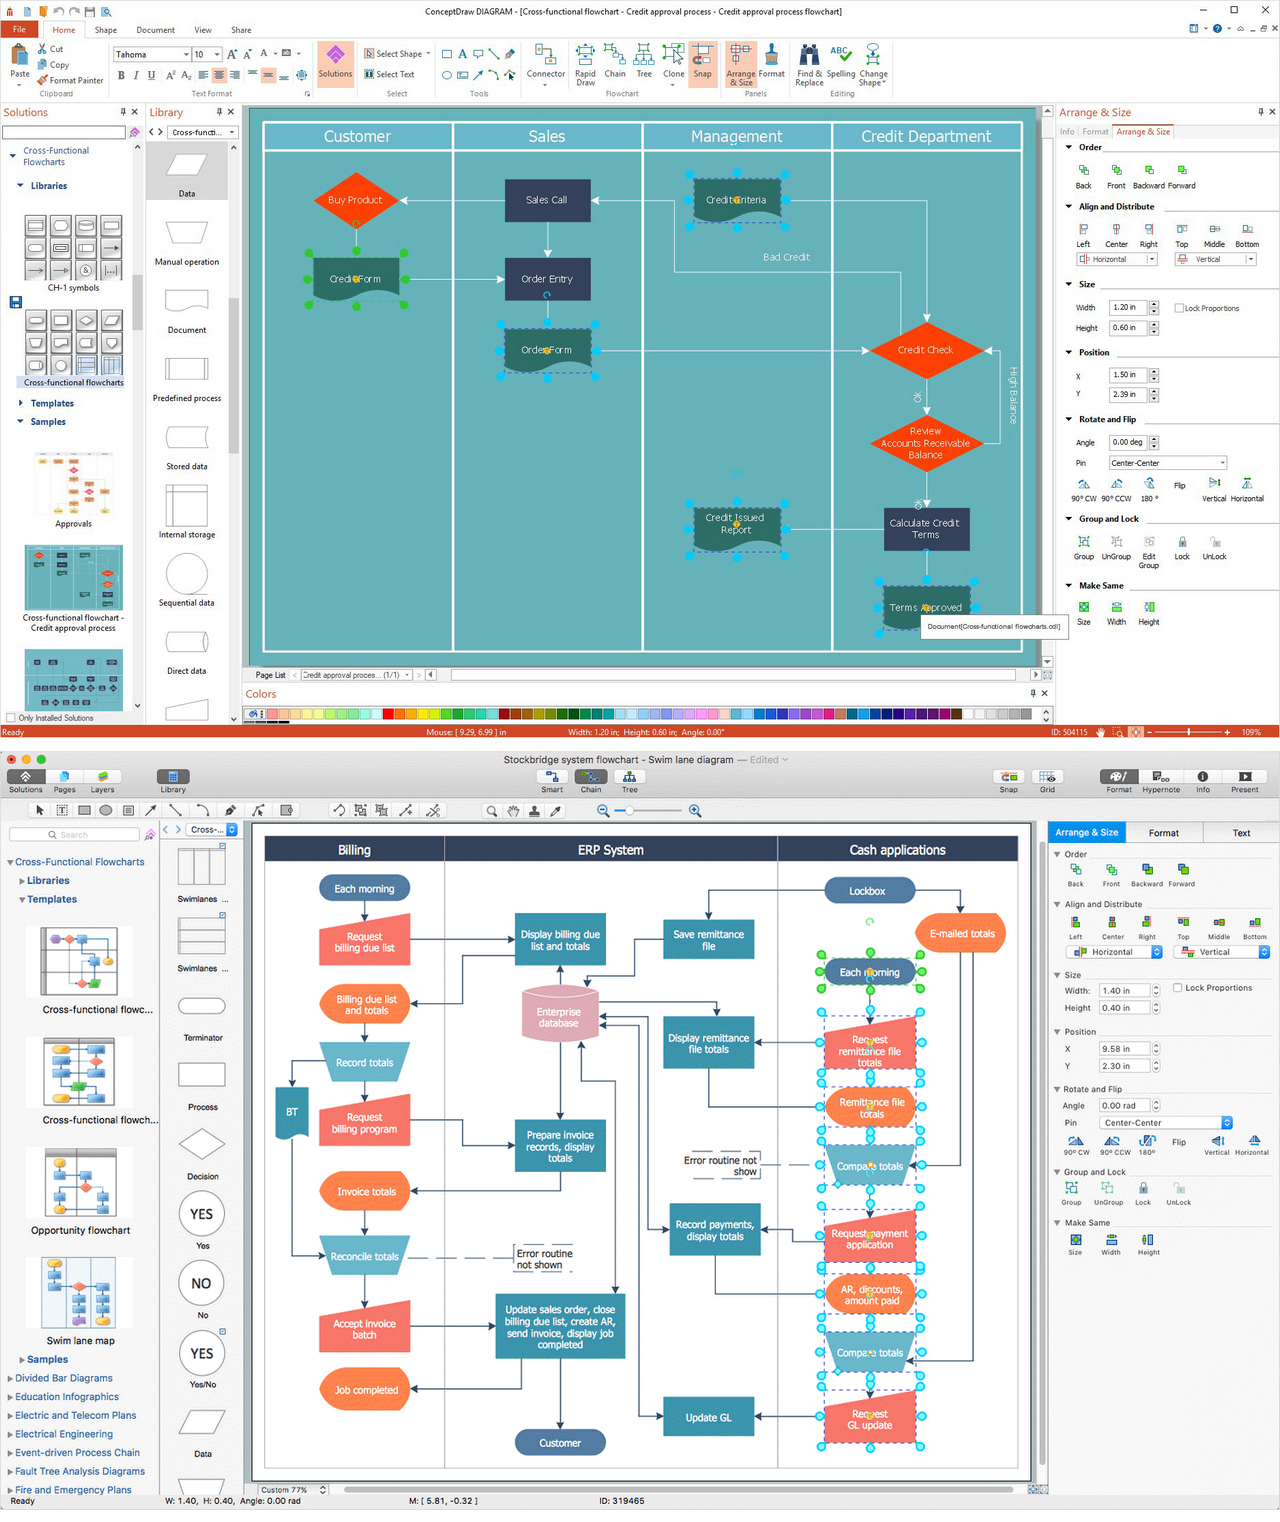
Picture: Cross-Functional Flowchart
Related Solution: