Near field communication (NFC).
Computer and Network Examples
Near field communication (NFC) is a wireless communication technology that allows smartphones and other similar devices to establish the radio communication with each other on the short distance around 10 centimeters (4 inches).
NFC allows to share payloads of data between Android-powered devices or between an NFC tag and an Android-powered device. The Android-powered devices with NFC support the following working modes: reader/writer, P2P and NFC card emulation mode.
NFC standards are based on the radio-frequency identification (RFID) standards (such as ISO/IEC 14443 and FeliCa) and allow the two-way communication between endpoints. They cover the communications protocols and data exchange formats. NFC is used in Google Nexus, Android Beam, S-Beam on the Samsung Galaxy devices.
Computer and Networks Area for ConceptDraw DIAGRAM provides professional looking examples, the libraries with ready-to-use predesigned vector stencils to help you create the Near field communication (NFC) networks quick, easy and effective.
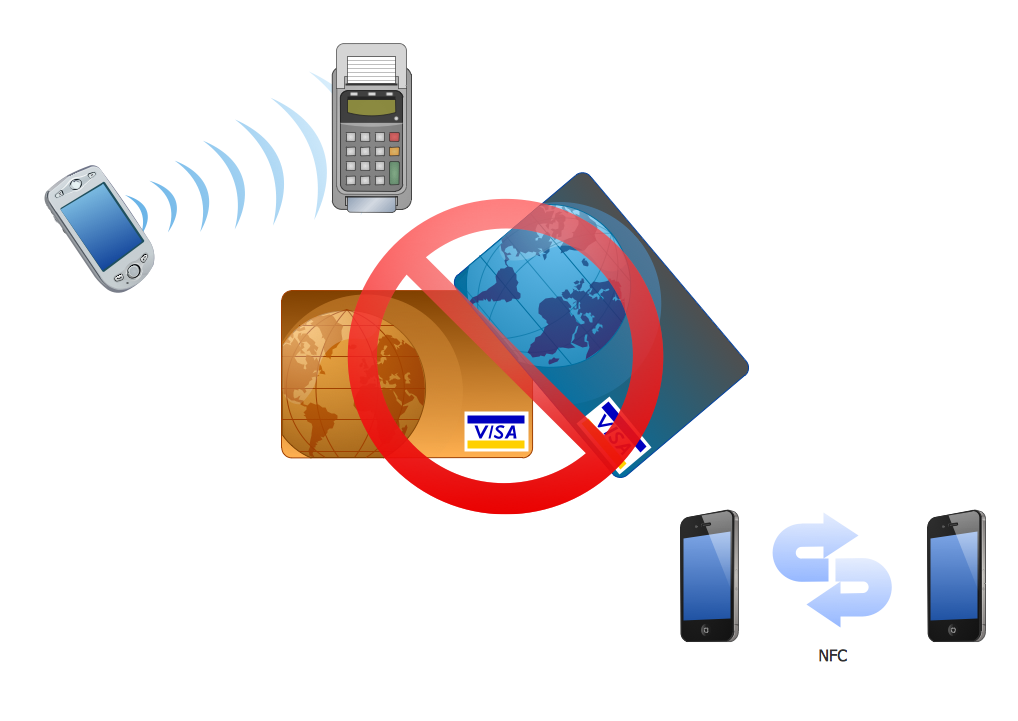
Example 1. Near field communication (NFC). Computer and Network Example
This example was created in ConceptDraw DIAGRAM using the Computer and Networks Area of ConceptDraw Solution Park and shows the Near field communication (NFC) network.
The diagrams designed with ConceptDraw DIAGRAM are vector graphic documents and are available for reviewing, modifying, and converting to a variety of formats (image, HTML, PDF file, MS PowerPoint Presentation, Adobe Flash or MS Visio).
See also Samples:
TEN RELATED HOW TO's:
This sample was created in ConceptDraw DIAGRAM diagramming and vector drawing software using the Computer and Networks solution from Computer and Networks area of ConceptDraw Solution Park.
A Daisy Chain is the simple computer network. It is the easiest way to add more Ethernet devices into the network. In the Daisy Chain network one computer is connected to the next without any intervening devices, thus the message is sent from one computer to the next and then to the next and so on. A Daisy Chain can be linear or ring
Picture: Daisy Chain Network Topology
Related Solution:
A Virtual network is a computer network that consists of virtual network links, i.e. between the computing devices there isn't a physical connection.
Well known forms of network virtualization are virtual networks based on the virtual devices (for example the network based on the virtual devices inside a hypervisor), protocol-based virtual networks (VLAN, VPN, VPLS, Virtual Wireless network, etc.) and their combinations.
This example was created in ConceptDraw DIAGRAM using the Computer and Networks Area of ConceptDraw Solution Park and shows the Virtual network.
Picture: Virtual networks. Computer and Network Examples
Related Solution:
The entity–relationship (ER) model is a data model that lets graphically represent the information system and depict the relationships between people, objects, concepts, places, and events within a given system. It is also convenient to use the ER Diagram for Cloud computing representation and description the Cloud computing architecture, design them with pleasure using the extensive tools of the Cloud Computing Diagrams solution from the Computers and Network area of ConceptDraw Solution Park.
Picture: ER Diagram for Cloud Computing
Related Solution:
There are many ways to track the system in a critical situation. To model a system behavior, uml notation is widely used. Usually, an UML diagram consists of elements such as actor and a case.
This diagram represents the structure of UML notations. Unified Modeling Language (UML) is used in software engineering to depict graphically the software modeling process. UM Language uses graphic notations for developing models of object-oriented systems. These notations displays requirements, sub-systems, logical and physical elements, etc. We created this diagram using ConceptDraw DIAGRAM reinforced with Rapid UML solution. It can be helpful for students on software engineering, when learning UML.
Picture: UML Notation
Related Solution:
ConceptDraw DIAGRAM diagramming and vector drawing software is a powerful network mapper thanks to the extensive drawing tools of Network Layout Floor Plans Solution from the Computer and Networks Area.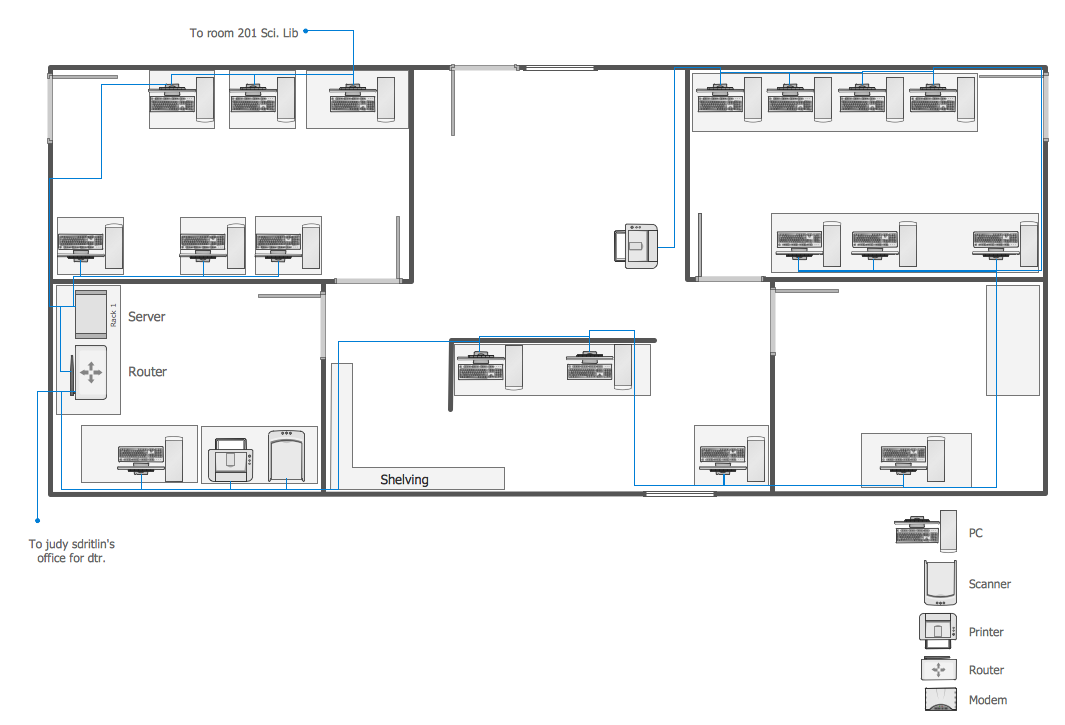
Picture: Network Mapper
Related Solution:
3D Network Diagrams are very popular diagrams in the field of network technologies. They have more visual, clear, attractive and understandable look than 2D. ConceptDraw DIAGRAM gives the opportunity to draw the professional looking 3D Network Diagrams easy, quick and effective.
This example shows the 3D Network Diagram. It was created in ConceptDraw DIAGRAM using the 3D network elements from the Computer and Networks solution from the Computer and Networks area of ConceptDraw Solution Park.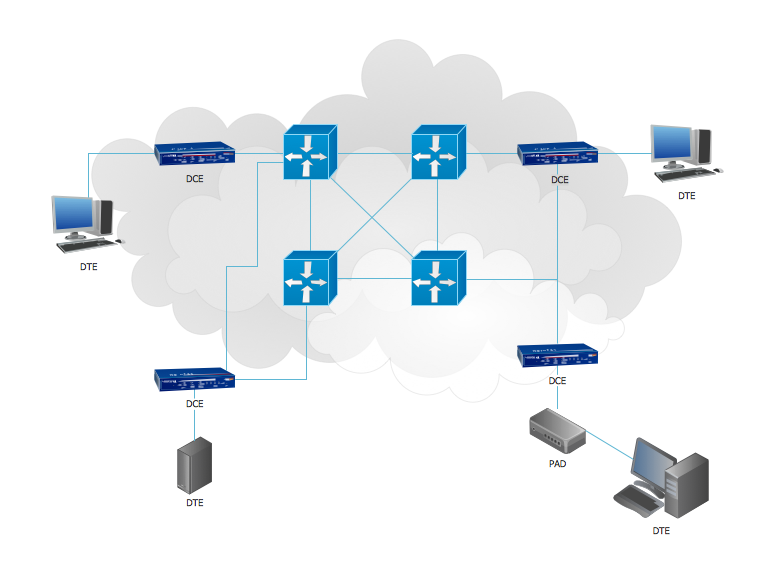
Picture: 3D Network Diagrams. Computer and Network Examples
Related Solution:
A power station is an industrial facility for the generation of electric power. Most power stations contain one or more generators, a rotating machine that converts mechanical power into electrical power. The relative motion between a magnetic field and a conductor creates an electrical current. The energy source harnessed to turn the generator varies widely. Most power stations in the world burn fossil fuels such as coal, oil, and natural gas to generate electricity. Others use nuclear power, but there is an increasing use of cleaner renewable sources such as solar, wind, wave and hydroelectric.
26 libraries of the Electrical Engineering Solution of ConceptDraw DIAGRAM make your electrical diagramming simple, efficient, and effective. You can simply and quickly drop the ready-to-use objects from libraries into your document to create the electrical diagram.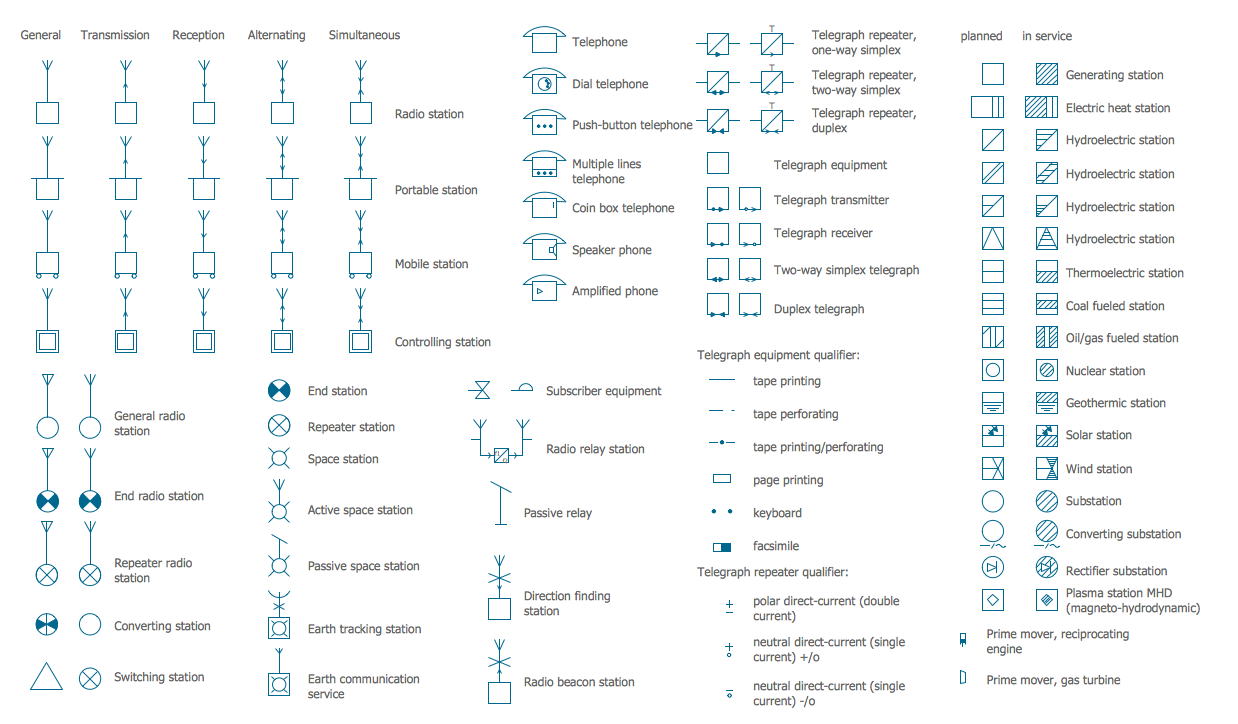
Picture: Electrical Symbols — Stations
Related Solution:
When we start to speak about databases, we must always mention database structure visualization. One of the most common ways to do it is to create an entity relationship diagram, and to put appropriate symbols on it. It is important either for database projecting and for its' future maintenance.
Entity Relationship Diagram describes data elements and their relationships within a database. There are a set of special symbols that depict each element of an entity relationship diagram. Entities - represents some stable components such as supplier, employee, invoice, client, etc. Relation symbols show how the entities interact. Attributes define characteristics of the relationships. Attributes can be one-to-one or many-to-many. Physical symbols is used in the physical models. They represent items such as fields, tables, types and keys. ERD physical symbols are the building material for the database. Notation lines are used to illustrate the relationships. The most common method is Crow’s Feet notation. You can use ConceptDraw Entity-Relationship Diagram (ERD) solution to represent a database using the Entity-Relationship model.
Picture: Entity Relationship Diagram Symbols
Related Solution:
When thinking about data visualization, one of the first tools that comes to mind is a flowchart design. You can find flowchart symbols, shapes, stencils and icons easily on the Internet, but it might take time to systematize this information. Nevertheless, once you start flowcharting, you’ll love its simplicity and efficiency.
This diagram consists from standard flowchart symbols, approved by ANSI (American National Standard Institute) for drawing flowcharts. A flowchart is a diagram that represents a step-by-step algorithm of any process, displaying the process stages as boxes that are connected with arrows. Flowchart design makes it clear and readable.
Flowchart designed using ConceptDraw DIAGRAM flowchart software allows to make attractive and clear process presentation, it makes interpretation of the business process flow fresh and versatile. Great flowchart design view is a big advantage over the diagram created manually on a paper.
Picture: Flowchart Design: Principles, Layout, Symbols and Best Practices
Related Solution:
There are many ways to describe a database structure. One of the most usual is to draw an entity relationship diagram (ERD) using a Crow’s Foot notation to represent database elements. If you don’t want to draw it on paper, you should use an appropriate software.
An entity-relationship (ER) diagram is used to show the structure of a business database. ERD represents data as objects (entities) that are connected with standard relationships symbols which Illustrate an association between entities. ERD, there is a wide range of ERD notations used by data bases architects for reflecting the relationships between the data entities. According to the crow’s foot notation relationships are drawn as single labeled lines designating a certain kinds of relationship. Crow foot notation is a most frequently used ERD standard, because of improved readability of diagrams, with a more accurate use of space on the page._Win_Mac.png)
Picture: Entity Relationship Diagram - ERD - Software for Design Crows Foot ER Diagrams
Related Solution: