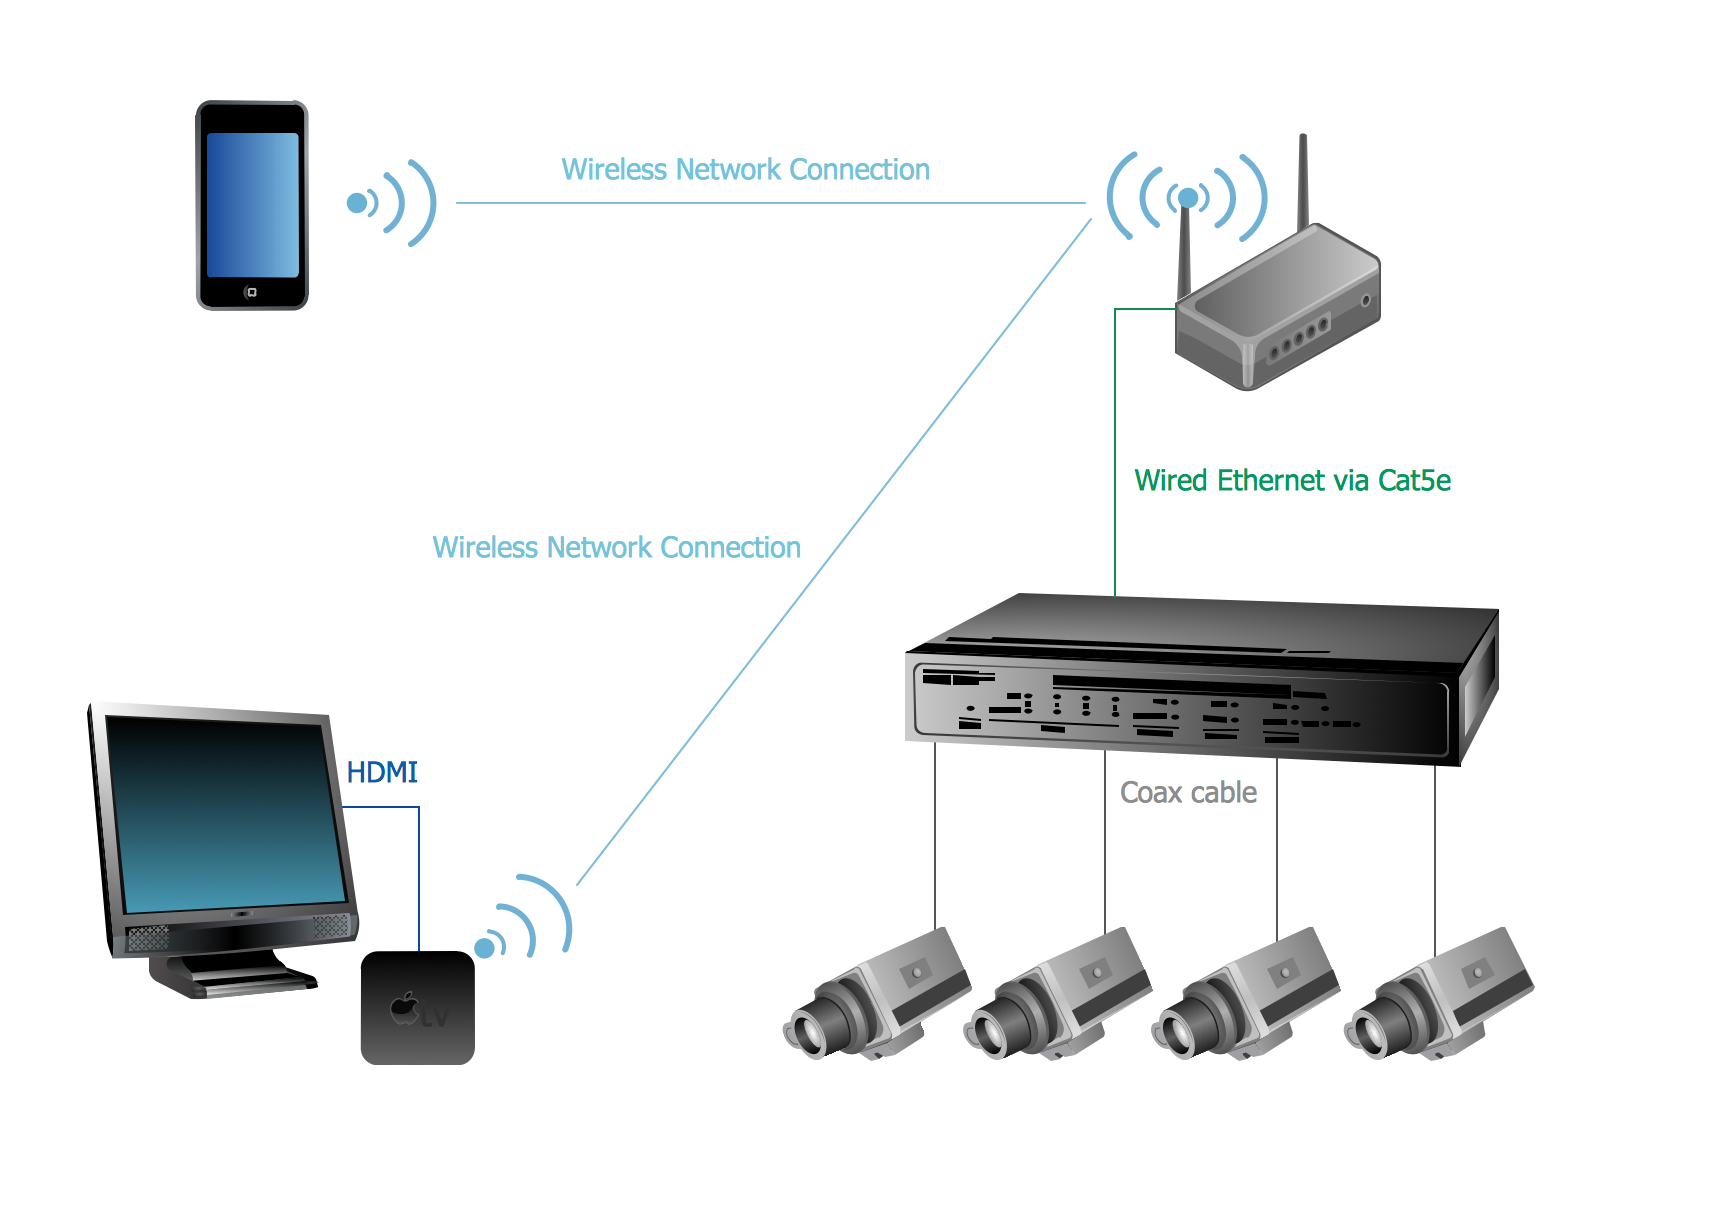
Sample 1. Apple TV Airplay CCTV Camera Network Diagram
This CCTV Network Diagram was created in ConceptDraw DIAGRAM diagramming software using the Audio, Video, Media solution from ConceptDraw Solution Park. This diagram illustrates the scheme of the connecting the Apple TV via Airplay to the video surveillance system.
Use the Audio, Video, Media Solution for ConceptDraw DIAGRAM to create your own professional looking CCTV Network Diagrams quick and easy.
See also Samples:
TEN RELATED HOW TO's:
No need for any special drawing skills to create professional looking diagrams outside of your knowledge base. ConceptDraw DIAGRAM takes care of the technical details, allowing you to focus on your job, not the drawing.
ConceptDraw DIAGRAM delivers full-functioned alternative to MS Visio. ConceptDraw DIAGRAM supports import of Visio files. ConceptDraw DIAGRAM supports flowcharting, swimlane, orgchart, project chart, mind map, decision tree, cause and effect, charts and graphs, and many other diagram types.
Picture: MS Visio Look a Like Diagrams
A circuit diagram is sometimes also called an elementary diagram, electronic schematic or electrical diagram circuits. It is essential in construction of any electronic equipment. Among many digital drawing tools available, ConceptDraw DIAGRAM is a leading circuits and logic diagram software, affording for easy and quick creation of even the most advanced and complex diagram designs. This makes it a perfect choice for computer science and any kind of electronic engineering.
This drawing includes the graphic symbols that may be in use while creating a logic circuit diagram. The diagrams of such kind are used in the electronics industry. The logic symbol depicts a device that realizes a Boolean type functions. Practically a logic symbol means transistor, diodes, relays, and other mechanical or optical details which provide function of closing or opening "gates". Totally the logic circuits can involve millions of gates. ConceptDraw Electrical Engineering solution gives the opportunity to create a circuit diagrams both simple and difficult.
Picture: Circuits and Logic Diagram Software
Related Solution:
Cisco switches and hubs deliver the best performance, and often used as network solutions for small businesses, enterprises, data centers. Cisco switches are the core interconnect devices of each computer network. The numerous Cisco switches specifically designed for various applications. Network switches are separated for two types: fixed configuration and modular switches. The fixed configuration switches deprecate swapping or adding another module, and vice versa for modular switch.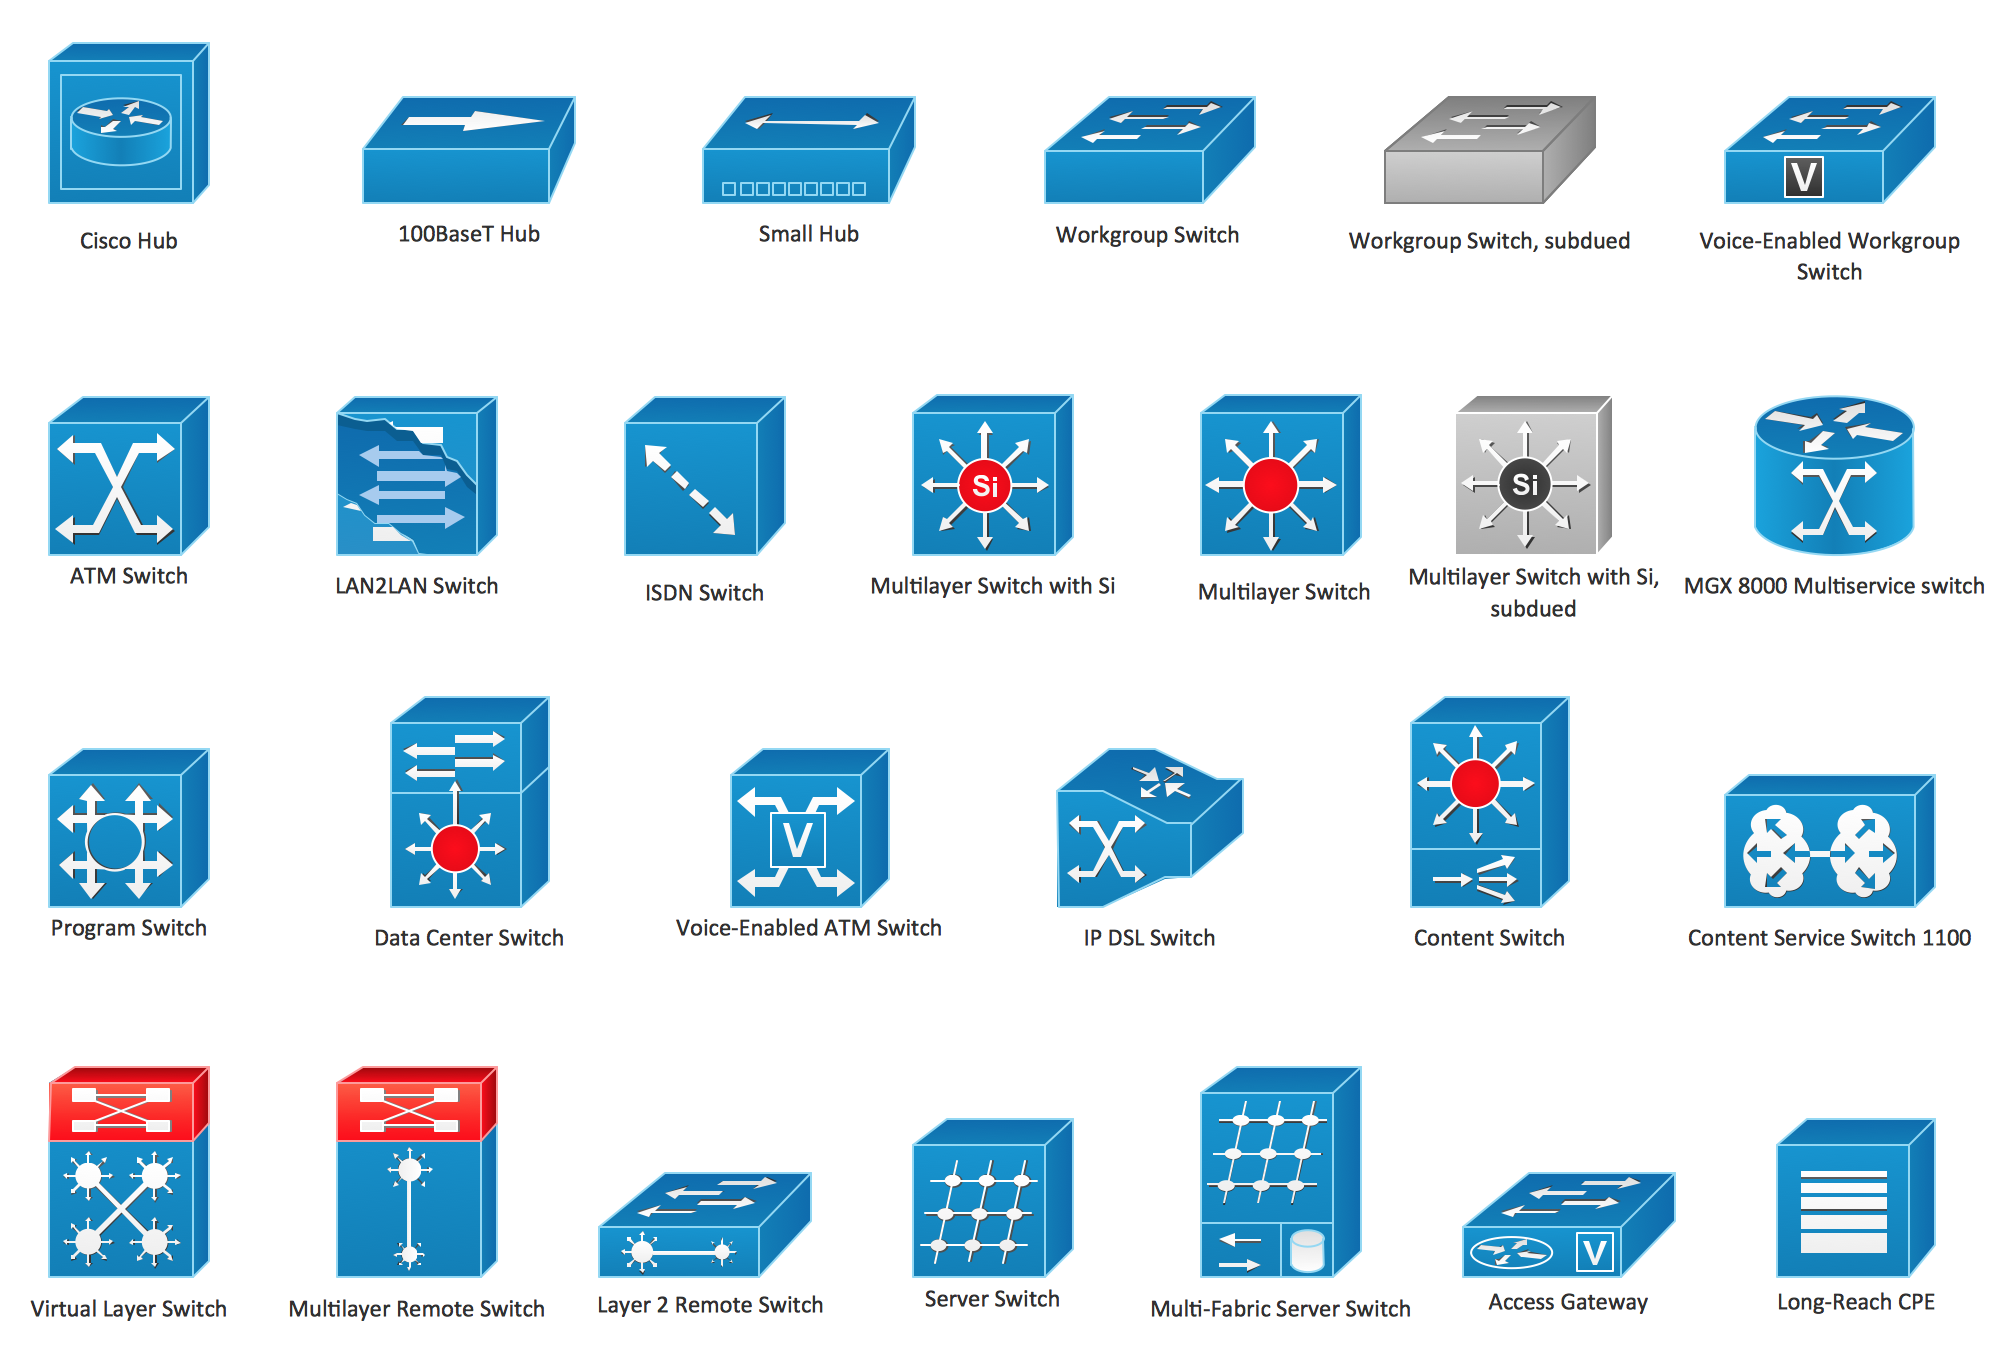
Picture: Cisco Switches and Hubs. Cisco icons, shapes, stencils and symbols
Related Solution:
Have you ever created the fire plans on the base of Fire Evacuation Plan Template? It's incredibly convenient and time-saving way. Let's try to make sure this with Fire and Emergency Plans solution for ConceptDraw DIAGRAM software.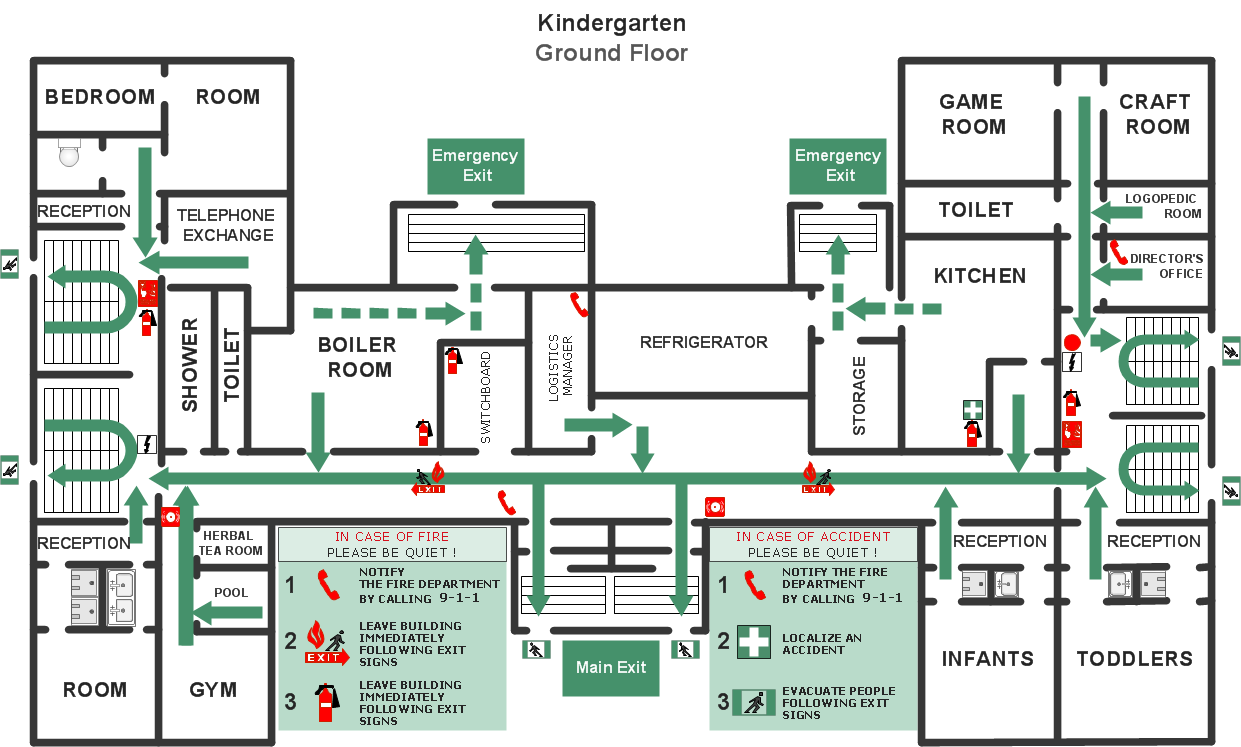
Picture: Fire Evacuation Plan Template
Related Solution:
This sample was created in ConceptDraw DIAGRAM diagramming and vector drawing software using the Computer and Networks solution from Computer and Networks area of ConceptDraw Solution Park.
A Daisy Chain is the simple computer network. It is the easiest way to add more Ethernet devices into the network. In the Daisy Chain network one computer is connected to the next without any intervening devices, thus the message is sent from one computer to the next and then to the next and so on. A Daisy Chain can be linear or ring
Picture: Daisy Chain Network Topology
Related Solution:
The CCTV is the process that carried out using the video cameras for transmitting the signal to the specific location, on the limited set of monitors. We are talking about the video cameras that are used for monitoring on such guarded objects as airports, banks, stores, military objects, etc. CCTV equipment is also used in the industrial installations, for surveillance in the public places, for recording the video on the digital video recorders.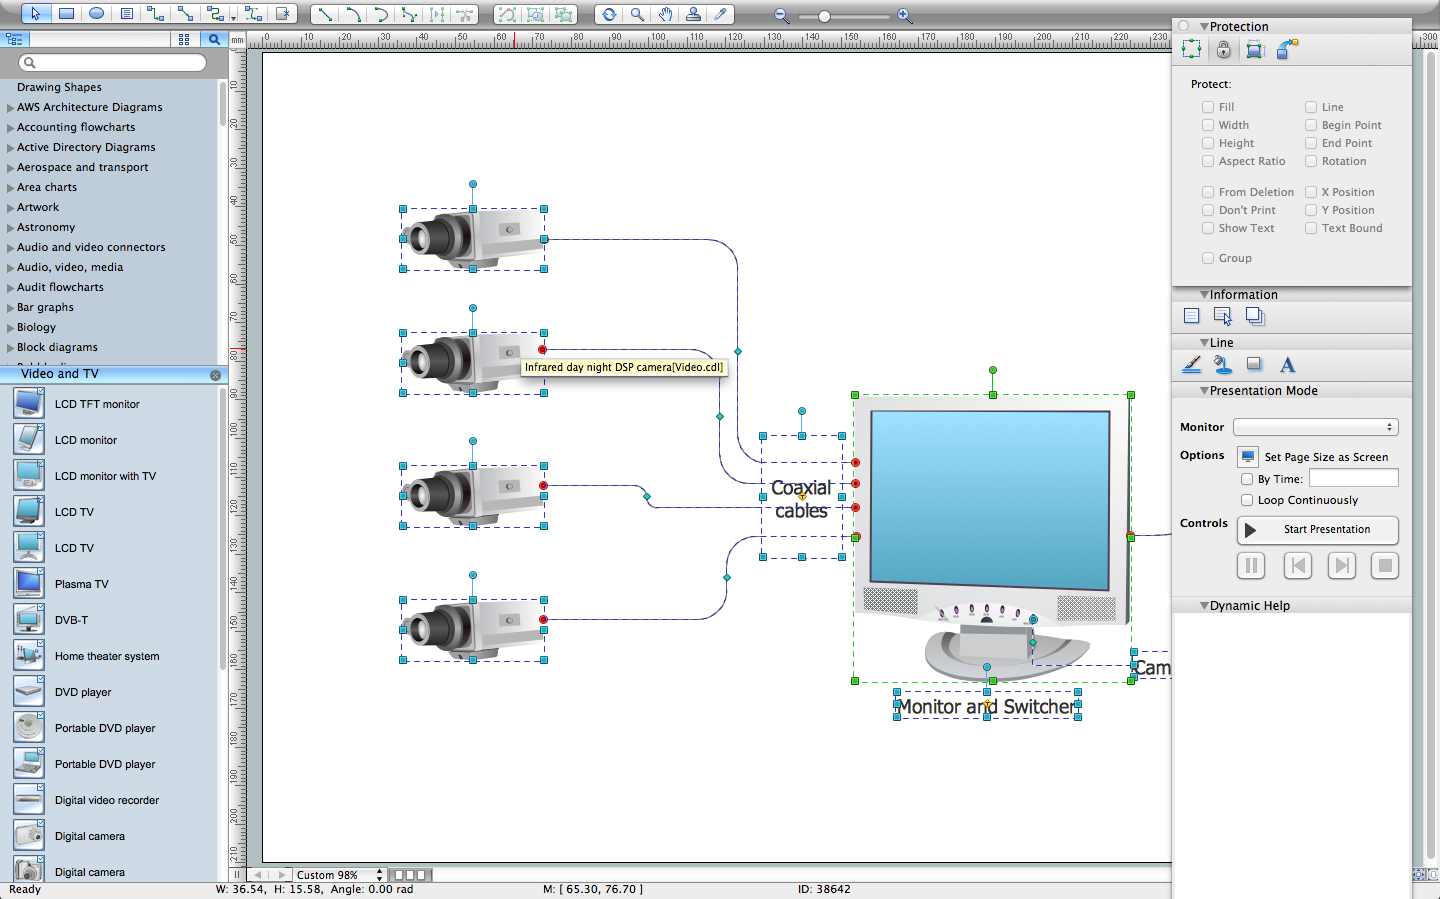
Picture: CCTV Network Diagram Software
Related Solutions:
Closed-circuit television (CCTV) uses cameras and monitors to carry out video surveillance. Unlike broadcast television this system has only local signal. It is a feature of almost every video camera, yet CCTV is mainly a system for visual control of certain areas such as banks, airports, supermarkets, and other places for security reasons.
Developing and installing CCTV system is a time-consuming process. It also requires certain knowledge and skills. ConceptDraw is a solution of setting video cameras rationally. You can achieve two aims at once: CCTV Design Tool saves your time and your money and helps you make professional video surveillance system.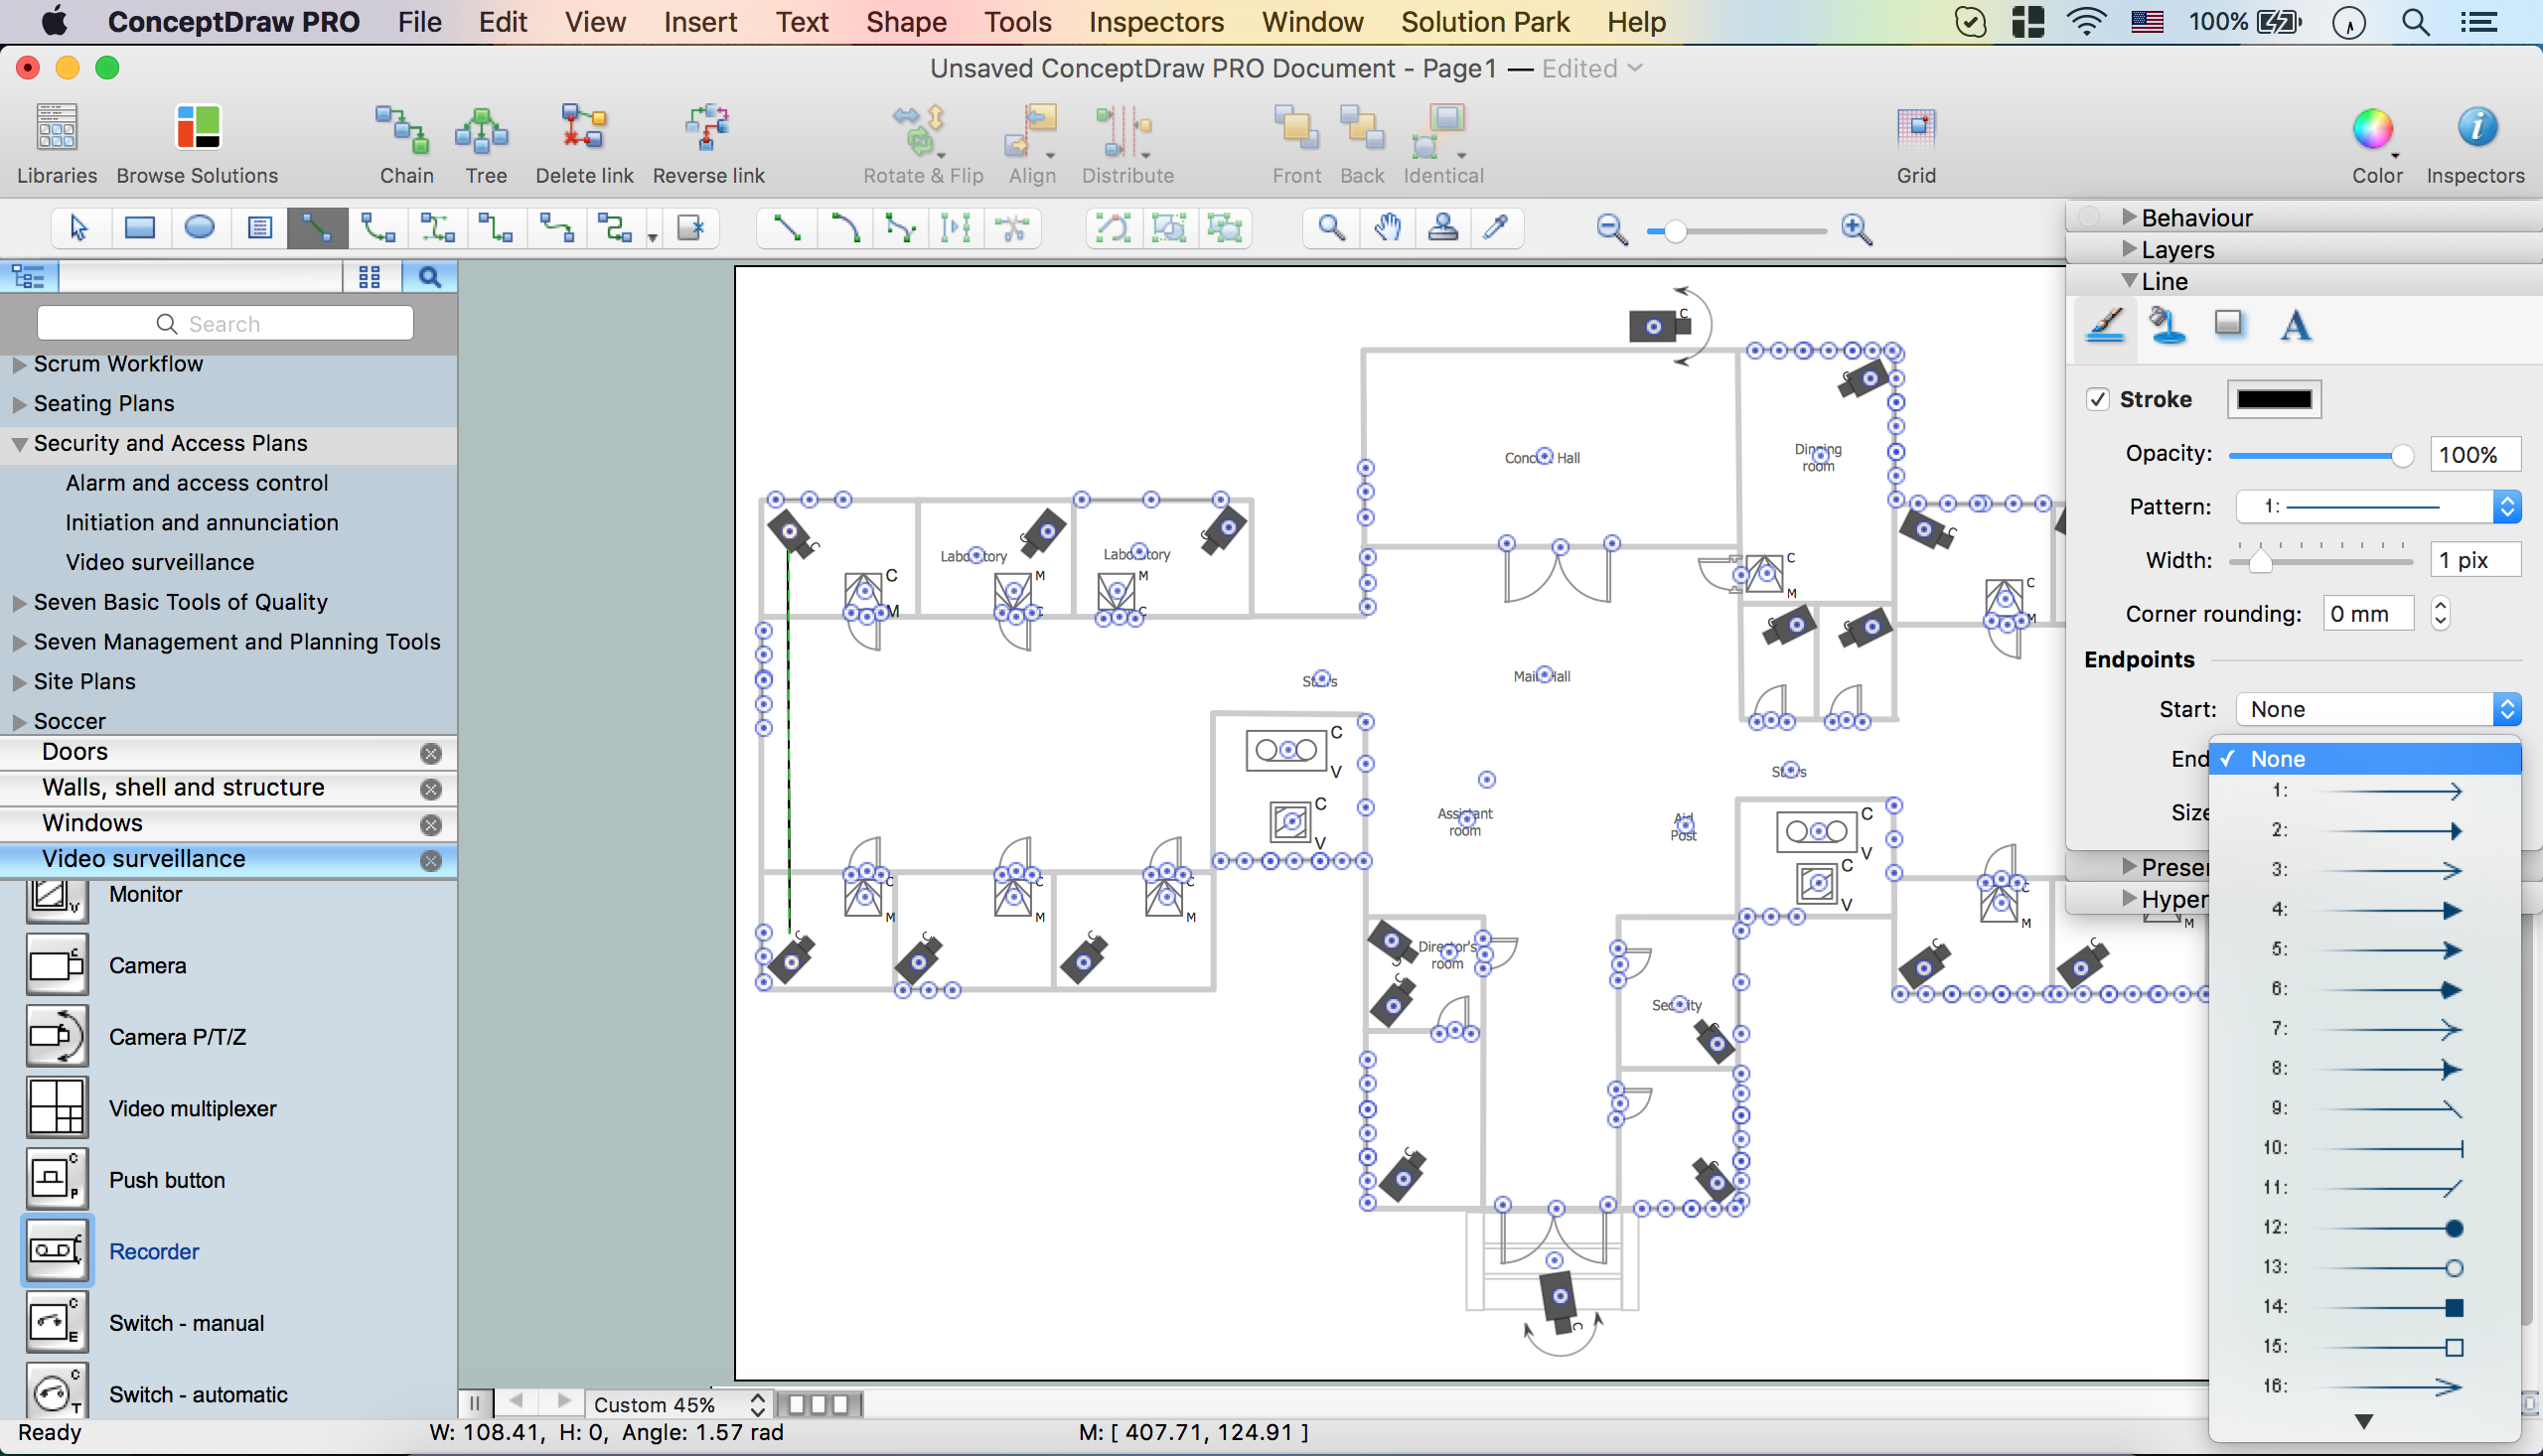
Picture: How To Create CCTV Network Diagram
Related Solutions:
Creating CCTV system diagrams is quick and easy with ConceptDraw DIAGRAM diagramming software enhanced with Audio, Video, Media solution from ConceptDraw Solution Park. It contains library of vector cliparts of video and TV devices and different digital gadgets for drawing this kind of diagrams.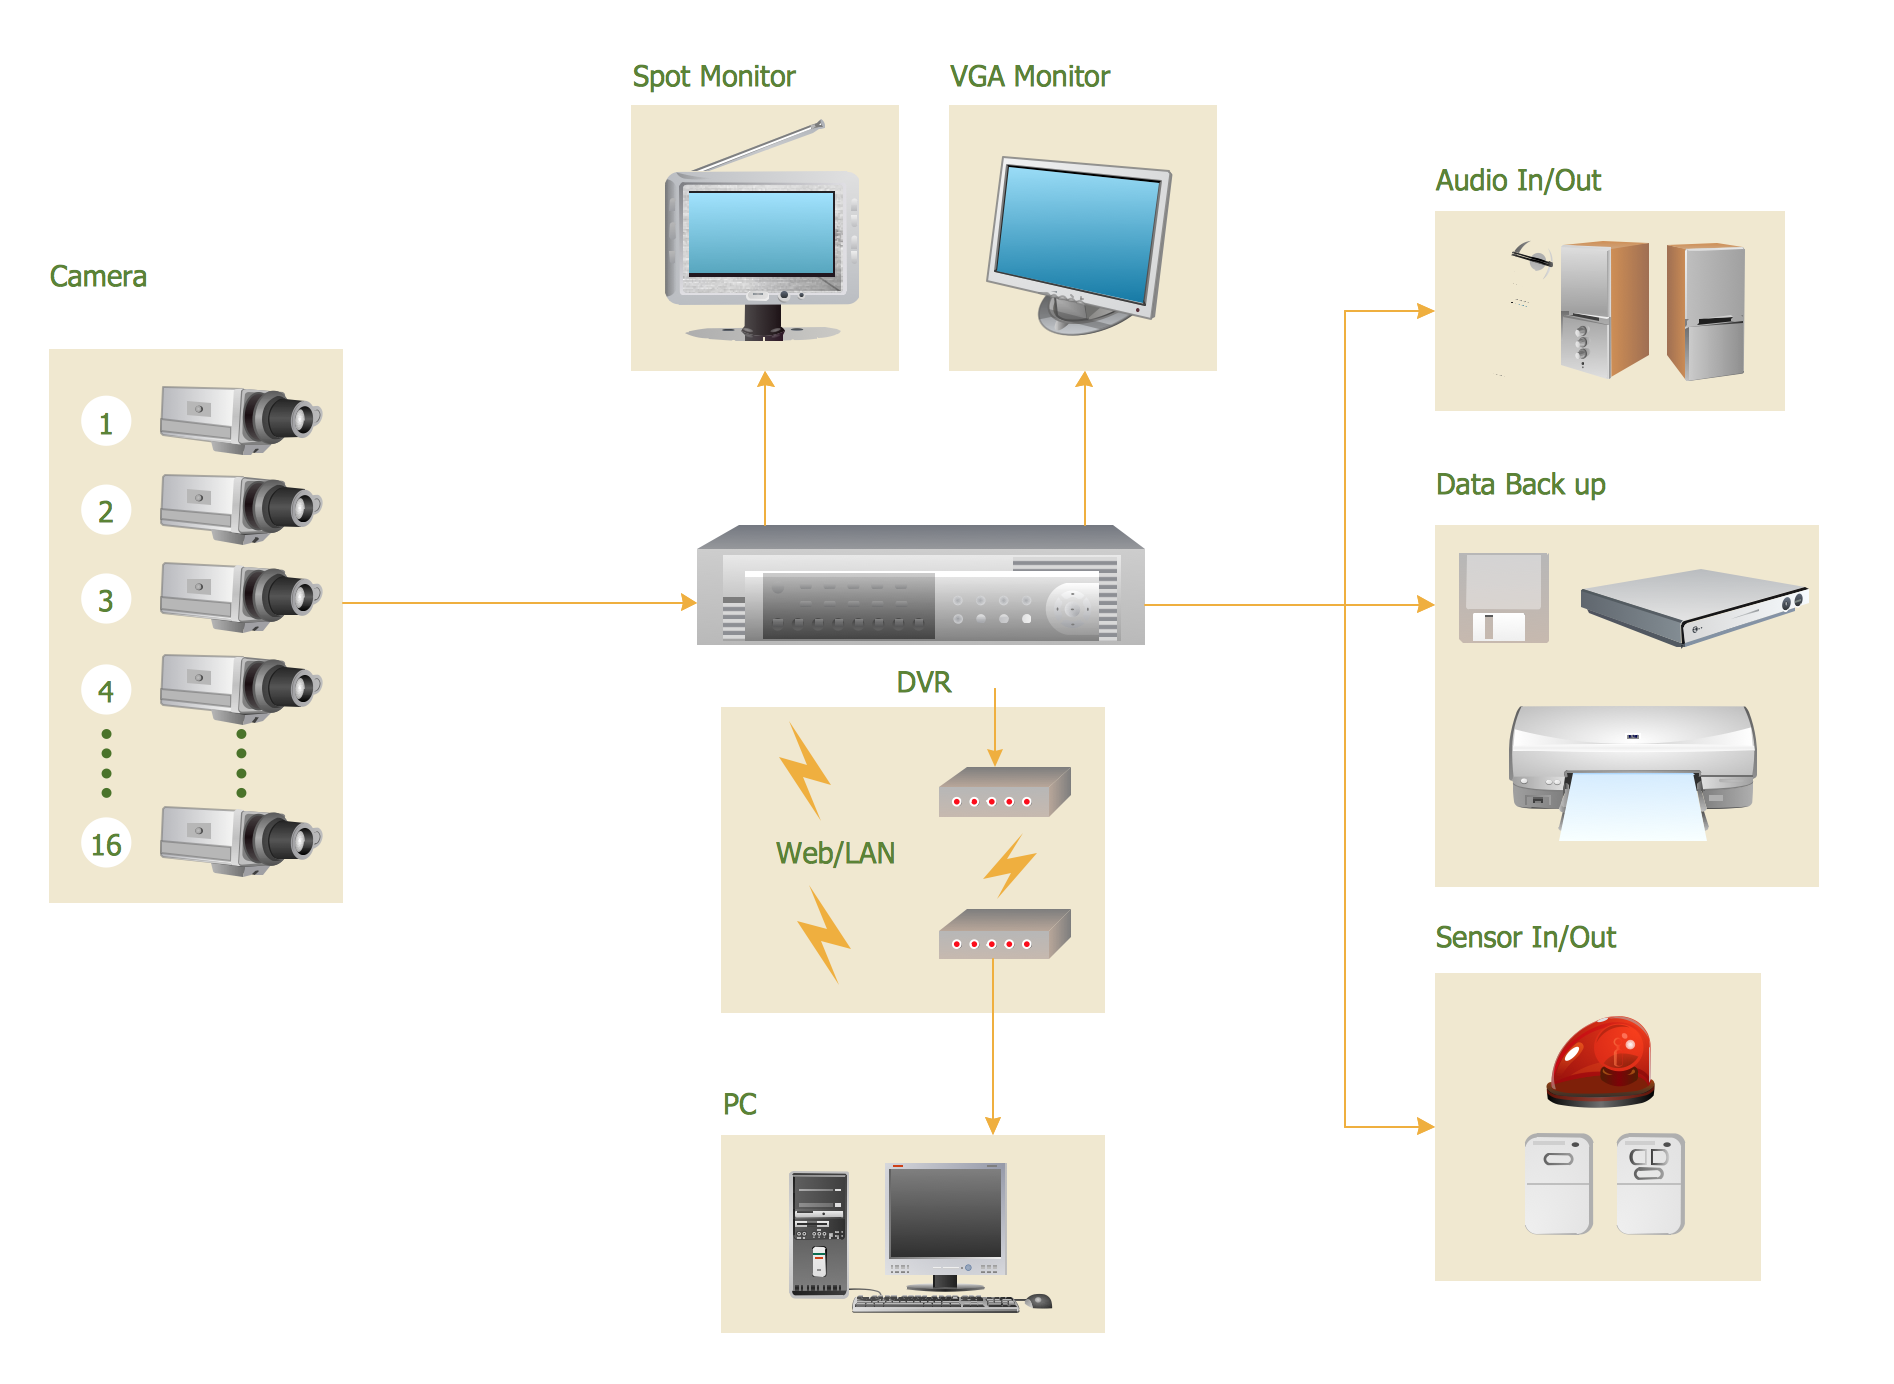
Picture: CCTV Surveillance System Diagram. CCTV Network Diagram Example
Related Solutions:
Electrical plan is a document that is developed during the first stage of the building design. This scheme is composed of conventional images or symbols of components that operate by means of electric energy. To simplify the creation of these schemes you can use house electrical plan software, which will not require a long additional training to understand how to use it. You only need to install the necessary software ant it’s libraries and you’ll have one less problem during the building projection.
Any building contains a number of electrical systems, including switches, fixtures, outlets and other lightening equipment. All these should be depicted in a building electrical plans and included to general building documentation. This home electrical plan displays electrical and telecommunication devices placed to a home floor plan. On the plan, each electrical device is referenced with the proper symbol. Electrical symbols are used for universal recognition of the building plan by different persons who will be working on the construction. Not all possible electric symbols used on a certain plan, so the symbols used in the current home plan are included to a legend. The electrical home plan may be added as a separate document to a complete set of building plans.
Picture: How To use House Electrical Plan Software
Related Solution:
Use it to make professional looking documents, presentations, and websites illustrated with color scalable vector clipart for geography, weather, and animals.
Picture: Clipart School Example
Related Solution:
 A Four Camera Line Powered CCTV System
 CCTV camera block diagram
 CCTV Surveillance System Diagram
 Home CCTV system
 Wireless camera systems