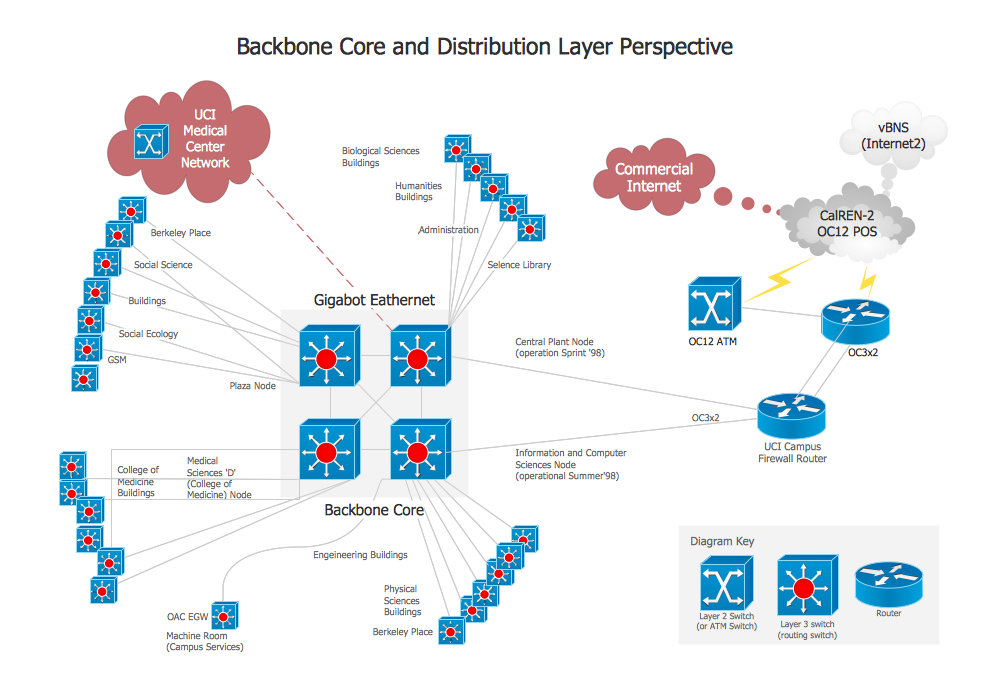
Pic.1. Backbone network diagram.
This backbone network diagram sample is created using ConceptDraw DIAGRAM diagramming and vector drawing software enhanced with Computer & Networks solution from ConceptDraw Solution Park.
Computer & Networks solution provides samples, templates and libraries of symbols for all types of computer network diagrams, LAN and WAN floor plan layouts, network communication plans, Cisco network diagrams, Active Directory diagrams, logical and physical network diagrams, network architecture and topology diagrams.
NINE RELATED HOW TO's:
This sample was created in ConceptDraw DIAGRAM diagramming and vector drawing software using the Flowcharts solution from the Diagrams area of ConceptDraw Solution Park.
This sample shows the Flowchart that displays the procedures of 2PP (two-party preferred) voting and counting the voters. The two-party-preferred vote is the result of the elections that was distributed to the final two parties.
Picture: Basic Flowchart Images. Flowchart Examples
Related Solution:
The network architecture and design specialization will help you gain the technical leadership skills you need to design and implement high-quality networks that support business needs.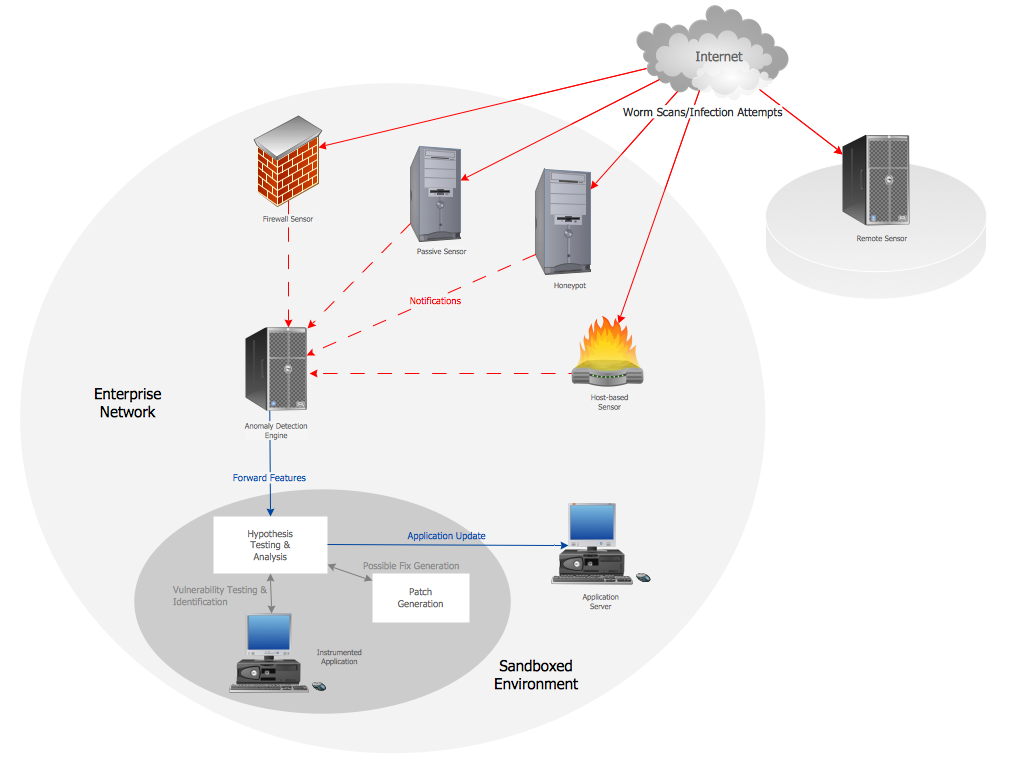
Picture: Computer Network Architecture. Computer and Network Examples
Networking and Content Delivery icons - Amazon AWS pro diagrams - AWS diagrams are part of architecturing tools provided with ConceptDraw Solution Park.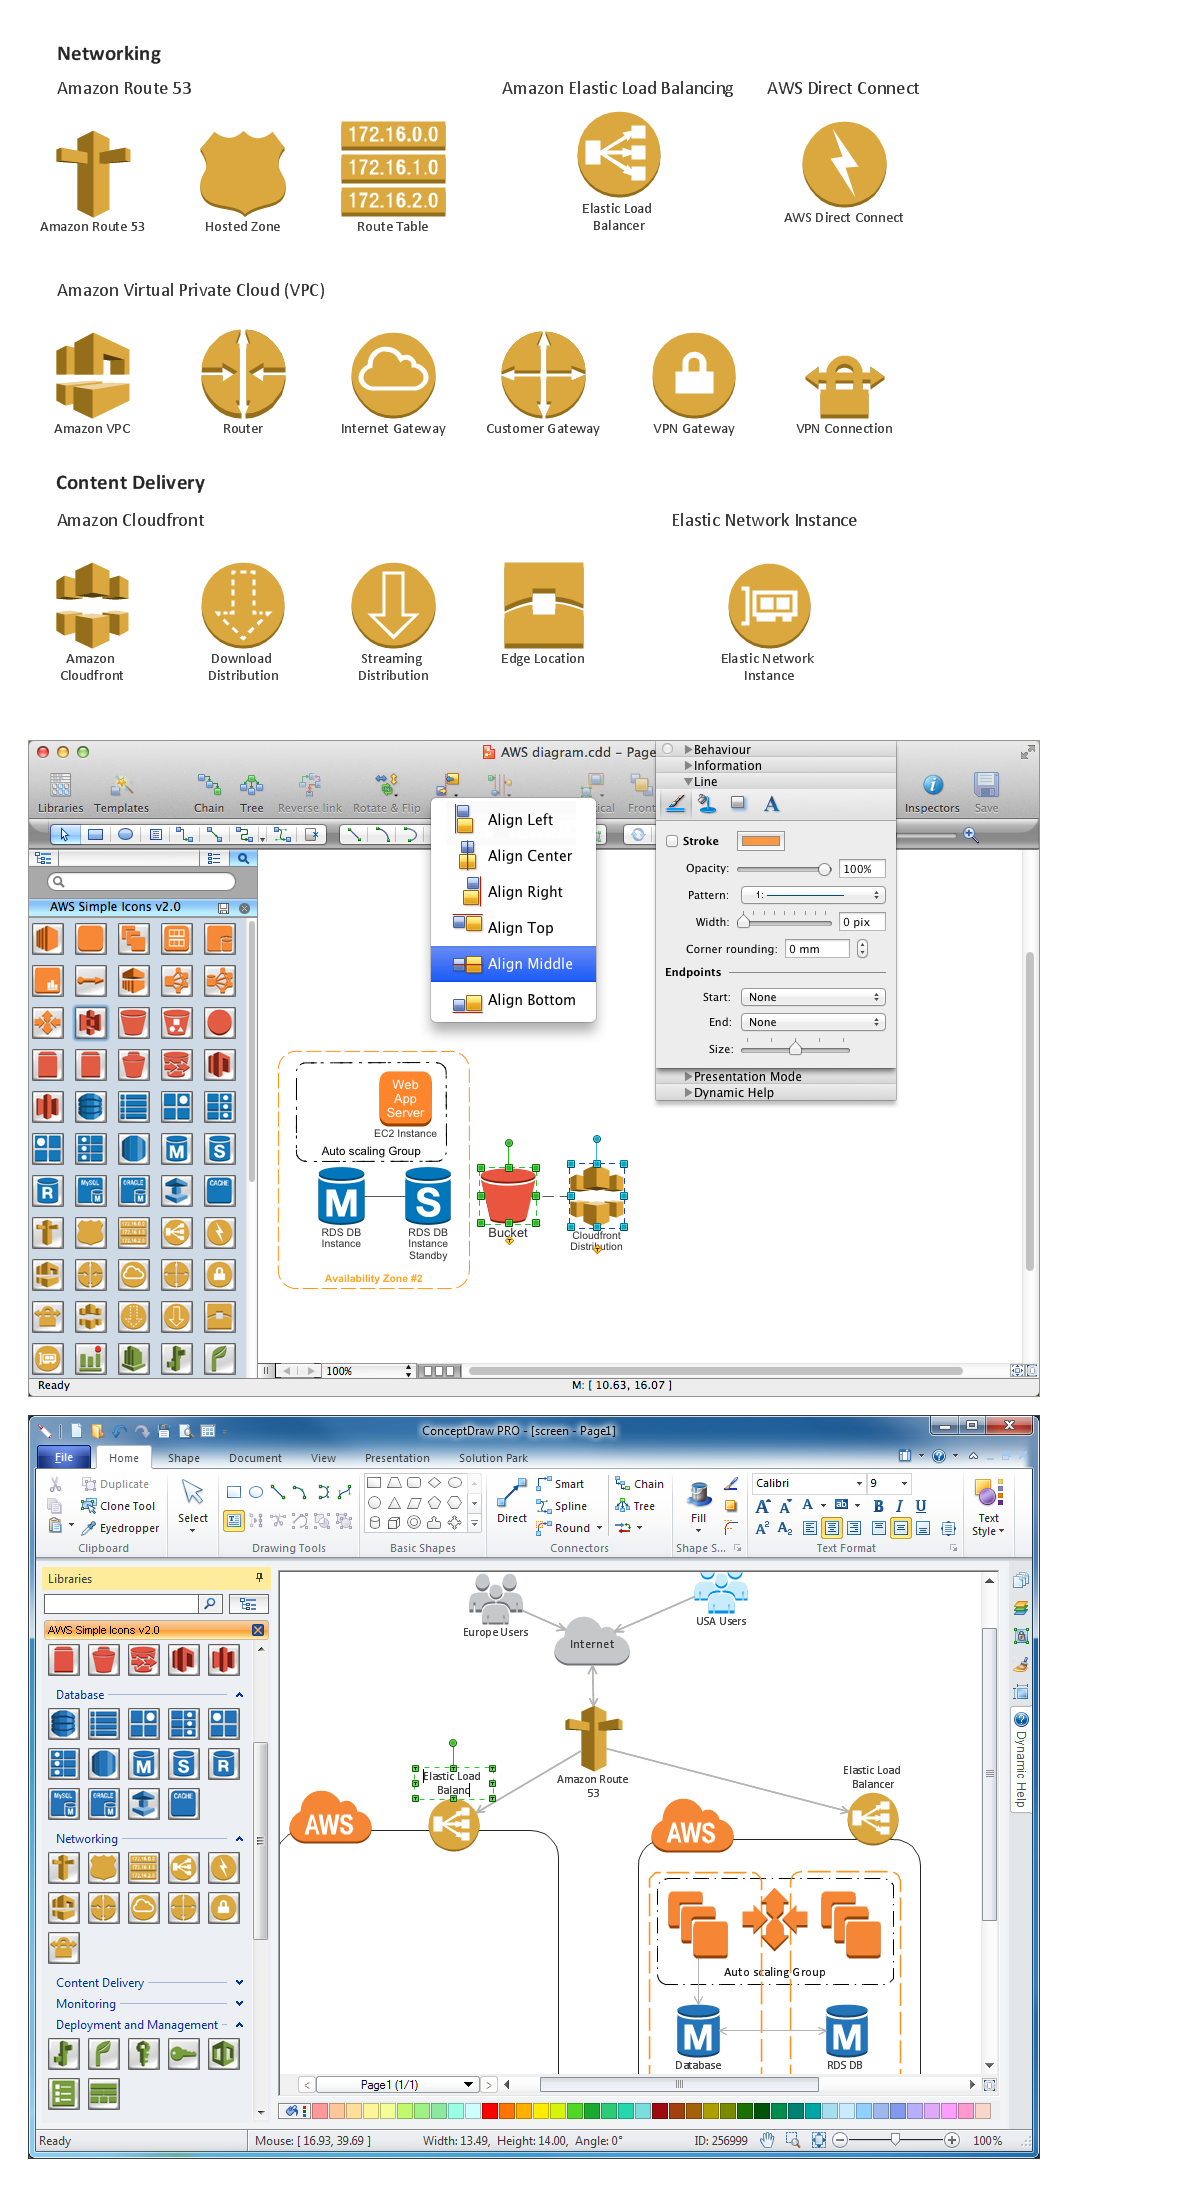
Picture: Diagramming software for Amazon Web Service icon set: Networking and Content Delivery
ConceptDraw DIAGRAM diagramming and vector drawing software extended with Cisco Network Diagrams Solution from the Computer and Networks Area is the best for creating Cisco Network Diagrams thanks to numerous predesigned Cisco network icons.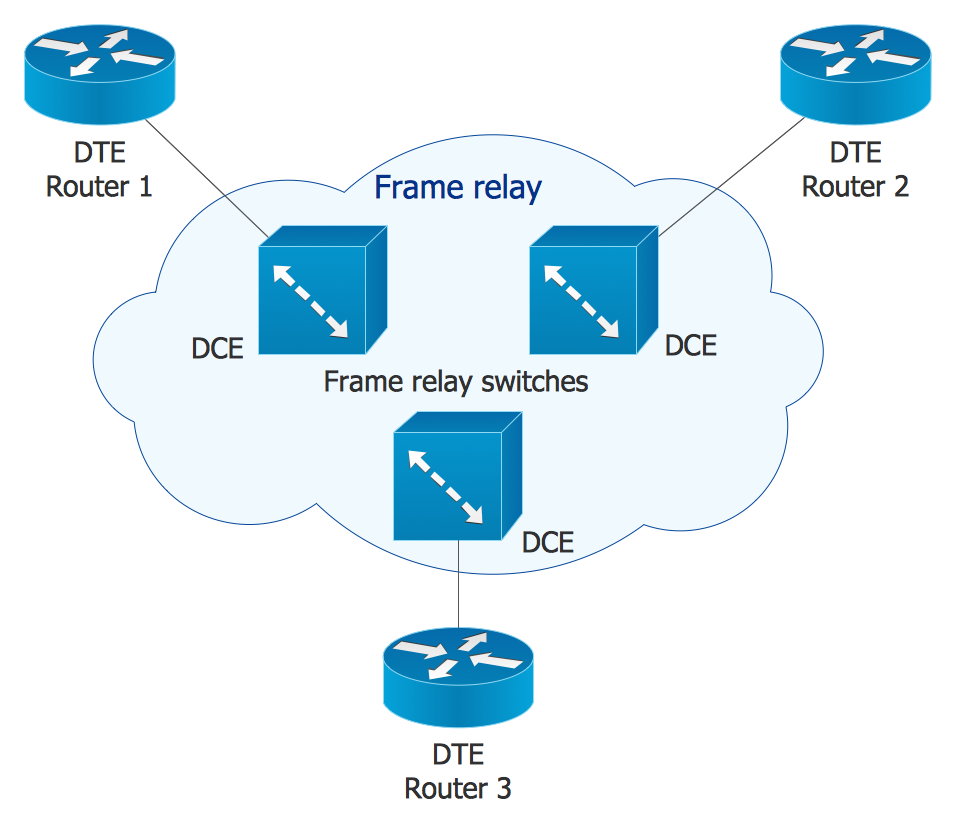
Picture: Cisco Network Icons
Related Solution:
A computer network diagram for a large network can be complicated and difficult both to understand and to draw. To learn how to deal with complex network diagrams, start with a basic network diagram, showing only the primary network devices and the connections between them. There are software tools to help you with that, such as ConceptDraw DIAGRAM , that include templates and examples for simple and common network diagrams.
The ConceptDraw solution for making computer network diagrams delivers over a thousand of vector objects, composed into the forty vector libraries that were developed to support drawing of professional-looking computer network diagrams. This diagram of computer network can be used by system administrator as a basic template for making the custom network diagram. Since the responsibilities of network or system administrator include documenting of computer network, drawing network diagrams is an important part of their work.
Picture: Basic Network Diagram
Draw Network Topology and Computer Network Diagrams, Designs, Schematics, and Network Maps using ConceptDraw in no Time!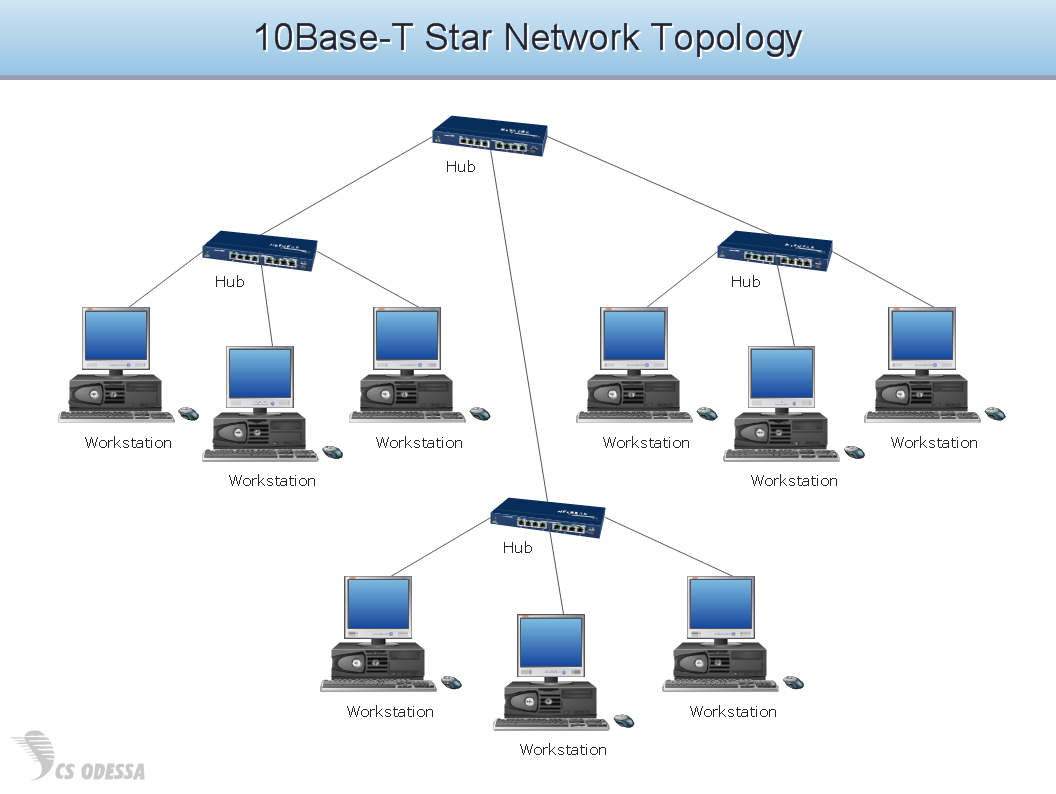
Picture: Network Diagram SoftwareTopology Network
It’s a challenge for any administer to set a brand new corporate network. Talking about network parameters, we should mention that network layout is important for network efficiency and reliability. After the budget is accepted, you need to make a network topology draft.
The diagram of computer network layout is a tool of IT specialists and corresponding departments of diversified organizations. Also the responsibilities of any network or system administrator include making network layout diagrams, since they are important piece of any network documentation package. ConceptDraw solution for networking and diagramming offers more than 1000 vector object, composed into the 40 libraries that are designed to to getting started with making professional network layout diagrams.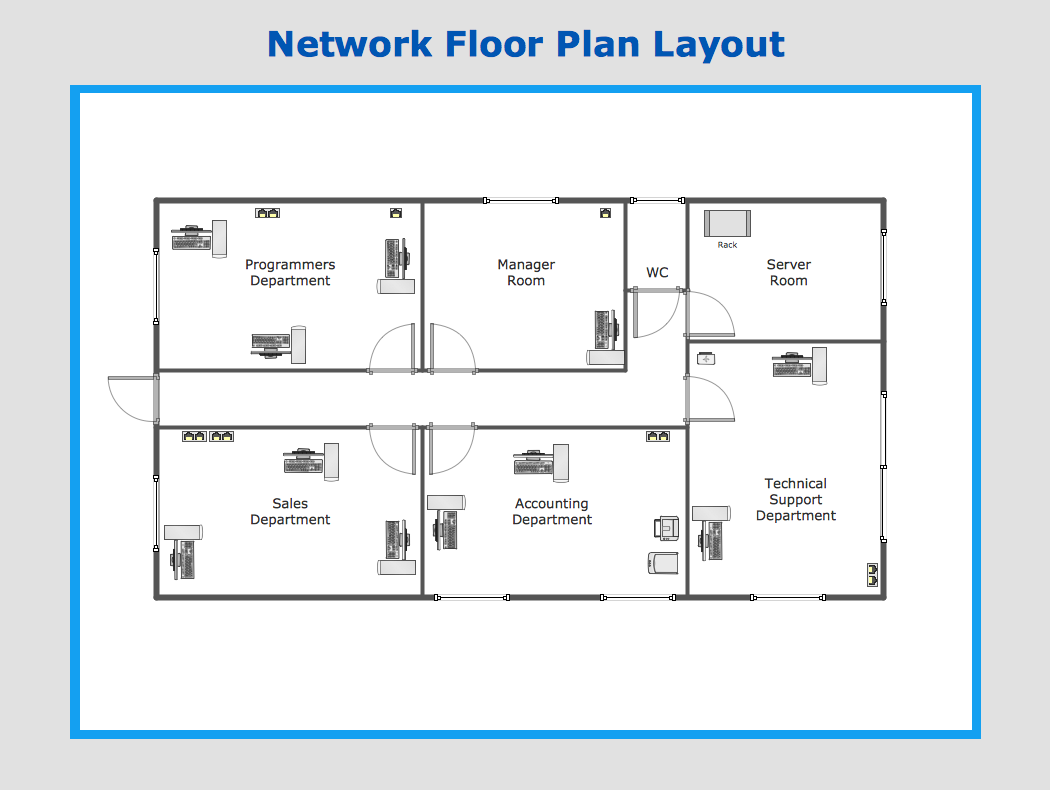
Picture: Network Layout
Special libraries of highly detailed, accurate shapes and computer graphics, servers, hubs, switches, printers, mainframes, face plates, routers etc.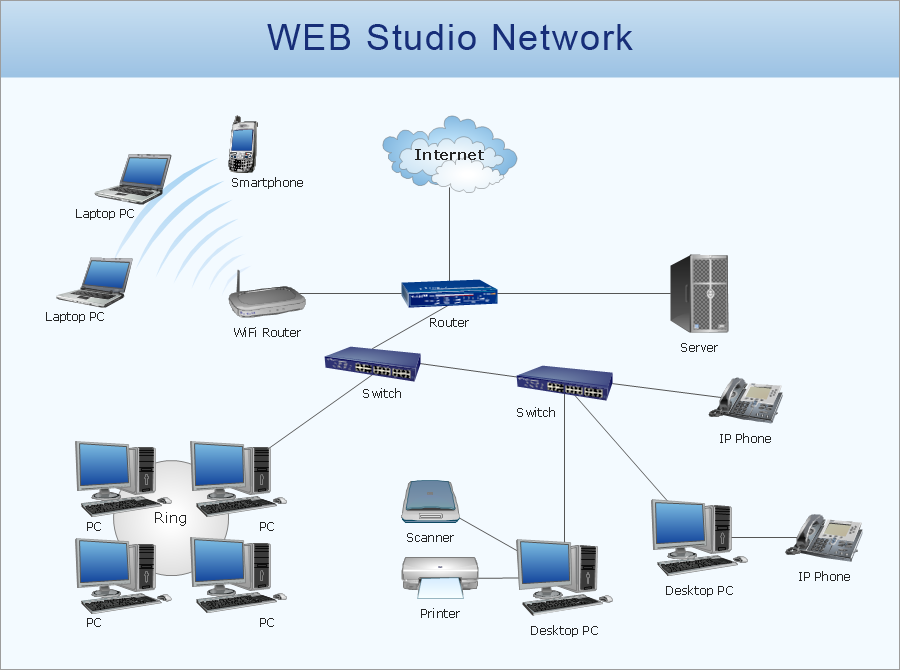
Picture: Network Printer
ConceptDraw Network Diagram Software - Network design software for network drawings with abundant examples and templates.
Create computer network designs, diagrams and schematics using ConceptDraw.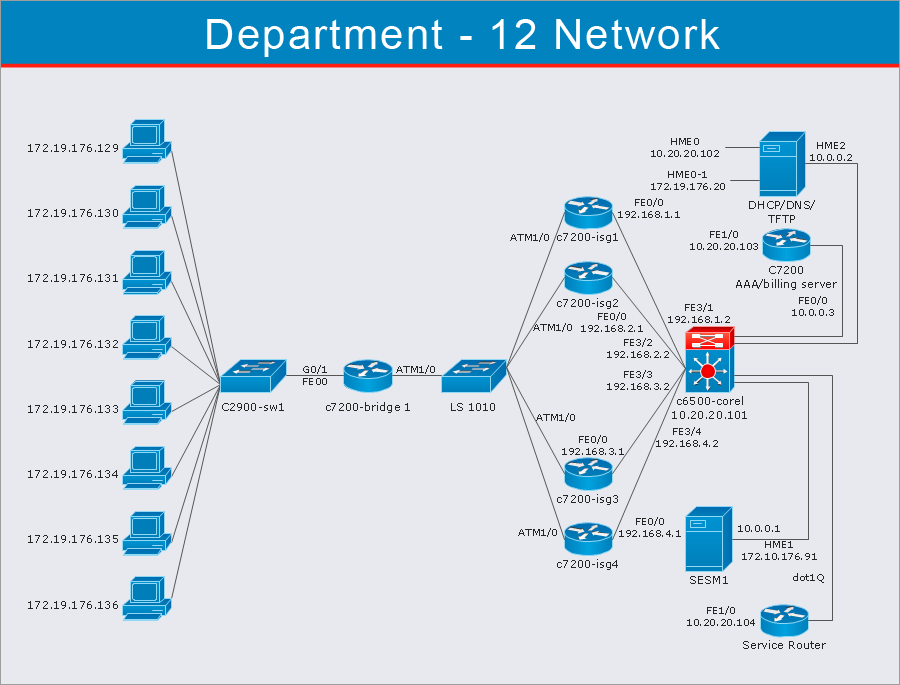
Picture: Network Diagram Software