
Pic.1 Template - TQM diagram.
This template of TQM Diagram is contained in the "Total Quality Management (TQM) Diagrams" solution located in the ConceptDraw Solution Park. It helps you to draw TQM diagrams using ConceptDraw DIAGRAM diagramming software quickly and easily.
This TQM flowchart template explains the meanings of the TQM design elements.
See also Samples:
TEN RELATED HOW TO's:
Tips on how to make an accounting flowchart. Describing methods and symbols that are used to represent the accounting system.
Picture: How to Make an Accounting Process Flowchart
Related Solution:
Decision Making - ConceptDraw OFFICE suite provides visual tools that are given support on the stage of the decision making.
The Seven Management and Planning Tools is a set for such diagrams: Affinity Diagram, Relations Diagram, Prioritization Matrix, Root Cause Tree Diagram, Involvement Matrix, PERT Chart, Risk Diagram (PDPC).
Picture: Decision Making
The visual form of mind maps is helpful in all stages of quality management, from describing problem to describing and documenting a decision.
Picture: Quality Project Management with Mind Maps
Related Solution:
The Time-Money-Quality Triangle illustrates an advertising truism, that you can't have all three.
Picture: Pyramid Diagram
Related Solutions:
An onion diagram is a kind of chart that shows the dependencies among parts of an organization or process. The chart displays items in concentric circles, where the items in each ring depend on the items in the smaller rings. The Onion Diagram is able to show layers of a complete system in a few circles.
But how to create Onion Diagram? Now, it's very easy thanks to the ConceptDraw DIAGRAM diagramming and vector drawing software extended with Stakeholder Onion Diagrams Solution from the Management Area of ConceptDraw Solution Park.
Picture: How To Create Onion Diagram
Related Solution:
Automatically create a presentation-quality diagram in one click with ConceptDraw DIAGRAM.
Picture: Visual Presentations Made Easy with Diagramming Software
Related Solution:
ConceptDraw DIAGRAM enhanced with Seven Basic Tools of Quality solution from the Quality area of ConceptDraw Solution Park is an ideal software for fast and easy drawing professional looking quality diagrams, including a Fishbone diagram.
Picture: Seven Basic Tools of Quality - Fishbone Diagram
Related Solution:
How to build segregation of duties using drawing tools from Accounting Flowcharts Solution for ConceptDraw DIAGRAM software.
Picture: Approval Process and Segregation of ResponsibilitiesAccounting Flowchart Example
Related Solution:
Flowcharts are used to represent accounting information in a system. In ConceptDraw software there are special symbols that are used to create accounting flowcharts.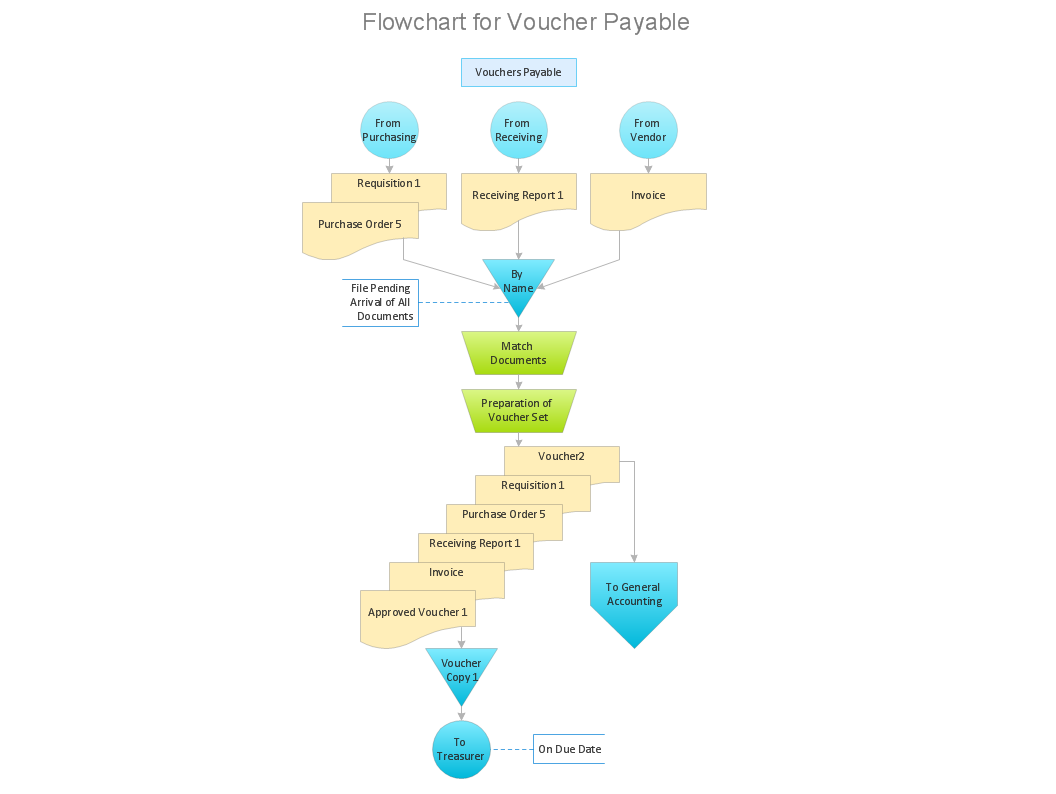
Picture: Why Flowchart is Important to Accounting Information System?
Related Solution:
ConceptDraw DIAGRAM diagramming and vector drawing software aspires to help its users in the hiring process and offers a powerful HR Flowcharts Solution from the Management Area of ConceptDraw Solution Park.
Picture: Hiring Process
Related Solution: